Embed and share
Last year, we released a Star Wars themed infographic on mobile app store statistics and history that was featured on 100+ different websites. We had so much fun creating it that we decided to rework the data into a video! Included are statistics from all of the major app stores, including Apple, Android, Blackberry, Nokia and more.
The numbers are pretty mind boggling! Even since we researched the infographic last year, we’ve seen the number of smartphones and app purchases increase dramatically. Here are a few of our favorite statistics from the video: – There are over 375,000 apps available in Apple’s App Store – Android has the biggest market share at 35% – 75% of the apps in Blackberry’s App World are paid – The average iPhone user has 48 apps installed on their phone – All Blackberry paid apps cost at least $2.00 – Revenue from mobile apps increased nearly $10 million from 2010 to 2011 Music: Jedi Theme Remix – Coyote Kisses View on Youtube
-
 Trevin serves as the VP of Marketing at WebFX. He has worked on over 450 marketing campaigns and has been building websites for over 25 years. His work has been featured by Search Engine Land, USA Today, Fast Company and Inc.
 -

WebFX is a full-service marketing agency with 1,100+ client reviews and a 4.9-star rating on Clutch! Find out how our expert team and revenue-accelerating tech can drive results for you! Learn more
The Internet in Real Time
Ever wonder how much is going on at once on the Internet? It can be tough to wrap your mind around it, but we’ve put together a nice visual that’ll help! The numbers show no sign of slowing down either.
Find out More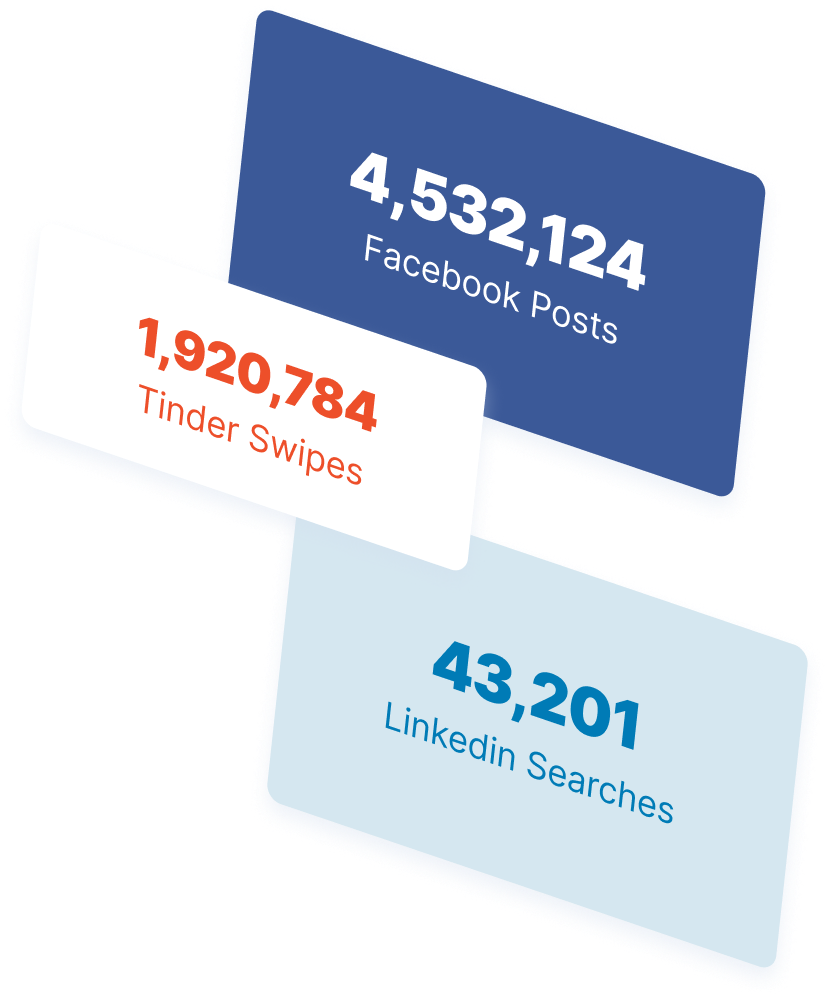
Share this article

Ready to Drive Results for Your Business?
See how WebFX uses SEO, PPC, Social Media, and Web Design to Drive Revenue for Businesses.
Get InspiredThe Internet in Real Time
Ever wonder how much is going on at once on the Internet? It can be tough to wrap your mind around it, but we’ve put together a nice visual that’ll help! The numbers show no sign of slowing down either.
Find out More