Helpful content enriches your website, but without a sufficient grasp of its performance, your continued initiatives can be haphazard. Content marketing analytics gives you solid data to steer your content and promotional strategies. Google Analytics has plenty of ins and outs, which can take guidance.
Check out these six common how-to questions about content marketing analytics. If you want to learn more about content marketing, feel free to give us a call at 888-601-5359! We’d love to talk to you about content marketing analytics, as well as how we can create a custom campaign for you.
1. How do we know if content marketing is driving conversions?
You produce content for a reason — to increase conversions. Whether with blog posts, videos, or infographics, you’re looking to achieve results that can enhance your business. So, how can you know if your content marketing company is doing its job?
First, using Google Analytics for content marketing, you need to establish definite goals so you can measure your progress. You can customize these for your business based on the destination, duration, page views, or event actions. After you create clear marketing objectives for your business, you have a meaningful trajectory that can keep your content on a steady course.
Next, Google Analytics’ segment conditions and sequences can give you insight into user activity. Advanced segment sequences are particularly useful for observing conversions from content marketing. To add segments, enter Google Analytics and choose the “Add Segment” option.
Then select “New Segment” and navigate to the “Sequences” section. 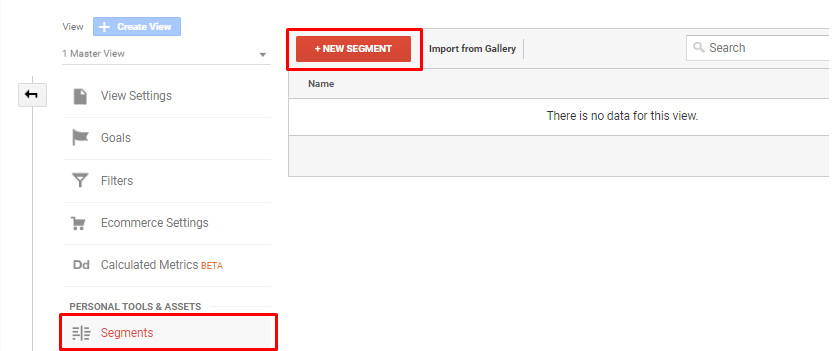 This allows you to receive reports about visitors’ specific behavior relative to your goals. To arrange a sequence, organize the initial step to be “Page” with your page or blog post’s link as the contents.
Lead into the next step by clicking “Is Followed By.” The subsequent move can be your chosen objective, and this prepares you to stay updated on the performance of your content.
2. How can we discover content marketing analytics gaps?
With keyword insights, your content can cover most of the topics your potential customers care about. However, there are some ideas that you may have missed. You can take advantage of the topics that extend beyond general keyword popularity when you review certain user actions.
Visitors can end up on your website, looking for relevant resources without finding helpful information, and analytics can repurpose their unsuccessful searches into topic inspiration. You can gather ongoing ideas for content by tracking search exits and the gaps that sparked them. In Google Analytics, you can find your way to “Search Terms” by opening “Behavior” then “Site Search.” The “Search Terms” portion lists your website’s search history.
It also shows which searches keep visitors on your website and which ones cause exits. Search exits reveal the gaps in your resources, and these can become your next content topics if they’re pertinent to your business. Examining search exit trends can divulge the most sought-after topics that your website is lacking.
Recurring terms can connect you to the content that prospective customers value.
3. How much of our content do people read?
As you put effort and important information into your content marketing, you want it to resonate with visitors and turn into conversions. If your content is not compelling or practical, they may only stick around for so long — and it could be fewer than 15 seconds, like 55 percent of website visitors. Depending on the extent of interest in your content, you may need to change your marketing strategy.
Following the habits of users can help you reorient your material for better engagement. Google Analytics’ scroll depth trigger, user bounce rate, and time on page record the impact of your content on visitors. The scroll depth trigger is the most telling factor to determine where visitors stop reading in blog posts and on internal pages.
This detects the areas where users end up, and it places a mark on the location. You can decide to measure vertical and horizontal scroll depths in percentages or pixels. To arrange the scroll depth trigger, go to Google Tag Manager and choose “New” under “Trigger.” Select “Trigger Configuration” and specify “Scroll Depth.” After you’ve picked the trigger details, this begins to collect data on the amount of content that captures visitors’ attention on the designated pages.
You can either shorten content to hold readers’ attention or improve the relevancy of pieces.
4. How do we know the best time and day for us to publish content?
Your editorial calendar for content marketing can capitalize on profitable days and times for releasing content. Google Analytics displays the most strategic publishing times to draw in visitors and make sales. On the executive dashboard, there is an automatic chart and heat map for the overall performance based on days and hours.
You can also hone in on specific elements via Google Analytics’ customer reports. You can select explorer, flat table, and map overlay to see the data patterns. The flat table option allows you to transfer the information to Excel and further manipulate visuals for your presentation and sharing needs.
The dimensions that can convey the ideal timing are “Day of Week Name” and “Hour.” Underneath the dimensions option, there are metrics, which you can adjust to match your objectives. Once you know the most effective schedule for user reactions, you can alter your editorial calendar to maximize peak times.
5. How can we tell how people are interacting with our content?
As visitors interact with your content, you want their experience to be smooth and agreeable. Glitches and flaws can disrupt the flow as people move toward your intended goal, but checking usability on Google Analytics is a productive way to manage issues. Testing and feedback forms can collect vital input on usability, but Google Analytics’ navigation summary and behavior flow can demonstrate where difficulties exist.
Navigation summary features the relationships between pages on your website, and strange connections can exhibit inconsistencies and distorted page structures. Behavior flow traces the visitor’s journey around the website, which can also pinpoint problem areas. 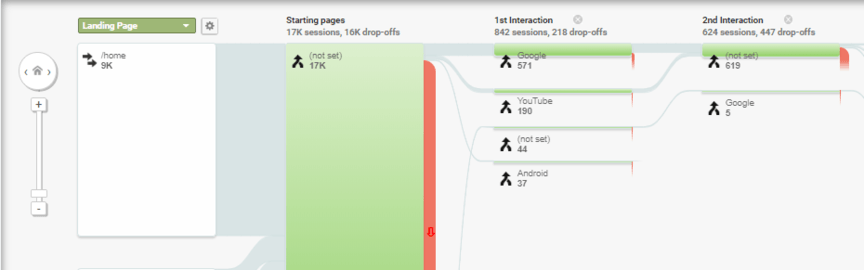
6. How can we see who is reading our content?
When you identify which groups respond well to your content, this can guide your future content marketing analytics. To check who reads your content, you can log into Google Analytics and explore the audience section. The audience portion explains the demographic clusters your content attracts.
Demographic categories include age, gender, location, and language. This tool also shows the device they access the posts on. You can see if mobile or desktop users favor your material, and it also fills you in on whether Android or iOS users are frequenting your apps.
Behavior and interest-based audience elements can shape your marketing campaigns and cultivate your buyer persona. You can analyze who your content is reaching and pulling in from other websites and social media platforms in the traffic sources zone. Cookies convey what third-party websites your visitors are traveling to your website from.
This will all prepare your business for more successful content marketing analytics.
93% of WebFX customers are extremely satisfied with their digital marketing results.
“Working with WebFX, everything is very organized and strategic. We’re only a year into our partnership, and our expectations have definitely been met.”
View More Client Testimonials
Get professional help with content marketing analytics
As a business owner, Google Analytics tools for content marketing can improve your strategy and content marketing. However, it’s not only the tools you use, but also the expertise of professionals that can advance your business. At WebFX, we provide resources and expertise to instill success in your online marketing campaign.
Our team offers a holistic marketing solution to increase your ROI with our web analytics services. Please contact us online today or call us at 888-601-5359 to learn more about our innovative digital marketing services.
-
 Trevin serves as the VP of Marketing at WebFX. He has worked on over 450 marketing campaigns and has been building websites for over 25 years. His work has been featured by Search Engine Land, USA Today, Fast Company and Inc.
 -

WebFX is a full-service marketing agency with 1,100+ client reviews and a 4.9-star rating on Clutch! Find out how our expert team and revenue-accelerating tech can drive results for you! Learn more
Try our free Marketing Calculator
Craft a tailored online marketing strategy! Utilize our free Internet marketing calculator for a custom plan based on your location, reach, timeframe, and budget.
Plan Your Marketing Budget
Table of Contents
- 1. How Do We Know if Content Marketing is Driving Conversions?
- 2. How Can We Discover Content Marketing Analytics Gaps?
- 3. How Much of Our Content Do People Read?
- 4. How Do We Know the Best Time and Day for Us to Publish Content?
- 5. How Can We Tell How People Are Interacting with Our Content?
- 6. How Can We See Who is Reading Our Content?
- Get Professional Help with Content Marketing Analytics
Share this article

Maximize Your Marketing ROI
Claim your free eBook packed with proven strategies to boost your marketing efforts.
Get the GuideTry our free Marketing Calculator
Craft a tailored online marketing strategy! Utilize our free Internet marketing calculator for a custom plan based on your location, reach, timeframe, and budget.
Plan Your Marketing Budget