
One of the biggest mistakes you can make with your pay-per-click (PPC) advertising is to launch your ads and assume you’re done. Realistically, the launch of your PPC ads is just the start. Once you start running your ads, you must track your PPC key performance indicators (KPIs) to see how your ads perform.
The reason it’s critical to track your PPC KPIs is that you won’t have any idea what results your ads drive without tracking. Maybe they’re racking up revenue, or maybe they’re costing more than they’re earning. The only way to find out is to track PPC metrics.
But which metrics should you track? If you’re unsure about the answer to that question, don’t worry — we’ve got you covered. Just keep reading to learn more!
Then subscribe to Revenue Weekly — our email newsletter — to receive more digital marketing tips right in your inbox!
7 paid advertising metrics to track
There are many potential KPIs for PPC, making it difficult to figure out which ones should command your attention.
If you’re looking to measure your PPC KPIs faster, try our free PPC Tool Kit
Here are seven paid advertising metrics for your business to track and analyze!
1. Quality Score
One of the first PPC KPIs you should look at is Quality Score. Quality Score is a metric in Google Ads that measures the overall quality of your ad campaigns. A high Quality Score usually indicates a higher chance of showing up in search results and reaching users.
Technically, Quality Score doesn’t determine whether your ads show up in search results –– Ad Rank and your bid amount does. But Google uses the same set of factors to determine your Quality Score and your Ad Rank.
That means that keeping up with your Quality Score is still a good way to improve your ad’s positioning. And unlike with Ad Rank, Google Ads will give you some insights into how to improve your Quality Score.
By reoptimizing your ads and boosting your Quality Score, you can improve your ads’ chances of showing up higher in search results.
2. Average position
When your ads appear in search results, they’ll appear alongside multiple other ads. When that happens, there’s an advantage to ranking above those ads, just as there’s an advantage to ranking at the top of organic results.
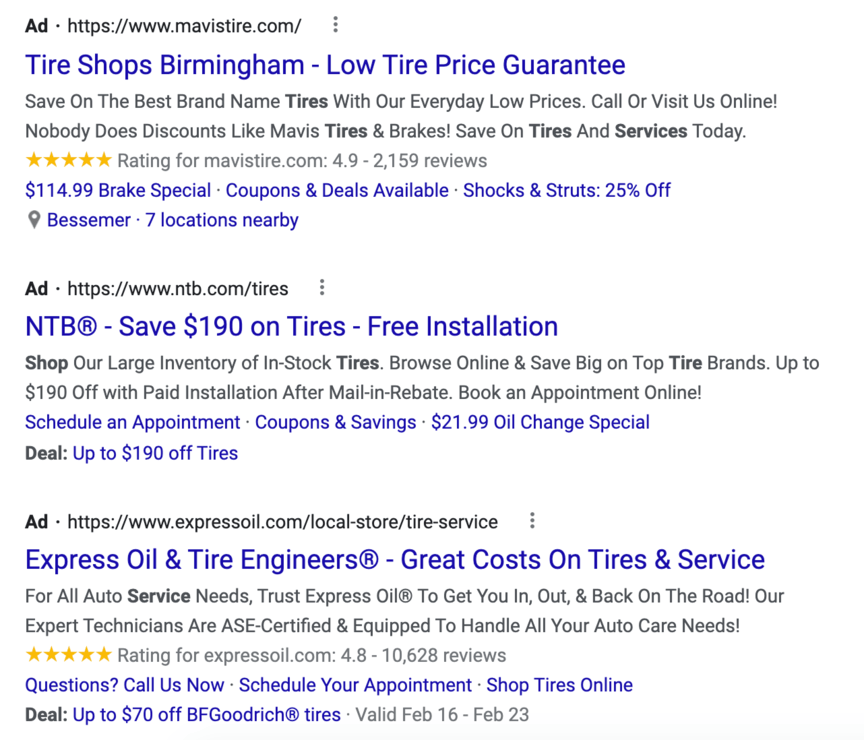
Your ads’ spot in those rankings is referred to as position. To see where your ads most commonly appear, you can look at average position. That will tell you where your ads tend to rank relative to the other ads that appear alongside them.
If you have a low average position, you can benefit from reoptimizing your ads to rank higher. Consider looking at the ads appearing above yours to see what they’re doing differently.
3. Click-through rate (CTR)
Click-through rate (CTR) measures the percentage of people who see your ads and end up clicking on them. To calculate CTR, you can divide your total clicks by your total impressions and multiply by 100.
So, let’s say that on a given day, 50 people see your ad. On that same day, 10 people click on that ad. To find your CTR, you would divide 10 by 50 and then multiply by 100, giving you a CTR of 20%. That means that of the people who saw your ad, 20% of them clicked on it.
A low CTR indicates that even if plenty of people are seeing your ad, few of them want to click on it. That may be because your ad header isn’t very compelling or because you’re not targeting the right audience.
4. Conversion rate
Clicks aren’t the only important thing when it comes to your PPC campaigns. That’s because even if a billion people clicked on your ads, it wouldn’t mean anything if none of them become customers. That’s why you should also track conversion rate.
Conversion rate measures what percentage of clicks end in conversions. So, if 10 people click on your ad and then 4 of them convert, you have a conversion rate of 40%.
A low conversion rate indicates that people click your ads, but they’re not swayed by the ad copy to make a purchase. To boost your conversion rate, you could try reoptimizing your landing pages to be more compelling.
5. Cost per click (CPC)
The last three paid advertising metrics on this list all relate to cost. First, you’ll want to keep up with your cost per click (CPC). This metric is exactly what it sounds like — a measurement of how much money you spend for each click your ads receive.
To calculate CPC, divide your total costs by your total number of clicks.
The reason this PPC KPI is so useful is that it helps you put your spending into perspective. Looking at the total cost by itself, it’s hard to see how much you get for your money.
For instance, if you spend $50 over a given period, all you know based on your total cost is that you’ve spent $50. That might be good or bad — it depends! If you’ve earned 50 clicks in that time, it’s great — a CPC of $1. But if you earned two clicks, that’s a CPC of $25 — far worse.
6. Cost per acquisition (CPA)
Just like you should track both CTR and conversion rate, you should also track both CPC and cost per acquisition (CPA). “Acquisition” in this context means the same thing as “conversion,” so you’re essentially measuring your cost per conversion.
This metric is useful for the same reason CPC is useful — it gives you a clearer perspective on your spending. Sometimes you might have a high CPC but a low CPA.
For instance, if you spend $50, earn 25 clicks, and earn two conversions, that means you have a CPC of $2 (good!) but a CPA of $25 (not so good). Even if your CPC looks good, your CPA might indicate that you need to reoptimize to earn more conversions.
Plus, keep in mind that you can refine your ad campaigns to reduce waste on spending, ensuring that it costs less to gain new customers.
7. Return on ad spend (ROAS)
Finally, one of the most important KPIs for PPC that you can track is return on ad spend (ROAS). ROAS is essentially a measure of profit — it measures how much money you’re earning after marketing and acquiring customers.
So, let’s say you spend $100 on your paid advertising within a given timeframe. In that same timeframe, you earn a total of $150 from those paid ads. In that scenario, your ROAS would be $50, because that’s how much profit you ultimately made.
You want your ROAS to be above a 1:1 ratio — A 1:1 ratio means you’re breaking even by making $1 for every $1 spent. While the average ratio is around 2:1, it’s good to aim for a 4:1 ratio to maximize your return.
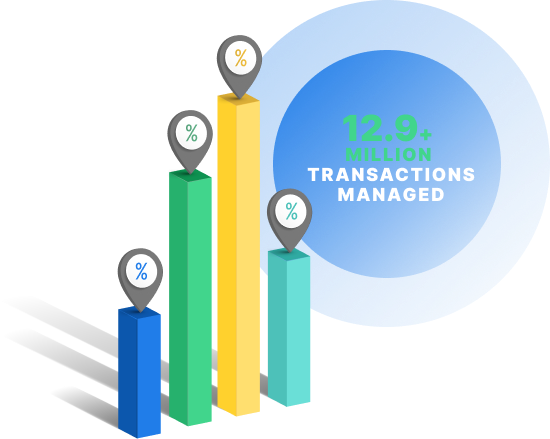
Our long list of services helps you grow every aspect of your business with marketing strategies that are proven to increase bottom-line metrics like revenue and conversions. In the past 5 years, we’ve managed more than 14.9 MILLION transactions across our client base.Time to Level Up Your Sales
WebFX can help you boost your PPC metrics
Want a helping hand reoptimizing your paid advertising campaigns? WebFX is here for you! We have more than 28 years of experience with paid advertising, and we know exactly what it takes to boost your PPC metrics and earn you more revenue.
When you partner with us for our PPC services, you’ll get help optimizing all the KPIs for PPC listed above — and more! Here at WebFX, we pride ourselves on being a “do-it-for-me” agency, meaning you’ll only have to be as involved as you want to be in the reoptimizing process.
To get started with us, just call 888-601-5359 or contact us online today!
-
 Matthew is a marketing expert focusing on the SEO & martech spaces. He has written over 500 marketing guides and video scripts for the WebFX YouTube channel. When he’s not striving to put out some fresh blog posts and articles, he’s usually fueling his Tolkien obsession or working on miscellaneous creative projects.
 -

WebFX is a full-service marketing agency with 1,100+ client reviews and a 4.9-star rating on Clutch! Find out how our expert team and revenue-accelerating tech can drive results for you! Learn more
Cost Per Click (CPC) Calculator
Do you advertise on platforms that charge per click? Use our calculator and figure out exactly how many clicks will fit within your budget.
Calculate Your CPC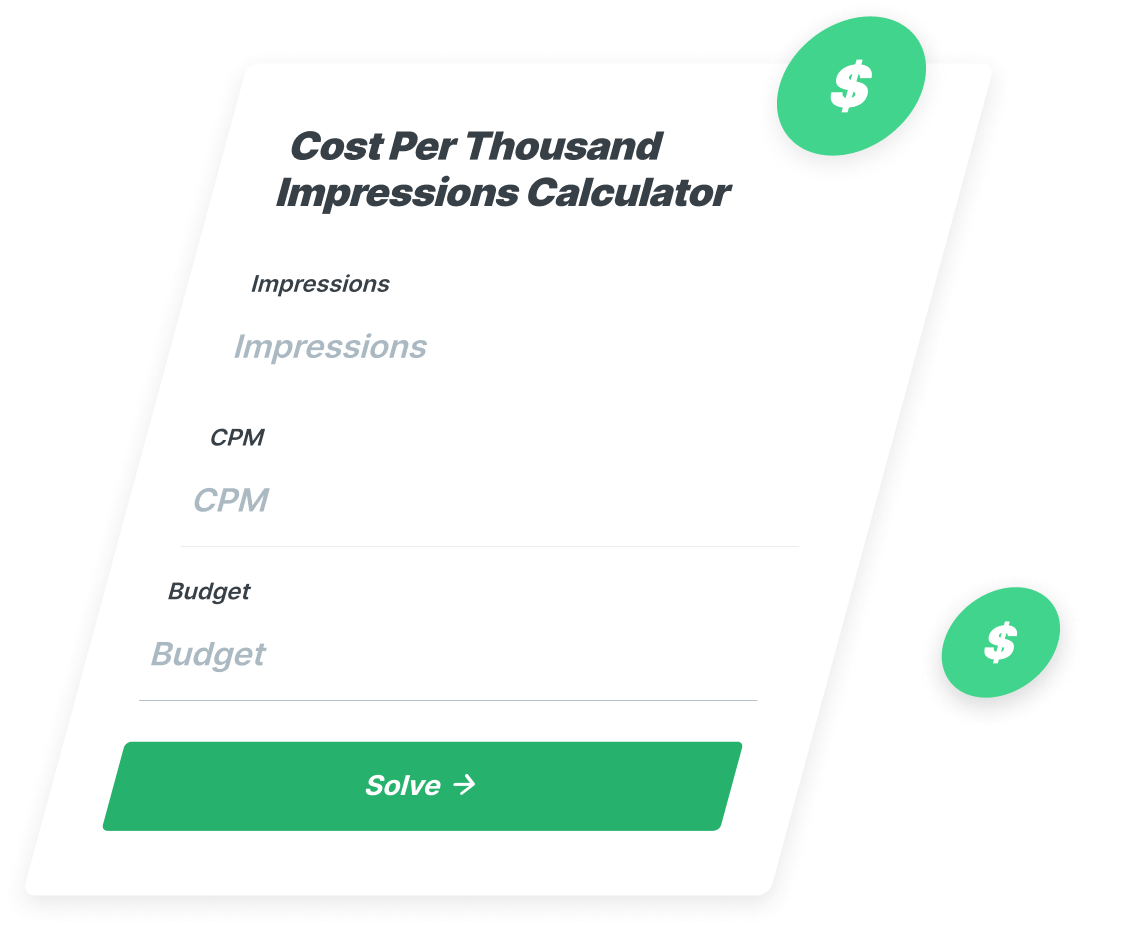
Share this article
Cost Per Click (CPC) Calculator
Do you advertise on platforms that charge per click? Use our calculator and figure out exactly how many clicks will fit within your budget.
Calculate Your CPC