Johnathon creates content for his company to help them reach new prospects. He posts his content on the company’s blog and hopes that people will find it and read it. Johnathon is making one of the biggest content marketing mistakes — he’s not monitoring his content to see how it performs.
If you want to see success with content creation, you need to measure content marketing’s effectiveness and performance. Without monitoring and measuring, you won’t know if you’re creating content that drives results for your business. On this page, we’ll share:
- How to measure your content marketing return on investment (ROI)
- Which content marketing metrics to monitor
- Tips for creating an effective content marketing strategy
P.S. Want to get the latest tips and tricks for creating an effective marketing plan? Join 200,000 marketers by subscribing to Revenue Weekly!
How to measure content marketing ROI
The first step to determining if your content is effective is to measure the ROI of your content. Your content marketing ROI is a percentage that shows how much revenue you gained through creating content compared to how much you spent to make that content.
To calculate your content marketing ROI, use this formula:
(Return – Investment) / Investment x 100 = Content Marketing ROI
So, let’s say you spend $200 to create a piece of content, and you get a $1000 sale from that piece of content. If you plug those numbers into the formula, it looks like this:
(1000-200) / 200 x 100 = 400%
As you can see, your ROI is 400% from creating that piece of content. By using this formula, you can see how your content drives revenue and where your content falls short.
Content marketing metrics to monitor
If you want to know how to measure content quality, start by choosing the right metrics to monitor.
The metrics you choose will depend on what you want to achieve. Let’s break down some common goals for content marketing and show you which content marketing metrics to monitor.
Brand awareness
If you choose brand awareness as your goal, you focus on helping people discover and get familiar with your brand. For this goal, you can track the following content marketing metrics:
- Website traffic: See how many people visit your page and check out your content
- Page views: Learn how many views your piece of content gets
- Video views: See how many people watch your video
- Unique visitors: Calculate the number of unique visitors that find your content
- Unique page views: Discover the number of sessions during which the page got viewed one or more times
 These metrics are great to monitor for brand awareness because they enable you to see how many people are interacting with your brand and how many visitors you’re driving with your content to your site. It allows you to understand better who’s spending more time investigating your brand to learn more about it.
Engagement
Engagement monitors how users interact with your brand and get to know your business. This goal is common if you’re focusing on building up your branding and helping people get more familiar and comfortable with your business.
Here are some metrics you’ll monitor with engagement:
- Comments: Comments are a great way to monitor engagement with your brand. You can see who’s commenting on your blog posts or, if you share a blog link to your social profiles, see who’s commenting on that post on different social networks.
- Shares: Social cues are the prime measurement for shares in terms of engagement. If people like, share, tweet, or re-pin, it’s considered a social engagement.
Lead generation
Lead generation focuses on people who show an interest in your brand and are seriously considering your products or services. Here are a few metrics you can monitor if your goal is lead generation:
- Form completion: If your content features a sign-up form, you can track your lead generation efforts by monitoring how many people complete your form. You can also measure if people fill out a form on a separate page later (after reading your content) via assisted conversions.
- Downloading content: Another lead generation metric to monitor is downloads. If you’re offering additional content to pair with your content, like a downloadable checklist, you can track how many people opted to download your content.
- Email subscription: If you’re focusing on capturing leads through email, you can monitor which pieces of content drive email subscriptions, like for a webinar, piece of downloadable content, or something else.
- Blog subscription: If you want to capture leads through your blog rather than email, you can monitor how many people sign-up for blog updates.
Sales
If your goal is to increase sales, you can monitor blog performance to see how many people convert after reading your content. Some people may read your blog and visit another page before converting. While this may not be the last page they see on your site, you can still attribute that page to a lead, sale, or another conversion.
This scenario is known as an assisted conversion. The best metric to monitor is your conversion rate. Your conversion rate will help you identify content that pushes leads towards purchasing and ultimately gets them to convert.
You can track this metric to see if your content successfully enables you to drive more sales.
Measure content marketing: 3 tips on how to measure content quality
Now that you know how to measure content marketing’s ROI and which metrics to track, it’s time to learn how to maximize your content marketing monitoring to get the most from your strategy. Let’s look at three tips on how to measure content quality more effectively for your business:
1. Focus on actionable metrics for the right goals
When you measure content marketing, you want to ensure you’re focusing on actionable metrics that fit with your goals. You don’t want to waste time on metrics that don’t align with your goals. So, for example, if you’re focused on generating leads, monitoring metrics like website traffic or video views aren’t pertinent to your goals.
These metrics would distract you from the metrics that indicate the progress of your lead generation efforts. Stay focused on the right metrics for your goals, so you can accurately determine if you’re driving success for your business.
2. Automate your data collection
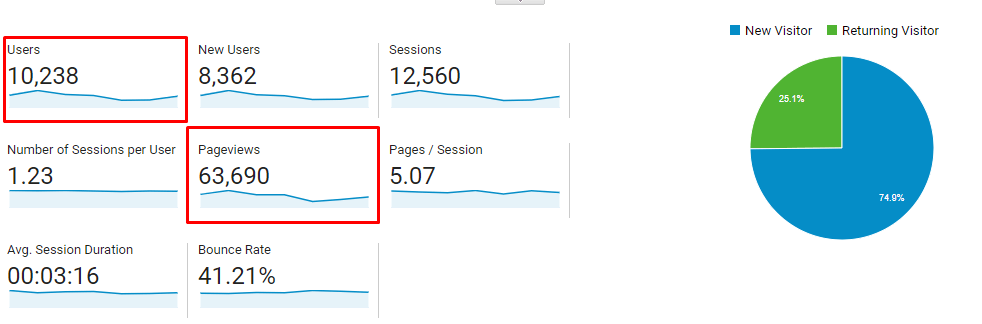
When you learn how to measure content marketing ROI, you find that you need to gather an abundance of data to help you see if your content is driving success. With so much data at your fingertips, you want to ensure you automate your data collection to make it easy for your business. You can use a tool like Google Analytics to gather data about how your audience interacts with your content.
This tool helps you see metrics like users, sessions, and more. 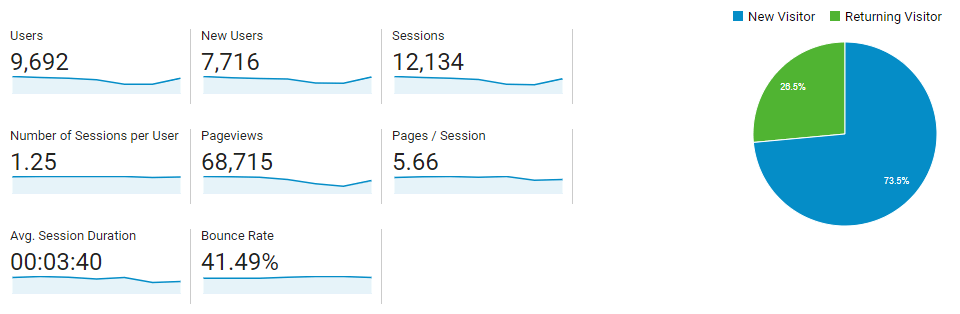 You can also use a tool like MarketingCloudFX to help you compile your data in one place. You can see what content pages your audience visits, how they find your content, and more.
3. Be ready to adapt
An important thing to remember when you learn how to measure content quality is that you need to be flexible and adapt. As you monitor your content, you may find that you’re driving less than desirable results with certain types of content. If you see negative results, you need to be flexible and adapt your content strategy to help you drive better results with your content.
You may find that some strategies that worked previously don’t work for you now. Your company may try a new approach and see that your audience doesn’t respond well to it. Regardless of the situation, you always need to be prepared to adjust your content marketing strategy for your audience.
When you measure content marketing success, always have your next idea in mind, so you can quickly make changes to your strategy and drive better results for your business.
Start to measure content marketing results today
Content marketing is a valuable strategy. It can help you increase traffic to your site and capture more leads for your business. If you don’t measure your content marketing strategy, however, you’ll never know if you’re driving results with your content.
At WebFX, we have over 28 years of experience in helping our clients create valuable content. We’ve written over 4,000+ blog posts and worked in over 200+ industries. You can feel confident that we have the knowledge and experience to deliver a stellar content marketing campaign.
Ready to launch your content marketing campaign? Contact us online or call us today at 888-601-5359 to speak with a strategist!
-
 Macy is a marketing writer with over five years of experience creating content for dozens of industries including food and beverage, home services, and education. She also specializes in creating SEO and PPC content. Her work has been featured by Search Engine Journal, HubSpot, Entrepreneur, Clutch, and more. In her free time, Macy enjoys trying new crafts and reading comic books.
 -

WebFX is a full-service marketing agency with 1,100+ client reviews and a 4.9-star rating on Clutch! Find out how our expert team and revenue-accelerating tech can drive results for you! Learn more
Try our free Marketing Calculator
Craft a tailored online marketing strategy! Utilize our free Internet marketing calculator for a custom plan based on your location, reach, timeframe, and budget.
Plan Your Marketing Budget
Share this article
Maximize Your Marketing ROI
Claim your free eBook packed with proven strategies to boost your marketing efforts.
Get the GuideTry our free Marketing Calculator
Craft a tailored online marketing strategy! Utilize our free Internet marketing calculator for a custom plan based on your location, reach, timeframe, and budget.
Plan Your Marketing Budget