

Table of Contents
- At a glance: YouTube advertising benchmarks
- Which YouTube ad benchmarks matter most and why?
- Attention and view benchmarks
- Key insights
- Click and active engagement benchmarks
- Key insights
- Conversion and business outcome benchmarks
- Key insights
- How to use YouTube advertising benchmarks for awareness, consideration, and lead generation
- Awareness campaigns
- Consideration campaigns
- Lead generation and sales campaigns
- How to interpret YouTube advertising benchmarks without misleading yourself
- Skippable vs. non-skippable YouTube ad benchmarks
- Skippable YouTube ad benchmarks measure voluntary attention
- Non-skippable YouTube ad benchmarks measure message delivery
- Frequently asked questions
- Start tracking your YouTube ad benchmarks today
- Our methodology
Key takeaways
- Skippable YouTube ads typically see a 15% to 25% view rate and 30 to 45 seconds of average watch time.
- The YouTube ad benchmark for click-through rate (CTR) is 0.5% to 1.5%. TrueView ads’ CTR benchmark is around 0.8%, while display ads on YouTube typically see 0.15% to 0.25%.
- The conversion rate benchmark is 1.5% to 3.0%, while the view-through conversion rate benchmark is 0.2% to 0.8%, helping you measure both direct and delayed action.
- The cost per view (CPV) benchmark is $0.10 to $0.30, while cost per action (CPA) benchmark ranges from $20 to $100.
- The right YouTube ad benchmarks to track depend on your campaign goal, ad format, audience, and business context.
A “good” YouTube ad performance result can mislead you.
That’s why benchmark data matters. You need more than surface-level figures to judge whether your YouTube ads are performing well, especially when your campaign’s view, click-through, and conversion rates don’t seem to add up.
If you want a fast read on performance, start with these YouTube advertising benchmarks:
- View rate: 15% to 25% for skippable ads
- Click-through rate: 0.5% to 1.5%
- Conversion rate from YouTube ads: 1.5% to 3.0%
Get the full benchmark breakdown and what those numbers can tell you about your YouTube ad performance:
- Which YouTube ad benchmarks matter most and why
- How to use YouTube advertising benchmarks for awareness, consideration, and lead generation
- How to interpret YouTube advertising benchmarks without misleading yourself
- Skippable vs. non-skippable YouTube ad benchmarks
- FAQs
At a glance: YouTube advertising benchmarks
Use these ranges as reference points, not fixed performance goals you must aim for.
When comparing your campaign type to these benchmarks, keep in mind that ad format, targeting, creative quality, funnel stage, and your competitors’ activities can affect your numbers.
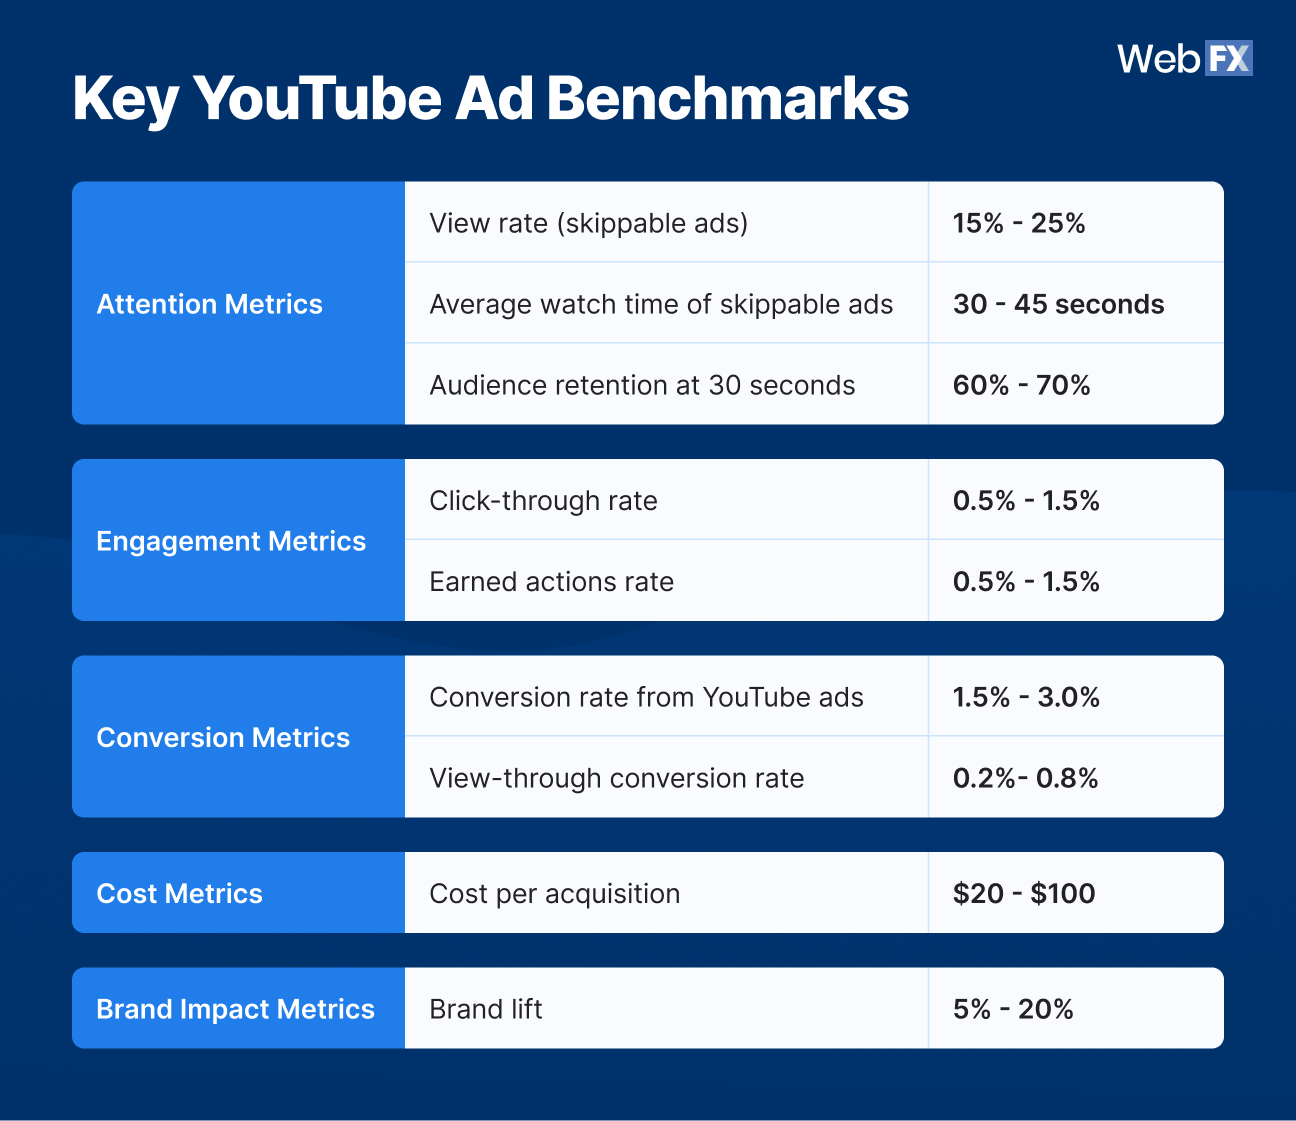
Table View
| Key YouTube Advertising Benchmarks | |
| Attention Metrics | |
| View rate (skippable ads) | 15% – 25% |
| Average watch time of skippable ads | 30 – 45 seconds |
| Audience retention at 30 seconds | 60% – 70% |
| Engagement Metrics | |
| Click-through rate | 0.5% – 1.5% |
| Earned actions rate | 0.5% – 1.5% |
| Conversion Metrics | |
| Conversion rate from YouTube ads | 1.5% – 3.0% |
| View-through conversion rate | 0.2%- 0.8% |
| Cost Metrics | |
| Cost per acquisition | $20 – $100 |
| Brand Impact Metrics | |
| Brand lift | 5% – 20% |
Make an apples-to-apples comparison when you evaluate performance against these benchmarks.
A skippable in-stream ad should not be judged the same way as a non-skippable ad, and you shouldn’t compare your awareness campaign’s performance against lead generation benchmarks.
A benchmark only helps when you match it to the format, goal, and audience behind the campaign.
Which YouTube ad benchmarks matter most and why?
There’s no single YouTube ad benchmark metric that matters the most for all campaigns and goals. Instead, look at the benchmarks that are relevant to your ad campaign goals and the metrics you’re tracking for those goals.
Some metrics tell you whether people watched your YouTube ad, while other metrics tell you whether they cared enough to act. Then there are metrics that inform you whether the campaign helped your business.
Here are the different ad benchmark categories to track and what they measure:
| Benchmark category | What it helps you measure | Best used for |
| Attention and viewing benchmarks | Whether people watched your ad, stayed with it, and made it far enough into the video to hear your message | Awareness campaigns |
| Click and active engagement benchmarks | Whether viewers showed interest by clicking, engaging, or taking voluntary actions after seeing your ad | Consideration campaigns |
| Conversion and business outcome benchmarks | Whether the campaign contributed to leads, sales, or other actions that matter to your business | Lead generation and sales campaigns |
Attention and view benchmarks
Attention and view benchmarks tell you whether your ad piqued users’ curiosity and held them long enough to land your message. These metrics are important because they indicate whether people actually watched your ad and finished watching it.
They also uncover your ad’s retention, answering questions like “When did viewers lose interest?” That way, you’ll know how to improve your ad to increase average watch time.
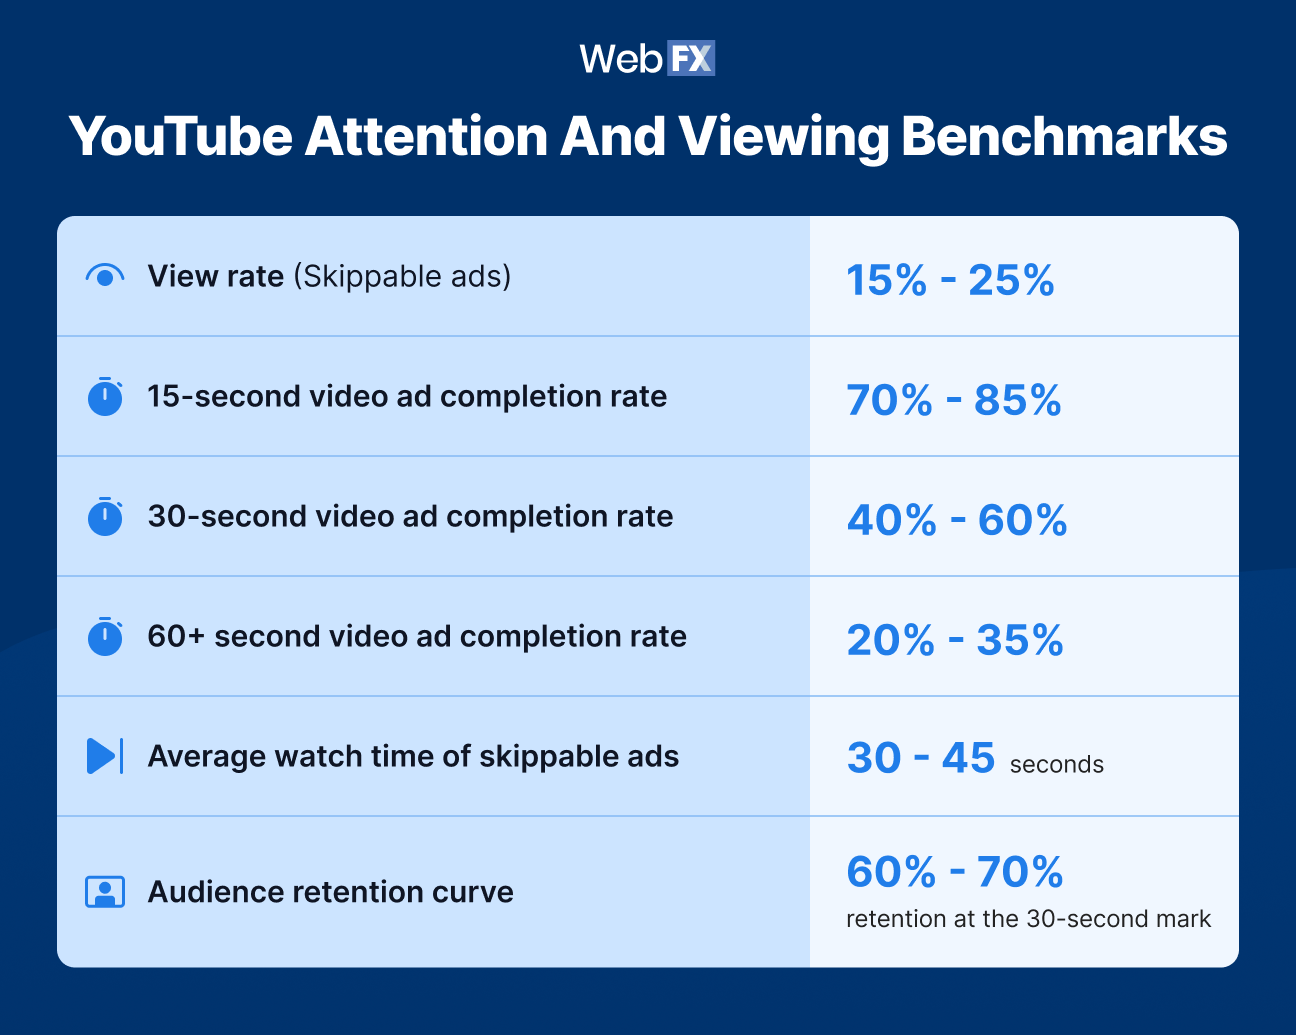
Table View
| YouTube Attention and Viewing Benchmarks | |
| View rate (Skippable ads) |
15% – 25% |
| 15-second video ad completion rate | 70% – 85% |
| 30-second video ad completion rate | 40% – 60% |
| 60+ second video ad completion rate | 20% – 35% |
| Average watch time of skippable ads | 30 – 45 seconds |
| Audience retention curve | 60% – 70% retention at the 30-second mark |
Key insights
View rate: View rate tells you how often viewers choose to watch your ad. For skippable ads, 15% to 25% is a useful baseline, while strong campaigns can reach 30% to 40%. If your view rate is at 10% or lower, your targeting, opening seconds, or message may need work.
Video completion rate: Completion rate shows how far viewers make it through your ad. The expected range changes by length:
- 15-second ads: 70% – 85%
- 30-second ads: 40% – 60%
- 60+ second ads: 20% – 35%
If your completion rate falls below benchmark, test shorter cuts or move your main point earlier.
Average watch time and audience retention curve: These metrics show where viewers stay with you and where they drop off. Think of them like a security camera replay. They show where viewers stayed with you and at which point they headed for the exit.
If your ad didn’t hold their attention until the end of your message, analyze your opening, pacing, or relevance to the audience. The benchmark average watch time for skippable ads at 30 to 45 seconds and retention at 60% to 70% by the 30-second mark.
Pro tip on attention benchmarks: Evaluate your attention and view metrics based on your campaign goal. If your YouTube ad’s goal is to increase awareness, a strong view rate can be a strong indicator in itself. If you’re running lead generation campaigns, compare your attention metrics with click-through and conversion metrics to see whether attention is moving viewers into action.
Click and active engagement benchmarks
Click and active engagement benchmarks tell you whether viewers did more than watch your ad. These benchmarks answer the question, “Did viewers click, engage, or take another action after seeing your ad?”
These benchmarks matter because a video can hold attention without moving people any closer to your next goal. Engagement tells you whether your ad made people interact with your brand or take the next step instead of just sitting through it, or in the case of skippable ads, skipping it.
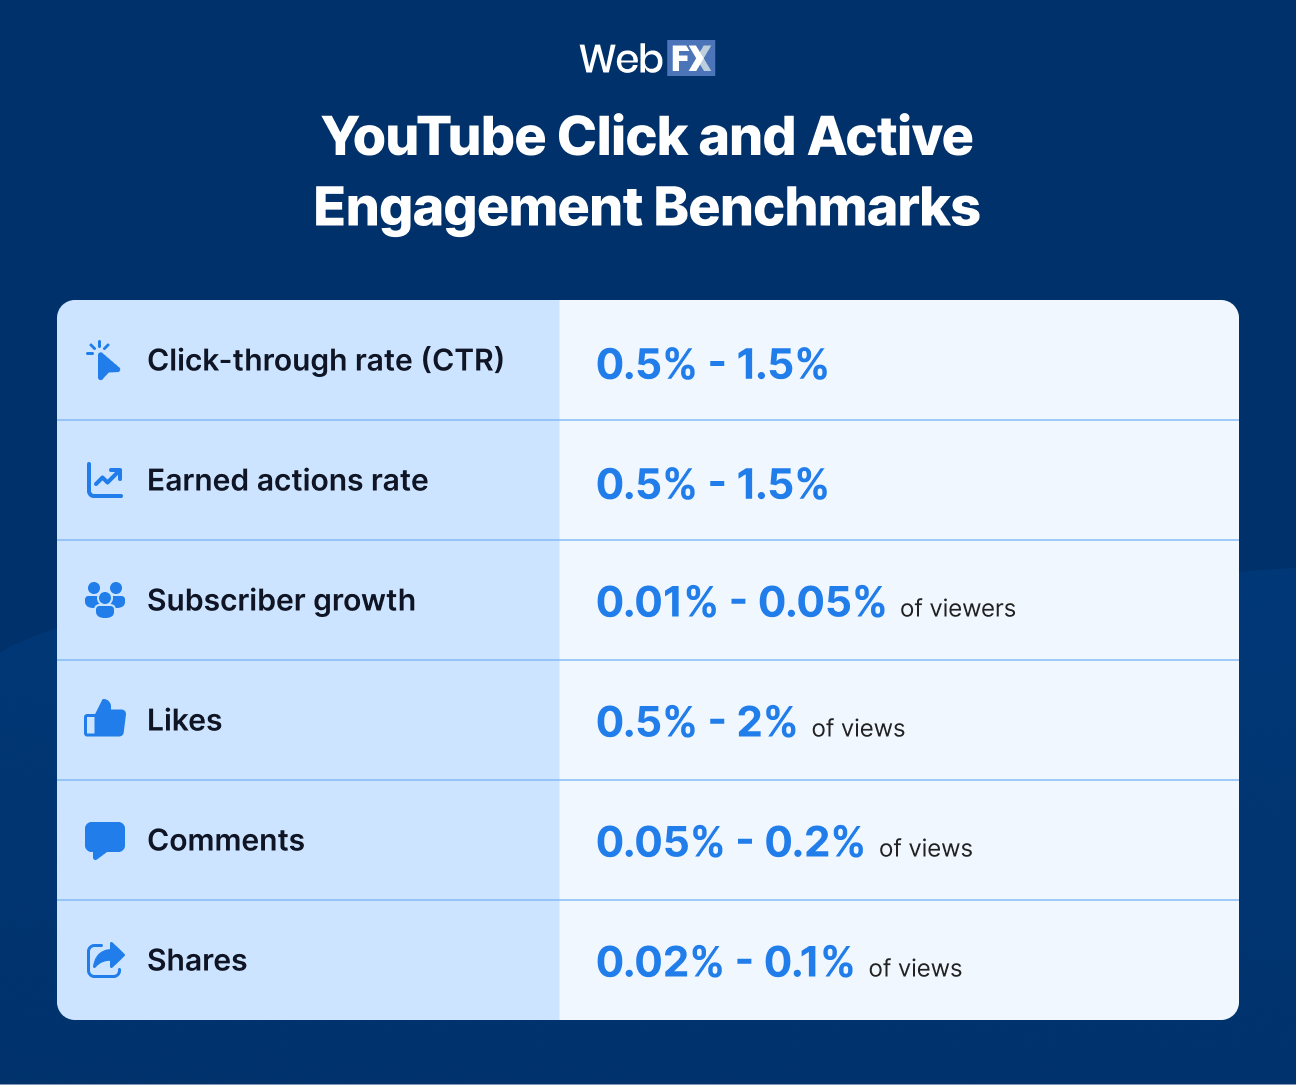
Table View
YouTube Click and Active Engagement Benchmarks
Click-through rate (CTR)
0.5% – 1.5%
Earned actions rate
0.5% – 1.5%
Subscriber growth
0.01% – 0.05% of viewers
Likes
0.5% – 2% of views
Comments
0.05% – 0.2% of views
Shares
0.02% – 0.1% of views
Key insights
Click-through rate (CTR): CTR tells you whether your ad sparked enough interest for someone to take the next step. A typical benchmark range is 0.5% to 1.5%.
TrueView ads average around 0.8%, while YouTube display ads usually come in much lower. If your YouTube ad’s CTR falls below the benchmark, review your:
- Call to action (CTA)
- Offer
- Message-to-landing-page fit
Engagement signals: Likes, comments, and shares do not replace CTR or conversions, but they can show whether the ad made an impression. Here are the benchmarks for engagement signals:
- Likes: 0.5% to 2.0% of views
- Comments: 0.05% to 0.2%
- Shares: 0.02% to 0.1%
If these numbers are weak, your ad may be watchable without being memorable or relevant enough to spark a response. Not all YouTube ad formats support likes, comments, or shares, though, so treat these as supporting metrics rather than core benchmarks for every ad campaign.
Earned actions rate: Earned actions track viewers’ voluntary actions after watching your ad, such as subscribes, likes, shares, or playlist adds. The benchmark range is 0.5% to 1.5%.
This metric helps you see whether the ad created enough interest for viewers to engage beyond the initial impression. To improve your earned actions rate, ensure your ad has a compelling CTA that gives viewers a clear reason to take action.
Subscriber growth: This metric matters more for brands building an ongoing YouTube presence than for every advertiser. The benchmark subscriber growth is at 0.01% to 0.05% of viewers, while strong channel content can reach 0.1% to 0.5%.
If you’re growing your YouTube channel, track this metric alongside earned actions and watch time instead of on its own.
Pro tip on click and engagement benchmarks: Evaluate these metrics based on what you want viewers to do next.
If your campaign goal is consideration, stronger CTR and earned actions can show that your ad is pulling people closer. If your goal is to generate leads, compare these numbers with conversion metrics to see whether interest is turning into results.
Conversion and business outcome benchmarks
Conversion and business outcome benchmarks show whether your YouTube ads contributed to leads, sales, or other actions that matter, such as form submissions or email subscription signups. These are the metrics that move the conversation past views and into results.
They also tend to matter most to leadership. An ad campaign can earn attention and go viral, but if it doesn’t drive sales or inquiries, it’s not effectively doing its job.
These benchmarks help you connect YouTube ad performance to outcomes your team can measure and report on:
| YouTube Conversion and Business Outcome Benchmarks | |
| Conversion rate from YouTube ads | 1.5% – 3.0% |
| View-through conversion rate | 0.2% – 0.8% |
| Cost per acquisition | $20 – $100 |
Key insights
Conversion rate from YouTube ads: Conversion rate shows whether clicks or visits from your ad turned into meaningful actions, such as a form fill, purchase, or signup.
The YouTube ad benchmark for conversion rate is at 1.5% to 3.0%, though some campaigns land closer to 0.5% and others exceed 5%. The variation depends on industry and funnel stage. Other factors, such as offers, landing pages, and audience intent, also influence conversion rates.
If your conversion rate falls below benchmark, review your landing page, offer strength, and how closely your ad matches post-click expectations.
View-through conversion rate: The benchmark for this metric is 0.2% to 0.8%. View-through conversion rate measures conversions from users who saw your ad, didn’t interact with it, but later completed a conversion within a set time.
That makes it especially useful on YouTube, where video often influences later action without earning an immediate click. If your view-through conversion rate is healthy while CTR is modest, your ad may still be helping move viewers toward a later decision.
Cost per acquisition: Cost per acquisition (CPA) ties performance back to cost. The general benchmark range is $20 to $100, although B2B campaigns often run higher and ecommerce campaigns often run lower.
If your CPA climbs beyond what your business can support, do not just look at bids. Review audience quality, the strength of your offer, and whether the landing page is doing its job after the click.
Pro tip on conversion benchmarks: Do not analyze conversion metrics in isolation. A lower conversion rate may point to weak traffic quality, but it can also be a result of a weak offer or landing page. Evaluate the full path from ad to conversion before you decide what to change.
How to use YouTube advertising benchmarks for awareness, consideration, and lead generation
We discussed many benchmarks in the previous section, and prioritizing which metrics to track can leave you confused. Should you focus solely on conversion benchmarks, or consider attention benchmarks as well?
A rule of thumb:
Evaluate your YouTube ad campaign based on the goal you set it out to accomplish.
That means your North Star is your campaign objective, and you should prioritize the benchmarks that align with your goal. Otherwise, you may treat a healthy awareness campaign like an underperforming lead generation campaign, or overlook signs that a sales-focused campaign needs work.
Use the benchmarks in this section to determine whether your campaign is performing well toward its goal or showing signs that it needs work.
Awareness campaigns
Awareness campaigns should lean hardest on these metrics:
- View rate
- Completion rate
- Watch time
- Brand lift
- Earned actions
These metrics tell you whether people saw your message, stayed with it, and showed signs that it made an impression.
This matters because awareness campaigns often work earlier in the buying journey. A low direct conversion rate does not automatically mean the campaign failed.
If your view rate is healthy, your watch time is strong, and your brand lift improves, the campaign may still be doing its job. The brand lift benchmark is at 5% to 20%.
Consideration campaigns
Consideration campaigns sit in the middle. You want people to move from “I saw it” to “I’m interested enough to learn more.”
For these campaigns, the useful benchmarks are:
- CTR
- Watch time
- Audience retention
- View-through conversions
A strong CTR suggests the message and offer are attracting people. Meanwhile, strong retention tells you the video ad stayed relevant long enough to land. View-through conversions can show that your ad influenced action later, even without a click.
If your metrics look healthy, your campaign may be helping viewers move from awareness to active interest. If your metrics are below the benchmark, check whether your message and offer are enticing enough. Review your audience targeting to ensure you’re trying to reach the right people.
Lead generation and sales campaigns
When the goal is to generate leads or sales, the YouTube ad benchmarks that matter the most are:
- Conversion rate
- CPA
- CTR
- View-through conversions
That doesn’t mean that attention metrics don’t count, though. Of course, your campaign must attract your prospect’s attention, so you have to check your attention and viewing metrics, too.
Since you also want to generate leads, you must look beyond views and watch time. You need signs that the campaign drives actions your business cares about.
A higher cost per view (CPV) can still be acceptable if the campaign produces qualified leads at a CPA that your margins can support.
For example, let’s say you’re advertising your professional services on YouTube, and your CPV is higher than the benchmark numbers. You can still pay more per view if your ad viewers turn into inquiries and qualified leads at a cost that your business can handle.
If a new client is worth $5,000 in revenue on average and you can still make a profit when you spend $100 to acquire a client, a higher CPV may make sense if your campaign generates qualified leads below that threshold.
How to interpret YouTube advertising benchmarks without misleading yourself
YouTube advertising benchmarks are useful reference points, but they can lead you in the wrong direction if you’re:
- Looking at a metric in isolation
- Prioritizing the wrong benchmarks
- Focusing on benchmarks that don’t suit your campaign goal, sales cycle, budget, or competitive landscape
Treat benchmark data like a set of signals. You have to read the numbers together.
How? Start by matching the benchmark to your campaign goal, then compare supporting metrics before you decide whether performance is strong or weak.
For example, a high view rate with a low conversion rate can mean your audience watched your ad but didn’t take action. People stayed long enough to consume the message, but not enough of them took the next step.
A CTR lower than the benchmark with decent view-through conversions can still signal that your ad is influencing buyers. On YouTube, not every useful ad earns the click right away. Some viewers watch, leave, and come back later when they are ready to act.
A high cost per view (CPV) is not automatically bad, either. If your downstream CPA stays efficient, the spend may still make sense for your business.
Non-skippable ads are another example of why context matters. A high non-skippable view rate may look impressive at first, but that number means less when viewers did not have the option to skip. In that case, look at view rate alongside brand impact, creative quality, and audience fit.
Before you act on a benchmark, check the context around it:
- Ad format: A skippable ad and a non-skippable ad should not be measured the same way.
- Targeting: Weak audience targeting can drag down performance even when the creative is solid.
- Creative quality: A slow opening or weak message can hurt watch time, retention, and CTR.
- Competition: Heavier competition can push up costs and change what “good” looks like.
- Campaign goal: Awareness, consideration, and lead generation campaigns should not be measured by the same standards.
- Sales cycle and buying journey: A campaign may influence action later, especially when buyers need more time before they convert.
Instead of fixating on a single benchmark across all your campaigns, use benchmark data that matches your campaign goal, spot performance patterns, and identify which metric or campaign element needs a closer look before you make changes.
Skippable vs. non-skippable YouTube ad benchmarks
Evaluate skippable and non-skippable YouTube ads against their relevant metrics. Even when both ads use the same marketing message, the viewer experience differs, so the benchmark numbers must differ, too.
A skippable ad gives viewers a choice, while a non-skippable ad doesn’t. This one difference changes how you should read metrics like view rate, watch time, and engagement.
| Ad format | Key benchmarks |
| Skippable ads | View rate Watch time Audience retention CTR Conversion rate |
| Non-skippable ads | Brand lift View-through conversions Downstream conversions Whether the ad reached the right audience |
Skippable YouTube ad benchmarks measure voluntary attention
If viewers choose to keep watching your ad even though they can skip, your targeting, opening hook, and relevance may be on point.
For skippable ads, these benchmarks are important:
- View rate
- Watch time
- Audience retention
- CTR
- Conversion rate
You can tell your skippable ad works when it performs well across these multiple metrics. When it does, it means your ad earned your audience’s attention, who kept watching, stayed engaged, clicked, and converted.
Non-skippable YouTube ad benchmarks measure message delivery
Viewers have no choice but to sit through a non-skippable YouTube ad. To evaluate your non-skippable ad’s effectiveness, you must look at benchmarks that tell you whether your viewers received and remembered your message, and took an action.
The more useful benchmarks for non-skippable YouTube ads are:
- Brand lift
- View-through conversions
- Downstream conversions
- Whether the ad reached the right audience
A non-skippable ad should help people remember your brand, influence conversions, or reach the right audience with the right message. If it only produces a high view rate, that number alone doesn’t say much.
Frequently Asked Questions
What is a good YouTube ad CTR?
A general YouTube ad CTR benchmark is 0.5% to 1.5%. TrueView ads often average around 0.8%, while YouTube display ads tend to be lower.
Note that a “good” CTR still depends on the ad format, audience, and campaign goal.
What is the average CPV for YouTube ads in 2026?
The CPV benchmark in 2026 is at $0.10 to $0.30. Discovery ads often run lower, around $0.05 to $0.15, while in-stream ads usually cost more.
In highly competitive industries, CPV can reach $0.50 or more.
What is a good view rate for YouTube ads?
For skippable ads, a solid benchmark range is 15% to 25%. Strong campaigns can reach 30% to 40%, while weak targeting can pull view rate down to 10% or lower.
Which YouTube ad benchmarks matter most for lead generation?
For lead generation, focus on conversion rate, CPA, CTR, and view-through conversions first. These metrics tell you whether the campaign is driving action and whether the cost of that action makes business sense.
How often should you track YouTube advertising benchmarks?
For active campaigns, check performance weekly. That gives you enough data to spot patterns without chasing every daily fluctuation.
Use biweekly or monthly reviews to step back and examine broader trends. That is the better window for judging whether creative tests, targeting changes, or budget shifts are working.
You should also review benchmark comparisons after major changes to:
- Creative
- Targeting
- Budget
- Landing pages
- Campaign goals
One more tip: Review performance by campaign goal, not only in a blended account view. Do not mix awareness and lead generation campaigns into one average, as you might overestimate or underestimate your campaigns’ performance.
How do I improve YouTube ad performance if I’m below benchmark?
Start by identifying which metric is underperforming. Then review that benchmark in context.
Is the underperforming metric aligned with your campaign goal? If it is, is it the key metric for your goal or do other supporting metrics contradict what you’re seeing?
For example, if you’re running a lead generation campaign and your conversion rate is below the benchmark, evaluate other metrics like CPA, CTR, and view-through conversions.
You should also consider business context, such as seasonality, sales cycle, budget, offer strength, and competition. These factors can affect whether a benchmark shows you a real problem or just reflects the environment your campaign operates in.
Once you’ve looked at the full picture and concluded that your ad is indeed underperforming against benchmark, evaluate which campaign element needs your attention the most before making any changes:
- Audience targeting
- Ad creative
- Offer
- Landing page
Then review your benchmark comparisons to see if your ad’s performance improved.
What’s the difference between skippable and non-skippable YouTube ad benchmarks?
Skippable YouTube ad benchmarks measure voluntary attention, while non-skippable YouTube ad benchmarks tell you whether your viewers received and remembered your message, and took an action.
How much should a mid-sized business budget for YouTube advertising?
There is no one-size-fits-all budget number in the benchmark note, so the smarter approach is to work backward from your goal.
Estimate what a lead or sale is worth to your business, compare that against expected conversion rates and CPA, and set a budget you can sustain long enough to test creative, targeting, and format.
Start tracking your YouTube ad benchmarks today
Now that you know the different YouTube performance ad metrics you can monitor, it’s time to start tracking. But if you’re too busy running your business to run and track your YouTube ad benchmarks, WebFX is here to help.
We have a team of over 750 experts that can help you create compelling YouTube ads that engage your audience and help you drive results. In the past five years, we’ve driven over $10 billion in sales and over 24 million leads for our clients.
If your campaigns are falling short of these benchmarks, WebFX’s youtube advertising services — alongside our broader video ad offerings across social and streaming platforms — include targeting refinement, creative optimization, and bid management to help you hit and exceed industry standards.
If you’re ready to start driving results with your YouTube ads, contact us online or call us today at 888-601-5359 to speak with a strategist.
Our methodology
This report combines proprietary industry benchmark data and third-party competitive intelligence analysis.
These benchmark ranges are directional guides. Results can vary based on ad format, targeting precision, creative quality, campaign goal, funnel stage, and competition.
-
 Macy Storm is a Content Marketing Consultant at WebFX. She has 5+ years of experience creating content for all digital strategies and across 10+ industries. With a B.A. in Communications, she’s used her writing skills to write over 1,000+ pages for WebFX and SEO.com. Her work has been featured by Search Engine Journal, HubSpot, Entrepreneur, Clutch, and more. When she’s not clacking her keys, she’s playing video games, reading, or counting how many times people say her puppy Daisy is cute (it’s a lot of times). View full profile
 -

WebFX is a full-service digital marketing agency delivering revenue-driving strategies across online advertising, SEO and AI search optimization, and digital marketing. Backed by 1,100+ client reviews, a 4.9-star rating on Clutch, and proprietary revenue-tracking technology, our team helps businesses grow visibility and revenue across platforms, from Google to ChatGPT to LinkedIn. Discover how our expert team and revenue-accelerating tech can drive results for you. Learn more
Try our free Marketing Calculator
Craft a tailored online marketing strategy! Utilize our free Internet marketing calculator for a custom plan based on your location, reach, timeframe, and budget.
Plan Your Marketing Budget
Table of Contents
- At a glance: YouTube advertising benchmarks
- Which YouTube ad benchmarks matter most and why?
- Attention and view benchmarks
- Key insights
- Click and active engagement benchmarks
- Key insights
- Conversion and business outcome benchmarks
- Key insights
- How to use YouTube advertising benchmarks for awareness, consideration, and lead generation
- Awareness campaigns
- Consideration campaigns
- Lead generation and sales campaigns
- How to interpret YouTube advertising benchmarks without misleading yourself
- Skippable vs. non-skippable YouTube ad benchmarks
- Skippable YouTube ad benchmarks measure voluntary attention
- Non-skippable YouTube ad benchmarks measure message delivery
- Frequently asked questions
- Start tracking your YouTube ad benchmarks today
- Our methodology
Share this article

Proven Marketing Strategies
Try our free Marketing Calculator
Craft a tailored online marketing strategy! Utilize our free Internet marketing calculator for a custom plan based on your location, reach, timeframe, and budget.
Plan Your Marketing Budget
What to read next