


Contents
- How to identify underperforming business locations
- 1. Consolidate your marketing data first
- 2. Check your locations’ market opportunity
- 3. Diagnose the marketing layer and lead quality
- 4. Diagnose sales conversion, customer value, and revenue
- 5. Diagnose operational capacity
- 6. Compare locations fairly before you draw conclusions
- 7. Map what you found to a clear next step
- How to identify underperforming locations after an acquisition
- FAQs about identifying underperforming locations
- Need help evaluating your multi-location marketing performance?

TL;DR
- Combine location data: Bring each branch’s marketing and CRM data into one view using consistent metric definitions and location identifiers.
- Identify performance gaps: Evaluate market opportunity, marketing, lead quality, sales conversion, customer value, and operational capacity.
- Compare and act: Compare each branch against its goals, past results, and similar locations, then decide whether to improve marketing, conversion, or operations—or adjust investment. Review quarterly and establish a baseline for newly acquired locations.
Identify underperforming locations by comparing each branch’s marketing and revenue results against its goals and similar locations. Follow the steps below to find performance gaps and choose what to improve.
How to identify underperforming business locations
Underperformance is not based on a single metric, like a location’s number of leads. One branch may have low lead volume, but if it has a strong close rate and high customer value, it’s generating revenue efficiently and far from underperforming.
Hence, identifying an underperforming branch requires a multi-location performance analysis, which involves the steps below.
- Consolidate your marketing data first
- Check your locations’ market opportunity
- Diagnose the marketing layer and lead quality
- Diagnose sales conversion, customer value, and revenue
- Diagnose operational capacity
- Compare locations fairly before you draw conclusions
- Map what you found to a clear next step
1. Consolidate your marketing data first
- Consistent definitions for key marketing and revenue metrics.
- Connected systems that bring each location’s marketing and CRM data into one place.
- Location identifiers.
Once your marketing data is centralized, you can compare locations using comparable performance metrics, while accounting for market size, service offerings, and the branch’s length of operation.
2. Check your locations’ market opportunity
Determine whether a location has enough demand so you don’t underestimate or overestimate its numbers.
Evaluate the following:
- Search demand
- Location population or business density
- Competitive intensity of each location’s market
- Overlap with nearby branches’ service areas
If a location has only a few leads, it doesn’t automatically mean it’s underperforming. It may just have low market demand. Meanwhile, if a location has low lead volume but very high market demand, it indicates a visibility or marketing problem.
3. Diagnose the marketing layer and lead quality
If a market opportunity exists in a location, evaluate whether your branch is capturing enough demand by looking at the following:
- Visibility: Is your website ranking in relevant organic and local searches? What is your search impression share and paid campaigns’ reach?
- Website traffic: Are you getting organic, paid, local, and referral traffic?
- Lead generation efforts: Is your branch getting lead form fills, calls, and conversions from your marketing efforts?
- Lead quality: Are inquiries from customers in your service area who need the services you offer?
- Local ROAS: How much revenue do each location’s paid campaigns generate relative to their ad spend?
4. Diagnose sales conversion, customer value, and revenue
After looking at a location’s market opportunity and marketing layer, analyze the sales and revenue component.
Two locations can acquire the same number of customers, but perform differently. Compare your locations’:
- Customer acquisition cost
- Average sale
- Recurring revenue
- Customer lifetime value
- Service mix
- Cross-sell and upsell potential
In this step, you’re evaluating whether a location is acquiring and retaining customers efficiently.
For example, two of your locations may have the same customer acquisition cost of $500. However, if Location A has a customer lifetime value of $9,000 and Location B’s is $2,000, Location A may be performing better than Location B.
5. Diagnose operational capacity
Look beyond your location’s marketing and sales capacity. A location’s performance may plateau if its operational capacity gets strained.
Thus, look at your locations’:
- Staffing availability and crew or production capacity
- Appointment availability
- Inventory availability and stockouts
- Backlogs
- Service radius
- Route density
- Customer wait times
6. Compare locations fairly before you draw conclusions
Once you have findings from every step above, check them against the right benchmark before you act. A mature flagship location and a branch that opened six months ago start from different places, so directly comparing them can be misleading.
Evaluate each location against its own:
- YoY and quarter-over-quarter trend
- Stated goal
- Market opportunity
- Branches with similar size, service mix, and competition
A common mistake that multi-location companies make is comparing a location’s performance against the company-wide average. Roll performance up for leadership’s view of the full portfolio, but drill down at each location’s numbers when examining whether it’s performing.
7. Map what you found to a clear next step
Once you know which stage is actually holding a location back, whether that’s market opportunity, marketing, lead quality, sales, customer value, or capacity, check that finding against the right benchmark. Then match it to one of seven actions below:
| What you found | Likely action |
| Strong opportunity, marketing, customer value, and open capacity |
Scale and increase investment
|
| Strong opportunity, weak visibility or leads, but strong downstream economics |
Fix the location’s marketing
|
| Strong lead volume, but weak lead quality or close rate |
Fix the location’s conversion, including targeting, lead qualification, lead routing, and follow-up
|
| Strong marketing and sales, but limited capacity |
Fix the location’s operations or resolve the constraints before adding demand
|
| Attractive market, limited data, or new or recently acquired location |
Test further with a controlled investment to establish a benchmark
|
| Stable performance, limited remaining market opportunity |
Maintain to protect existing share and efficiency
|
| Weak opportunity, weak economics, persistent underperformance |
Reduce or reallocate the budget to a stronger opportunity
|
| Strong revenue, but weak contribution margin |
Review pricing, discounting, service mix, and variable costs
|
When multiple locations need attention, prioritize by revenue impact. Weigh the business impact and how fixable the problem is before you decide where to spend your time.
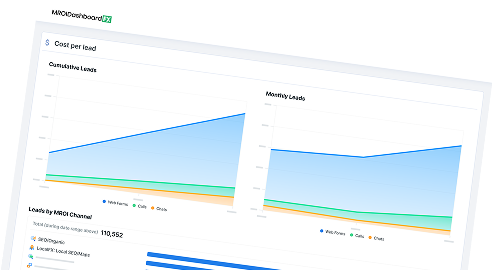
Having a centralized view of your marketing data across locations is an advantage. You can consolidate your marketing and sales data with RevenueCloudFX’s Multi-Location Revenue Intelligence feature.
This feature lets private equity companies and multi-location businesses compare performance across locations and brands. It also lets you analyze revenue by service line and marketing channels by location. With all this data, you get insights on how to optimize your marketing budget across locations.
Meet RevenueCloudFX:
One platform tracking multiple locations and countless metrics, and driving stellar results.
How to identify underperforming locations after an acquisition
Because newly acquired businesses rarely come with clean, standardized data, you must take a few steps before evaluating their performance:
- Establish its own baseline: Look at its marketing spend, number of leads, customers, revenue, CAC, and channel mix before the acquisition.
- Consolidate its data with the rest of your locations: Standardize its metric definitions to match your other locations. For example, define what counts as a lead.
- Evaluate its performance: Look at the location’s market opportunity, marketing, lead quality, sales, revenue, and operational capacity.
FAQs about identifying underperforming locations
How do you compare marketing performance across locations?
Start by consolidating your data by using consistent metric definitions, connecting each location’s marketing and CRM data into one place, and keeping location identifiers intact.
From there, compare locations using normalized outcomes that account for market size, service mix, and how long each branch has been open, and benchmark each location against its own trend and against similar branches rather than the company-wide average.
Should underperforming locations get more marketing budget?
Not automatically. If the diagnosis points to weak visibility or leads in a strong-opportunity market, more marketing investment can help.
If the real constraint is lead quality, close rate, or capacity, it calls for fixing conversion or operations instead.
How often should multi-location companies review branch performance?
Monitor key branch metrics weekly and review overall performance monthly. Compare marketing spend, qualified leads, sales conversion, revenue, and operational capacity to catch gaps early and adjust as needed. Use quarterly reviews for deeper analysis of seasonal trends and longer-term investment decisions.
How do you evaluate a newly acquired location?
Establish its own baseline first — marketing spend, leads, customers, revenue, CAC, and channel mix from before the acquisition.
Then standardize its metric definitions to match your other locations, and evaluate it across the same six dimensions as any other branch: market opportunity, marketing, lead quality, sales, revenue, and operational capacity.
Meet WebFX
Book a discovery call with us today to discuss how our multi-location marketing services can drive growth!

Need help evaluating your multi-location marketing performance?
If you need help identifying underperforming locations and analyzing performance across locations, consider partnering with WebFX. Our multi-location marketing services can help you turn performance data into insights that identify underperforming locations and spot growth opportunities.
You’ll also get access to RevenueCloudFX’s Multi-Location Revenue Intelligence feature, which can consolidate marketing, sales, and revenue data. As a result, you have a single source of truth that makes it easy to evaluate performance by location, offerings, and channels.
Contact us online or call us at 888-601-5359 to book a discovery call!
-
 Maria is a Lead Content Specialist at WebFX. With nearly two decades of experience in B2B and B2C publishing, marketing, and PR, she has authored hundreds of articles on digital marketing, AI, and SEO to help SMB marketers make informed strategic decisions. Maria has a degree in B.S. Development Communication major in Science Communication, and certifications in inbound marketing, content marketing, Google Analytics, and PR. When she’s not writing, you’ll find her playing with her dogs, running, swimming, or trying to love burpee broad jumps. View full profile
 -

WebFX is a full-service digital marketing agency delivering revenue-driving strategies across online advertising, SEO and AI search optimization, and digital marketing. Backed by 1,100+ client reviews, a 4.9-star rating on Clutch, and proprietary revenue-tracking technology, our team helps businesses grow visibility and revenue across platforms, from Google to ChatGPT to LinkedIn. Discover how our expert team and revenue-accelerating tech can drive results for you. Learn more

Try our free Marketing Calculator
Craft a tailored online marketing strategy! Utilize our free Internet marketing calculator for a custom plan based on your location, reach, timeframe, and budget.

Contents
- How to identify underperforming business locations
- 1. Consolidate your marketing data first
- 2. Check your locations’ market opportunity
- 3. Diagnose the marketing layer and lead quality
- 4. Diagnose sales conversion, customer value, and revenue
- 5. Diagnose operational capacity
- 6. Compare locations fairly before you draw conclusions
- 7. Map what you found to a clear next step
- How to identify underperforming locations after an acquisition
- FAQs about identifying underperforming locations
- Need help evaluating your multi-location marketing performance?
Share this article


Proven Marketing Strategies
Try our free Marketing Calculator
Craft a tailored online marketing strategy! Utilize our free Internet marketing calculator for a custom plan based on your location, reach, timeframe, and budget.
What to read next