How do I forecast marketing growth for a newly acquired company?
Forecast marketing growth for a newly acquired company by cleaning its historical data, modeling revenue from its drivers, finding the segments with room to grow, and testing what the next marketing dollar will return.
RevenueCloudFX connects the acquired company’s existing systems, giving you the closed-loop revenue insights and forecasting tools to build that model.
You’ve added another company to your portfolio. Now you need to determine where marketing can create the most value, how much capital to put behind it, and what kind of return that investment can realistically produce.
That answer depends on data someone else collected. Every acquisition brings another CRM, website, advertising account, field service platform, and reporting process, and each one shapes how much of the past you can trust when you project forward.
Below, you will find seven steps for building a post-acquisition growth forecast, followed by how RevenueCloudFX handles the data and analysis work.
Enter your site to connect with our team and see your projected ROI, performance opportunities, and quick wins.
How to forecast marketing growth after an acquisition
Most post-acquisition forecasts break at the inputs long before the math gets involved. The seven steps below test what you inherited, then build the model on top of it, so your marketing growth forecast holds up when your investment team starts asking questions.
1. Grade and clean the data
Sort every inherited data source as reliable, partial, or missing. A source qualifies as reliable when a lead, its origin, and its outcome connect without manual repair. For example, a CRM that logs “direct” or “unknown” for most new customers belongs in the partial bin, no matter how many years of history it holds.
Then strip one-time distortions out of the reliable data. Look for ad spend the previous owner trimmed to polish margins before the sale, one-off promotions, a lost major account, or a supply issue that moved demand.
Build firm assumptions from what remains, treat partial data as a range, and carry missing data as a named risk in the forecast.
2. Protect your tracking through the transition
Closing-day changes can make a healthy business look weak on paper. Domain redirects, new phone numbers, ad account transfers, and CRM migrations each break the chain between source and sale. Record the cutover date for every change and annotate the forecast, so a dip in measured leads after that date does not pass for a drop in demand.
3. Build the forecast from drivers, not totals
A single growth percentage hides the levers you can actually pull. Forecast revenue as the product of four drivers, and run the math separately for every location, brand, or service line.
Revenue = (marketing spend ÷ cost per lead) × lead-to-customer rate × average customer value
Roll the results up only at the end, so a strong market never masks a weak one.
4. Compare segments to find your headroom
Rank every location, brand, service line, and channel by revenue returned per marketing dollar, then set that ranking beside each segment’s share of total spend. Headroom sits where a high return meets a small budget, and the reverse pairing marks spend worth questioning.
Treat the ranking as a shortlist, because average return reflects past spending, not what added budget will buy. Before you move any budget, confirm the segment still has buyers to reach and enough closed deals behind its number.
5. Forecast the next dollar, not the average dollar
Your average cost to acquire a customer describes money already spent, and the next dollar usually buys less because the easiest customers in a channel arrive first.
Check how acquisition cost moved the last time the previous owner raised spend in that channel, and use that movement to set the cost assumption for any added budget. If the history shows no increase to study, assume cost rises and say so in your notes.
6. Account for the lag between spend and revenue
Dollars spent this month do not produce this month’s revenue. Measure the average time from first lead to closed deal for each service line, then shift your revenue forecast by that interval.
A business with a three-month sales cycle will show new spend in the cost column long before it shows in the revenue column, and a forecast that ignores the gap will read as underperformance in the first quarter.
7. Write down your assumptions and set review triggers
Every forecast stands on assumptions, so list yours in one place. Record the source, the owner, and the result that would prove each one wrong. For example, “cost per lead stays inside the historical range for the location” becomes a trigger when actual cost sits outside that range for two consecutive months.
Bottom line, written triggers let your forecast signal a change of course before the quarter ends.
I’m consistently impressed with how well WebFX understands our business. They’re not just a partner in our business, they’re a part of it.
Kampgrounds of America, Inc. (500+ Locations)
How WebFX builds a post-acquisition growth forecast with RevenueCloudFX
Picture the company you just acquired. Years of performance data sit across its CRM, ad accounts, website analytics, call tracking, and sales systems, and stitching it together by hand could take six months while your investment decisions wait.
WebFX skips the manual rebuild. RevenueCloudFX connects the systems already in place, preserves the historical data, and ties marketing activity to closed revenue. Your WebFX strategy team then spots where investment and performance diverge and models the revenue impact.
You can have your strategy live and start getting actionable insights within 90 days.
The roadmap below pairs each of the five steps with the RevenueCloudFX capability behind it, and each step gets a closer look right after.
Use historical performance and predictive analytics to model potential outcomes and set more defensible growth targets.
Establish your performance baseline
Before setting a growth target, understand the revenue engine you just acquired.
With 1,200+ built-in integrations, RevenueCloudFX connects the platforms your business already relies on, from leading CRMs like Salesforce and HubSpot to industry-specific systems like ServiceTitan, AccuLynx, and Housecall Pro.
Instead of replacing systems or changing how your teams work, RevenueCloudFX brings historical marketing, advertising, CRM, sales, and revenue data together in one view. That means you don’t have to wait months to rebuild your tech stack or reporting before you can start learning from the data.
You can establish what the company has historically spent, where leads and customers came from, what they cost to acquire, and how that activity translated into revenue.
Now you have a real baseline for the business rather than starting your forecast with assumptions.
Explore RevenueCloudFX Integrations:
Connect marketing activity to closed revenue
The next step is understanding which parts of that historical performance actually created business value.
Expert insights from
Colton W.WebFX Sr. Strategy Consultant
“Forecasting is much more actionable when it’s connected to the rest of your revenue data. With RevenueCloudFX, we can look beyond a top-line growth projection to understand which locations, channels, and services are driving the forecast, where there’s additional headroom, and where the next marketing dollar could have the greatest impact.”
RevenueCloudFX connects marketing data with downstream CRM, sales, and revenue data, so you can follow performance beyond the lead. Instead of stopping at traffic, conversions, or CPL, you can see which marketing investments ultimately produced customers and revenue.
That can reveal a very different picture of performance. A campaign with an expensive CPL may produce your highest-value customers. A channel generating thousands of leads may contribute relatively little closed revenue.
That closed-revenue view gives you a much stronger foundation for deciding what’s worth scaling.
We finally have one source of truth for all our dealers’ lead performance. This paid for itself in 60 days by reallocating wasted spend and focusing on what actually drives revenue.
CMO, $840M Multi-Location Industrial Equipment Company
Identify your growth headroom
Once the data is connected, RevenueCloudFX gives you different ways to slice the business and look for growth headroom.
Depending on the acquisition, that could mean comparing channels, services, products, markets, business units, brands, or locations to identify where strong economics aren’t being matched by current marketing investment.
We might uncover a high-value service receiving relatively little marketing support, a channel with strong customer acquisition economics that has room to scale, or a segment consuming significant spend without producing enough revenue.
Those gaps give you a much stronger basis for deciding where incremental growth could come from.
Model where to put the next marketing dollar
Then you can turn those opportunities into investment scenarios.
RevenueCloudFX’s Budget Optimizer evaluates marketing return and helps identify where spend could be shifted toward stronger opportunities.
Rather than assuming every channel or part of the business should grow at the same rate, you can model where additional capital has the greatest potential impact.
That might mean reallocating existing spend before increasing the total budget, increasing investment behind a proven growth opportunity, or pulling back from an area where the economics aren’t supporting continued investment.
Companies using connected revenue marketing through RevenueCloudFX achieve 1.8X faster revenue growth than the industry average.
Turn those opportunities into your growth forecast
Now your forecast can be grounded in what the acquired business has actually demonstrated.
Use historical performance, closed-revenue data, and RevenueCloudFX’s modeling capabilities to estimate what different investment decisions could produce and establish targets for the business.
As new performance data comes in, you can compare actual results against those expectations and adjust your investment accordingly.
Your forecast becomes a living model for where growth can come from, what it will take to capture it, and where to put the next marketing dollar.
Taken together, the five stages replace a single growth guess with a forecast built on closed revenue, broken out by location, channel, and service line. Projecting from blended averages hides the weak spots you inherited, and that decides where your next marketing dollar earns the most.
$10B
Revenue Generated for Clients in the Last 5 Years
Turn Your Marketing Into a Revenue Engine
See how WebFX connects every click, lead, and sale into one measurable system built to grow your bottom line.
FAQs: Forecasting marketing growth after an acquisition
Focus on the data that connects marketing investment to business outcomes, including:
Marketing investment by location and channel
Qualified leads and lead sources
Customer acquisition cost (CAC)
Lead-to-customer conversion rates
Average customer or deal value
Marketing-attributed revenue
Revenue and ROI by location, service line, and channel
Sales and operational capacity
For multi-location and multi-brand companies, company-wide averages aren’t enough. Your forecast should preserve the ability to understand where performance and growth potential differ across the organization.
For predictive forecasting, we recommend at least 6–8 months of lead data, with 13 months preferred for optimal accuracy.
For a newly acquired company, the amount of usable marketing data may differ from the amount of business history available. A company could have years of revenue data but limited history connecting marketing sources to leads, customers, and revenue. In that case, start with the best available data and clearly define your assumptions while you build a stronger closed-loop measurement foundation.
Start with the historical marketing, sales, and revenue data you can reliably connect, then use clearly defined assumptions for the gaps.
Avoid treating assumptions as facts. As you connect the acquired company’s systems and collect more closed-loop performance data, compare actual results with your initial projections and replace assumptions with company-specific benchmarks.
RevenueCloudFX helps WebFX clients accelerate that process by connecting data across existing CRM, advertising, call tracking, ERP, field service management, and other systems. That gives your team a more consistent measurement framework as additional data comes in.
Start with a near-term forecast you can validate and adjust as actual performance data comes in. WebFX clients can use RevenueCloudFX Predictive Analytics to forecast traffic, leads, deals, revenue, and paid search performance for the next six months and beyond based on historical RevenueCloudFX data.
For longer-term planning, pair that near-term trajectory with scenario modeling based on planned investments, new locations, market expansion, service-line growth, and other strategic changes.
As a general benchmark, you may consider the following growth ranges based on your site’s average size. These numbers are broad guidelines only, not a business-specific forecast or guarantee.
Size of Site (by Avg. Monthly Sessions)
Conservative Positive Influence Range
Ambitious Positive Influence Range
Small
+10–20%
+25–35%
Medium
+7–12%
+18–25%
Large
+2–5%
+8–15%
These percentages are intended only as a general starting point for planning. Your actual growth potential can vary significantly depending on your business, current performance, market, competition, and other factors.
For a specific growth recommendation and forecast for your business, contact us. We can assess your individual circumstances and provide a more tailored forecast.
A marketing forecast is a projection, not a guarantee. Its accuracy depends on the quality and depth of the historical data, the assumptions built into the model, and how much the business changes after the forecast is created.
RevenueCloudFX predictive forecasts include a 95% prediction interval, providing upper and lower bounds around projected performance to account for uncertainty. Major changes such as acquisitions, new locations, budget increases, pricing changes, or shifts in sales capacity should also be incorporated into your growth scenarios rather than assuming historical trends will continue unchanged.
The strongest approach is to continuously compare forecasted and actual performance, then refine the model as more customer and revenue data becomes available.
You don’t need to spend months manually consolidating data before you can start modeling growth. RevenueCloudFX connects with your existing marketing, CRM, sales, and revenue systems, giving WebFX access to the historical performance needed to establish your baseline, close the loop on revenue, and identify opportunities for additional investment.
From there, we can build projections around your actual business performance and start putting those insights to work. WebFX can get your strategy live and start delivering marketing and revenue insights within 90 days, so you can move from acquisition to action without a lengthy data consolidation or reporting project first.
Forecasting gets harder with every company, location, and system you add. WebFX helps PE-backed and multi-location companies handle that complexity by combining connected revenue data, predictive analytics, and an experienced strategy team.
With RevenueCloudFX, you can connect the systems your businesses already use, understand performance across locations and service lines, forecast leads and revenue, and identify where additional marketing investment has the greatest potential. And you don’t have to wait months just to get the infrastructure in place: WebFX can get your multi-location revenue intelligence platform live in as little as 90 days.
From there, your WebFX strategy team helps turn those insights into decisions about where to invest, where to pull back, and what to prioritize next.
Ready to put your post-acquisition growth plan into motion? Get a custom revenue assessment to identify your biggest performance opportunities, where marketing investment may be under- or overallocated, and what additional growth could look like across your organization.
Try our free Marketing Calculator
Craft a tailored online marketing strategy! Utilize our free Internet marketing calculator for a custom plan based on your location, reach, timeframe, and budget.
Craft a tailored online marketing strategy! Utilize our free Internet marketing calculator for a custom plan based on your location, reach, timeframe, and budget.




 I’m consistently impressed with how well WebFX understands our business. They’re not just a partner in our business, they’re a part of it.











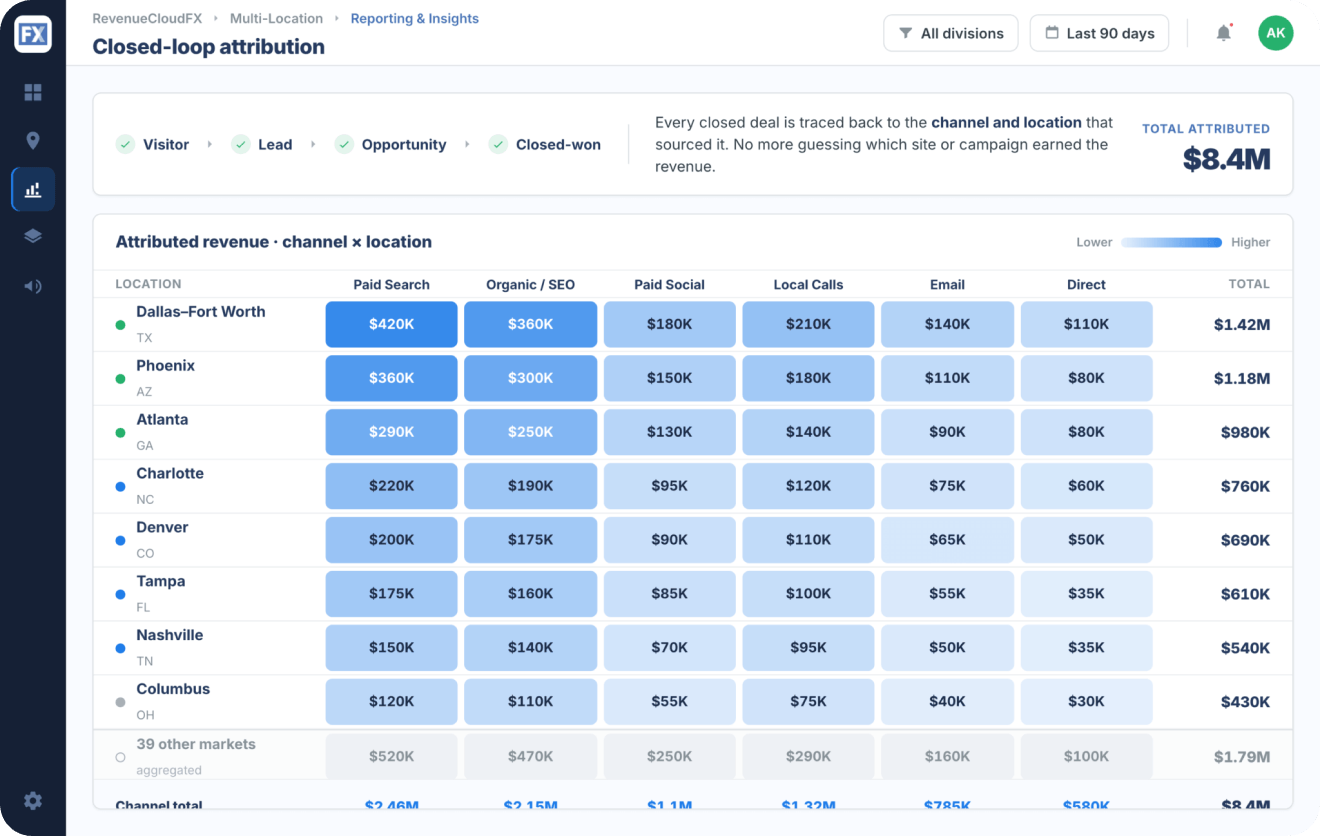
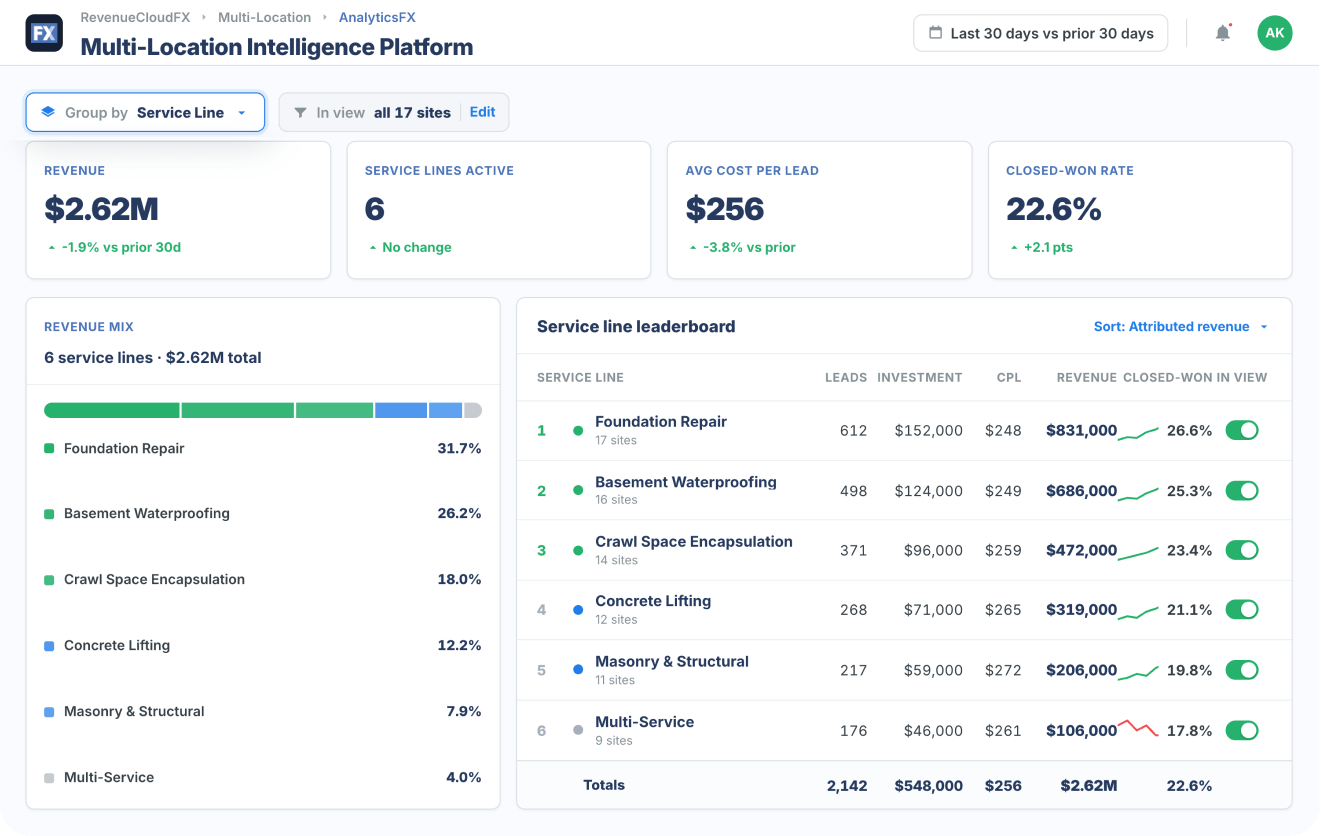 We might uncover a high-value service receiving relatively little marketing support, a channel with strong customer acquisition economics that has room to scale, or a segment consuming significant spend without producing enough revenue.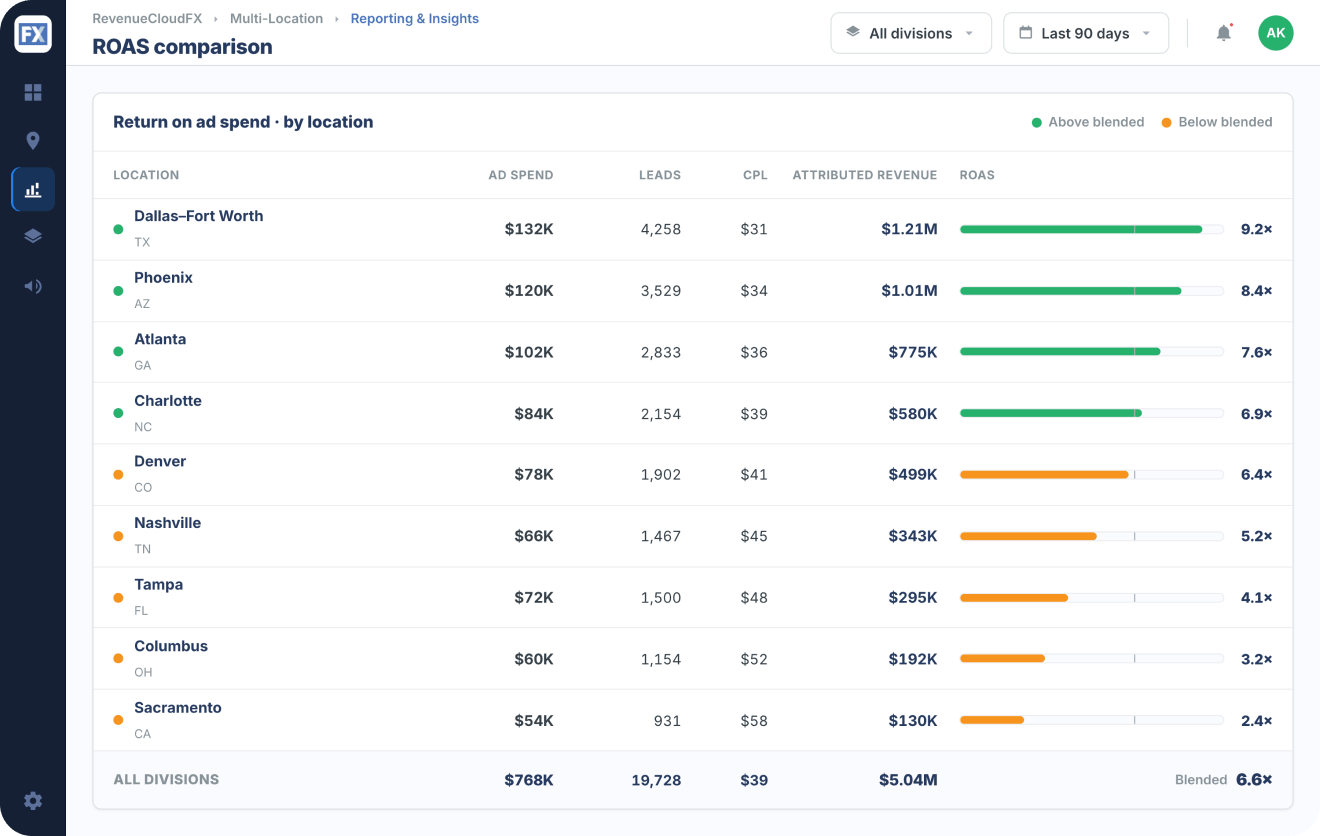


 Morgan Murphy is the Director of Private Equity Partnerships at WebFX, bringing years of experience working alongside private equity firms and their portfolio companies to support growth and value creation. She has a deep understanding of the private equity landscape and the challenges that come with acquisitions, scaling portfolio companies, and managing growth across multiple brands and locations. At WebFX, Morgan helps PE teams find opportunities to strengthen marketing performance and drive greater value across their portfolios. View full profile