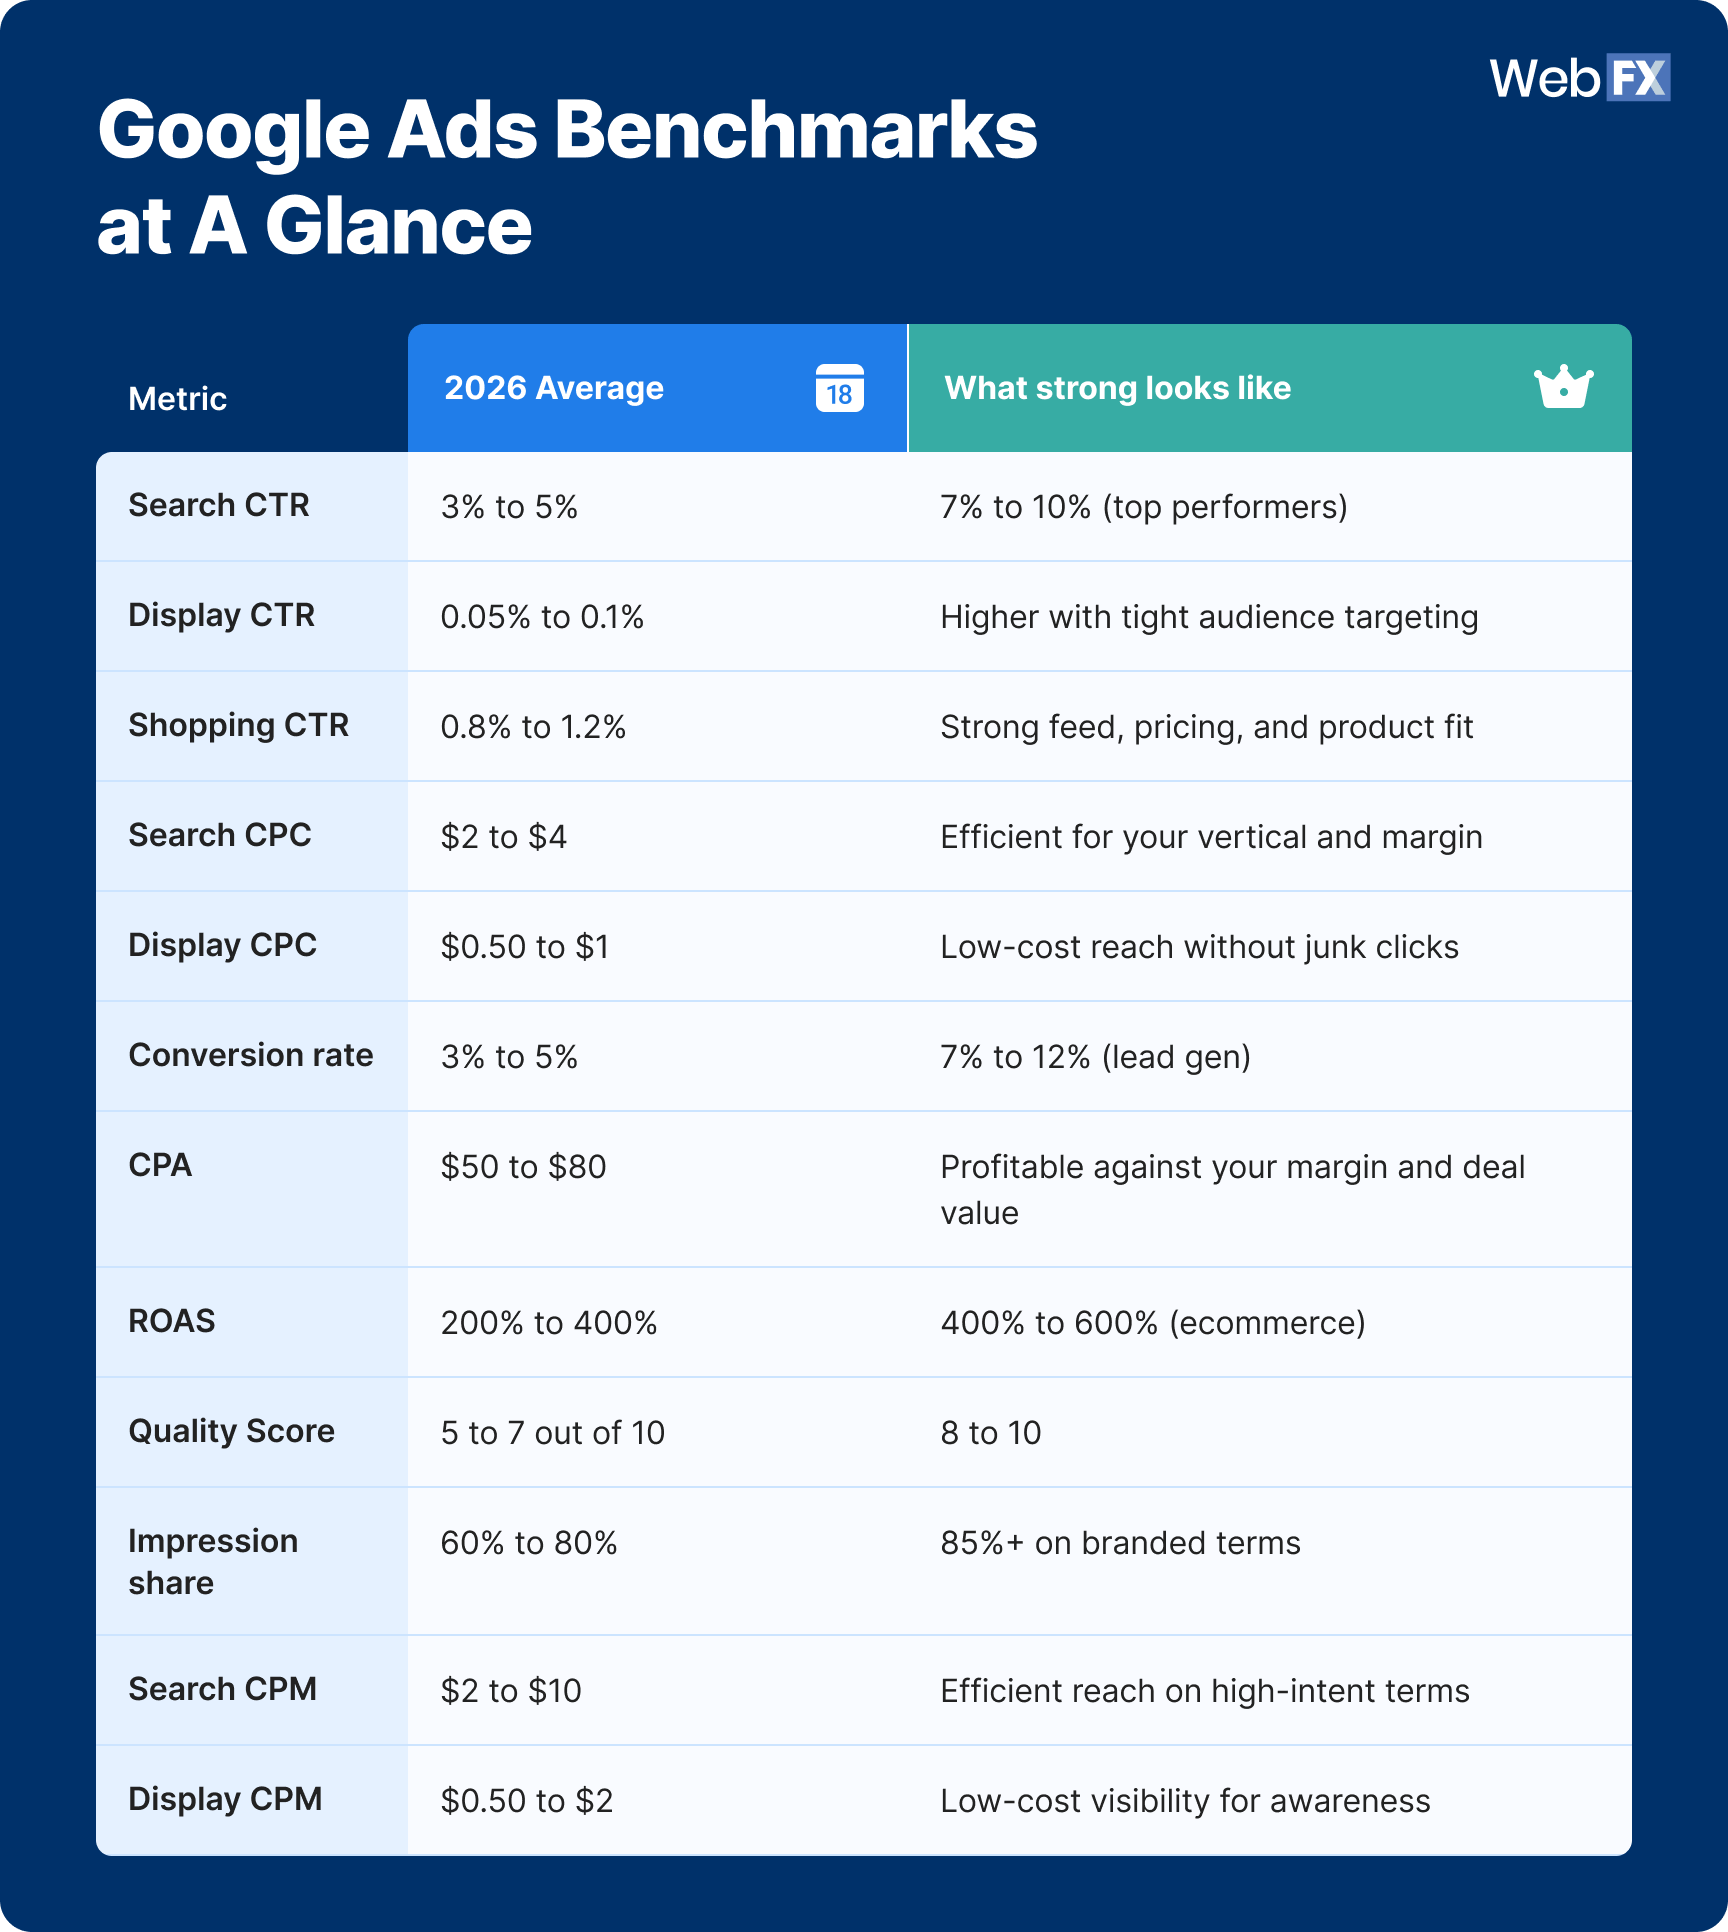
What are the average Google Ads benchmarks in 2026? The average Google Ads benchmarks in 2026 include a 3% to 5% search CTR, a $2 to $4 search CPC, a 3% to 5% conversion rate, and a $50 to $80 CPA, providing a practical starting point for judging whether your account runs ahead, on track, or too expensive for the return.
How do Google Ads cost benchmarks vary by network? Search CPCs run $2 to $4 while display clicks cost $0.50 to $1, CPAs average $50 to $80 across accounts with B2B services higher at $100 to $300 and ecommerce lower at $20 to $50, and search CPM runs $2 to $10 compared to display at $0.50 to $2.
What performance benchmarks should you target for Google Ads? Target a 3% to 5% search CTR with top performers reaching 7% to 10%, a 3% to 5% conversion rate that varies by business model, and a 200% to 400% ROAS with ecommerce accounts often targeting 400% to 600%.
Why are Quality Score and impression share important benchmarks? Quality Score of 5 to 7 is average with 8 to 10 reducing CPC and improving ad position, while impression share of 60% to 80% is typical with top advertisers aiming for 85% or higher on branded terms to prevent competitors from capturing your own audience.
How should you use Google Ads benchmarks to improve ROI? Use benchmarks as a diagnostic by comparing your metrics against 2026 averages, contextualizing by funnel and network, fixing Quality Score to lower CPC, sizing CPA to margin and deal value, tying every click to revenue, and re-checking benchmarks quarterly to catch rising costs.
Fast facts: 2026 Google Ads benchmarks
Cost benchmarks: Search cost per click (CPC) averages $2 to $4 and display runs $0.50 to $1, while competitive verticals like legal and insurance top $50 to $100+. Cost per acquisition (CPA) sits at $50 to $80, climbing to $100 to $300 for B2B and dropping to $20 to $50 for ecommerce.
Performance benchmarks: Search click-through rate (CTR) holds at 3% to 5% (top performers reach 7% to 10%), conversion rate at 3% to 5% (lead gen 7% to 12%), and return on ad spend (ROAS) at 200% to 400% (ecommerce 400% to 600%).
Account health benchmarks: Quality Score averages 5 to 7 out of 10, and impression share runs 60% to 80%. A Quality Score of 8 to 10 lowers your CPC, and 85%+ branded impression share keeps competitors off your own name.
By network: Search beats display by 5x to 10x on CTR and conversions, while display delivers about 70% lower CPC for awareness.
Every Google Ads account looks healthy until you hold it against the benchmark.
Google Ads benchmarks are the average results advertisers earn across Google’s search, display, and shopping campaigns, and they tell you in seconds whether your campaigns lead or lag the field. In 2026, the headline numbers to know are a 3% to 5% search CTR, a $2 to $4 search CPC, and a $50 to $80 CPA. This guide covers those plus every other metric that moves profit: Click-through rate, cost per click, conversion rate, cost per acquisition, return on ad spend, and more.
These benchmarks come from proprietary, aggregated WebFX campaign data across search, display, and shopping campaigns in the U.S. market, so you’re comparing against real account performance.
What are the average Google Ads benchmarks in 2026?
The average Google Ads benchmarks in 2026 are a 3% to 5% search CTR, a $2 to $4 search CPC, a 3% to 5% conversion rate, and a $50 to $80 CPA. These Google Ads metrics benchmarks give you a practical starting point for judging whether your account runs ahead, on track, or too expensive for the return.
Google Ads benchmarks are the average performance ranges for paid search, display, and shopping campaigns, used to measure whether your own results are competitive, ahead, or falling behind.
This snapshot is your master reference for the rest of the page. Each section below breaks these Google Ads metrics benchmarks down by network and business model, then tells you what to do when your figure lands on the wrong side of the average.
Expert insights from
Colton W.Sr. PPC Consultant at WebFX
“CPCs/CPAs are always going to be business-specific. It can be helpful to look at benchmarks to see where you might land within the industry vertical, but these numbers in a vacuum are ultimately not that helpful. What really matters is a business’s ability to track the true profitability of their ad spend.
For example, in a high-ticket B2B space, a $200 or $500 CPA might look expensive in a vacuum, but if that single lead results in a $50,000 deal, it’s actually incredibly efficient and has a fantastic return. Likewise, the CPC could be astronomical, but it could also just be a sign of a high degree of specificity within targeting that’s actually working from a profitability standpoint.
It’s about shifting the focus from ‘cost per click’ to ‘cost per revenue-generating customer’ – the only time a business should raise alarm bells around high CPC and CPA is when it’s also correlating to unprofitable CAC and ROAS.”
New to paid search or want a second set of eyes? See how expert PPC management services turn these benchmarks into booked revenue, what PPC pricing looks like for an account your size, or how a proprietary tech like RevenueCloudFX ties every click back to revenue.
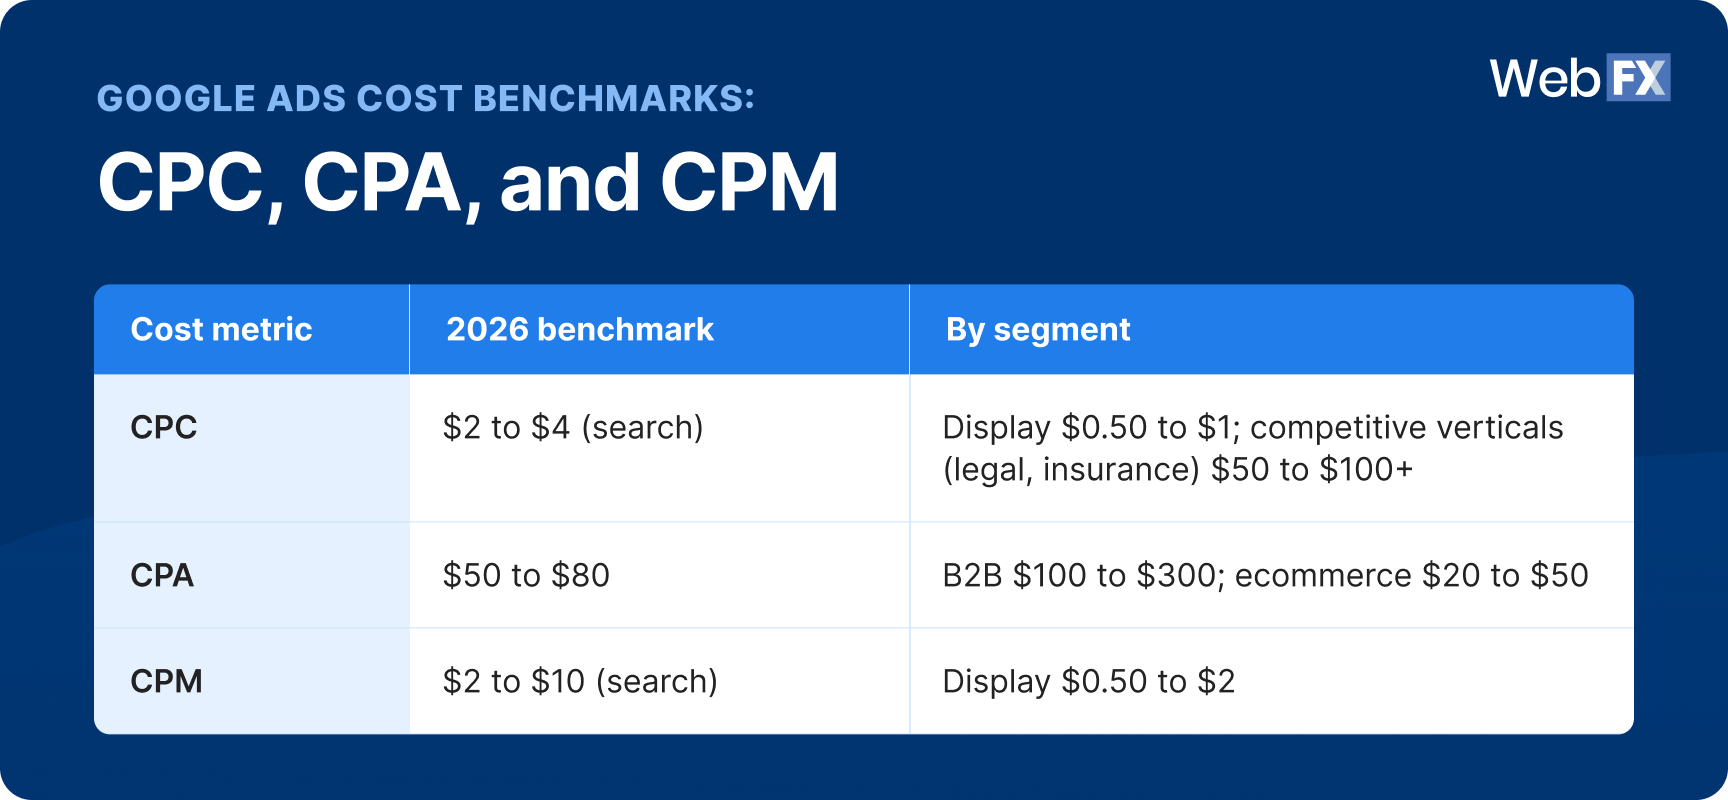
Google Ads cost benchmarks: CPC, CPA, and CPM
Google Ads cost benchmarks in 2026 center on a $2 to $4 search CPC, a $50 to $80 CPA, and a $2 to $10 search CPM. What counts as expensive depends on your industry and deal value, so read each number against your own economics, not the flat average.
Display $0.50 to $1; competitive verticals (legal, insurance) $50 to $100+
CPA
$50 to $80
B2B $100 to $300; ecommerce $20 to $50
CPM
$2 to $10 (search)
Display $0.50 to $2
Cost per click (CPC)is the price you pay each time someone clicks your pay-per-click (PPC) ad. Search clicks run $2 to $4, while display clicks come in far cheaper at $0.50 to $1. Legal and insurance keywords routinely cost $50 to $100 or more per click, because the value of one converted client justifies the bid.
Cost per acquisition (CPA)is what you pay to win one conversion. The cross-account average runs $50 to $80, with B2B services higher at $100 to $300 and ecommerce lower at $20 to $50. A high CPA is not automatically a problem, since a $250 CPA pays for itself when a closed deal is worth $20,000.
Cost per thousand impressions (CPM)is what you pay for 1,000 ad views. Search CPM runs $2 to $10 and display runs $0.50 to $2, and it matters most for awareness campaigns where you buy reach rather than clicks.
The diagnostic read:
Good: Your CPC and CPA fit your margin, lead value, and close rate.
Watch: CPC creeps above your industry norm while Quality Score holds steady, a sign competition is rising.
Fix: CPC climbs while conversions stay flat. That is wasted spend, and it usually traces back to weak targeting or a low Quality Score.
How to act on it:
Judge your CPA against your average deal value and margin, not the cross-industry average.
Audit your keyword match types and Quality Score first when CPC rises faster than the market, since a low score inflates cost regardless of competition.
Shift budget toward the network and keywords that convert, not the ones that only collect clicks.
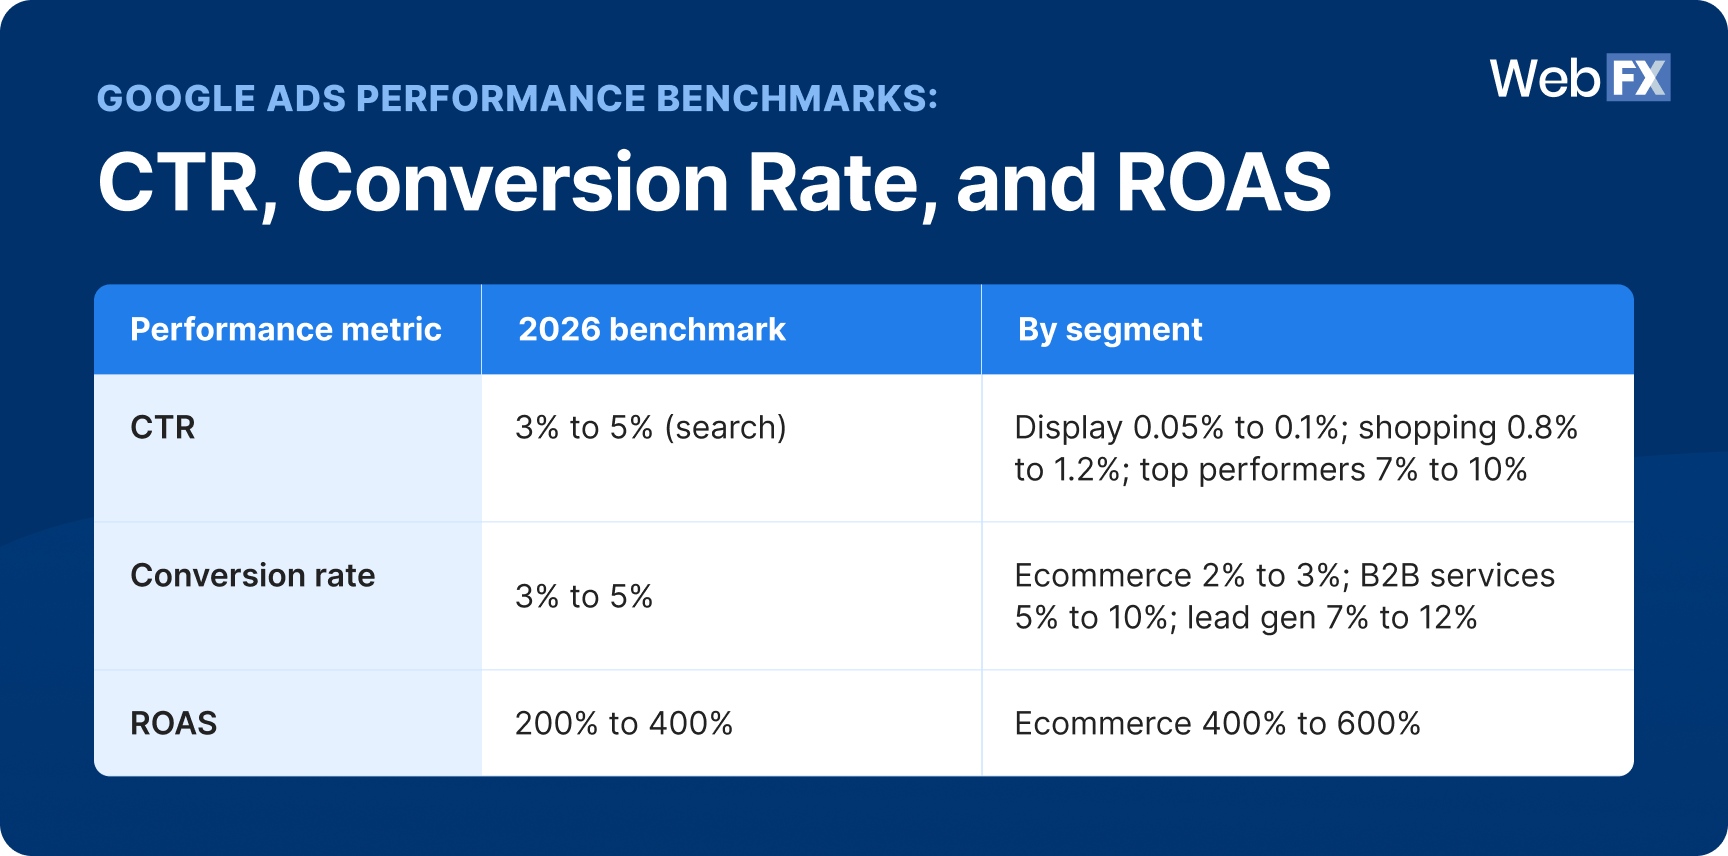
Google Ads performance benchmarks: CTR, conversion rate, and ROAS
Google Ads performance benchmarks in 2026 come down to a 3% to 5% search CTR, a 3% to 5% conversion rate, and a 200% to 400% ROAS. These numbers show whether your ads earn attention, turn clicks into customers, and pay you back.
Google Ads performance benchmarks: CTR, conversion rate, and ROAS
Performance metric
2026 benchmark
By segment
CTR
3% to 5% (search)
Display 0.05% to 0.1%; shopping 0.8% to 1.2%; top performers 7% to 10%
Conversion rate
3% to 5%
Ecommerce 2% to 3%; B2B services 5% to 10%; lead gen 7% to 12%
ROAS
200% to 400%
Ecommerce 400% to 600%
Click-through rate (CTR)measures the share of impressions that become clicks. Search ads average 3% to 5%, with top performers reaching 7% to 10%, because they appear when users actively look for something. Display ads run far lower at 0.05% to 0.1%, and shopping ads land between the two at 0.8% to 1.2%.
Conversion rate (CVR)measures the share of clicks that become your target action. The average sits at 3% to 5%, but it varies sharply by model: Ecommerce converts at 2% to 3%, B2B services at 5% to 10%, and lead generation at 7% to 12%.
Return on ad spend (ROAS)measures revenue earned per dollar spent. The average runs 200% to 400%, meaning $2 to $4 back for every $1 in, while ecommerce accounts often target 400% to 600%.
The diagnostic read:
Good: Search CTR above 5%, conversion rate at the top of your model’s range, ROAS above 400%.
Watch: CTR in the 3% range with a steady conversion rate. Room to optimize, not an emergency.
Fix: Strong CTR but weak conversion rate. People click and then leave, which points at the landing page, not the ad.
How to act on it:
Compare your CTR by network, never against one blended number, since search and display live in different worlds.
Find your segment in the conversion table before judging your rate. A 4% conversion rate is strong for ecommerce and weak for lead generation.
Read your Google Ads performance benchmarks alongside margin and lifetime value before scaling spend, and use ROAS as the fast profit check.
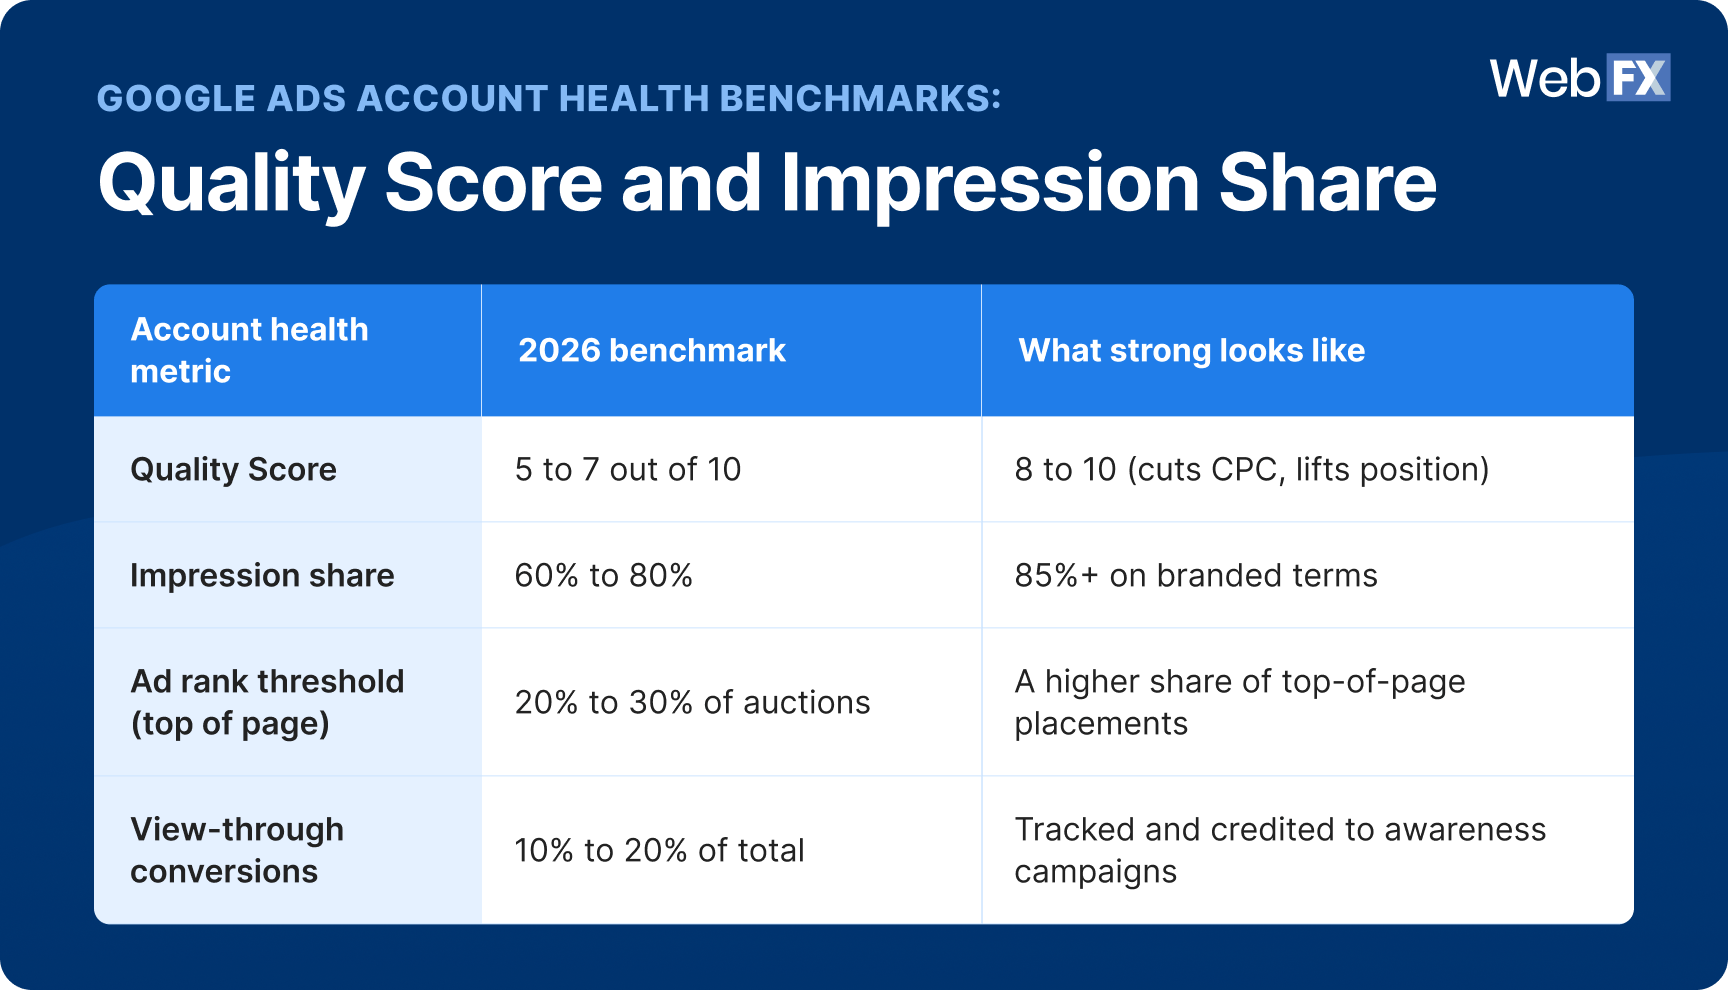
Google Ads account health benchmarks: Quality Score and impression share
Google Ads account health benchmarks in 2026 center on a Quality Score of 5 to 7 and an impression share of 60% to 80%. These metrics shape what you pay and how often you appear, so they quietly drive every cost and performance number above them.
Google Ads account health benchmarks: Quality Score and impression share
Account health metric
2026 benchmark
What strong looks like
Quality Score
5 to 7 out of 10
8 to 10 (cuts CPC, lifts position)
Impression share
60% to 80%
85%+ on branded terms
Ad rank threshold (top of page)
20% to 30% of auctions
A higher share of top-of-page placements
View-through conversions
10% to 20% of total
Tracked and credited to awareness campaigns
Quality Score is Google’s 1-to-10 rating of how relevant your keyword, ad, and landing page are to the search. The average account runs 5 to 7, and pushing into the 8 to 10 range reduces your CPC and improves your ad position.
Impression share is the percentage of eligible auctions your ads actually enter. Most accounts capture 60% to 80%, and top advertisers aim for 85% or higher on branded terms, where conceding visibility hands competitors a shot at your own audience.
Ad rank threshold decides top-of-page placement, which the average account reaches in 20% to 30% of auctions. View-through conversions account for 10% to 20% of total conversions, which matters when you judge display and video campaigns that influence buyers without an immediate click.
The diagnostic read:
Good: Quality Score of 8 or higher, impression share above 80%, branded impression share at 85%+.
Watch: Quality Score in the 5 to 7 band. Workable, but you leave CPC savings on the table.
Fix: Impression share dropping on branded terms. A competitor is bidding on your name and winning visibility you should own.
How to act on it:
Raise Quality Score by tightening ad relevance and improving landing page experience before you raise bids.
Protect your branded impression share first, since it is your cheapest, highest-intent traffic.
Credit view-through conversions when you evaluate awareness and remarketing campaigns.
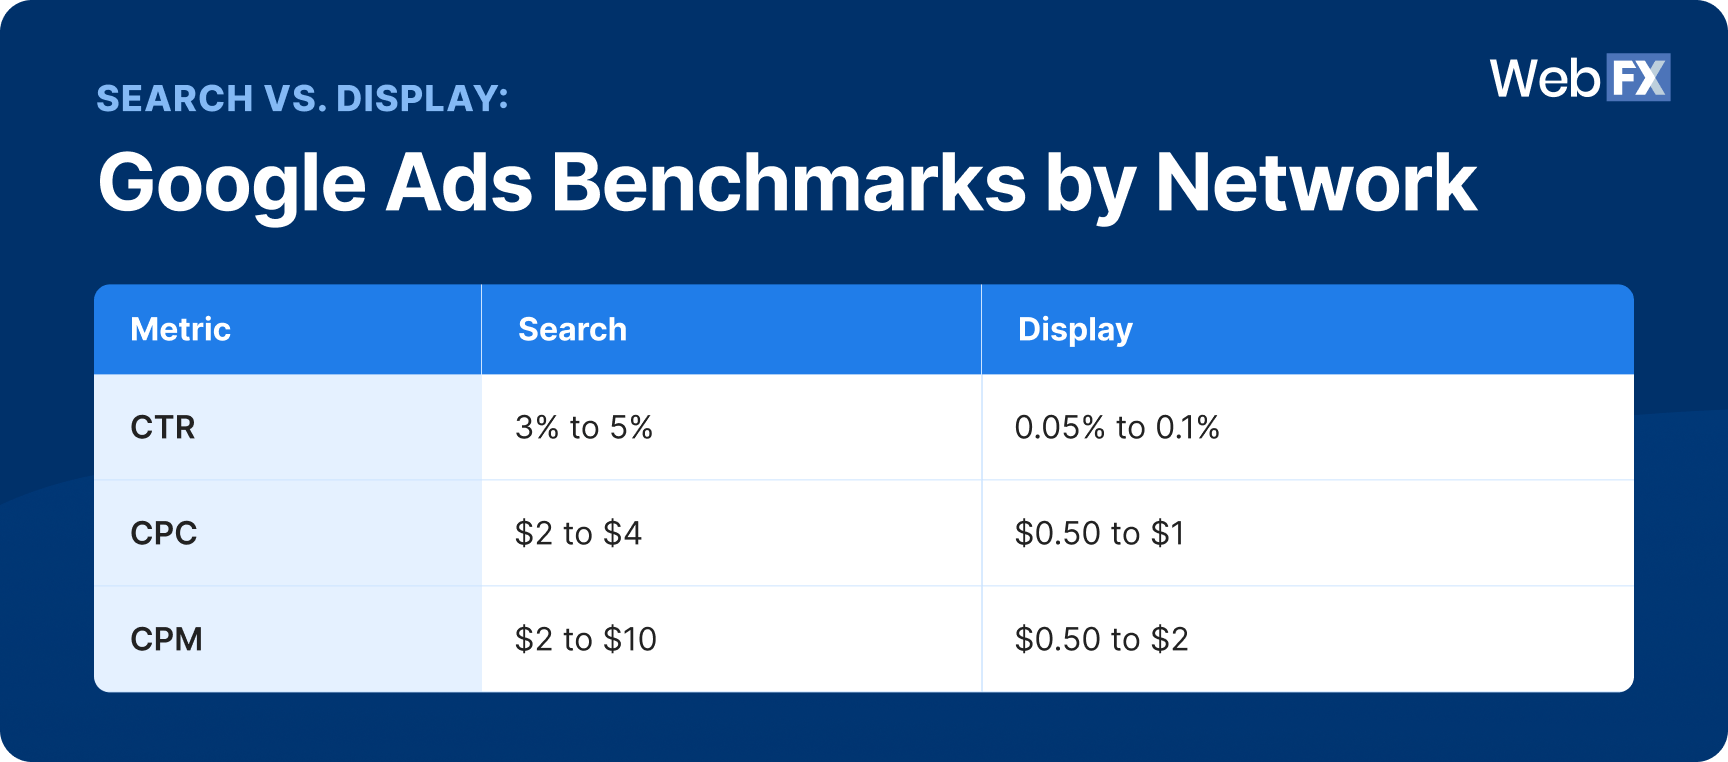
Search vs. display: Google Ads benchmarks by network
Google Ads benchmarks split sharply by network: Search wins on intent, while display wins on low-cost reach. Grading both with one scorecard is the fastest way to misread your account.
Search vs. display: Google Ads benchmarks by network
Metric
Search
Display
CTR
3% to 5%
0.05% to 0.1%
CPC
$2 to $4
$0.50 to $1
CPM
$2 to $10
$0.50 to $2
Search wins on intent. People who search are actively looking to buy, which is why search delivers 5x to 10x better CTR and conversion rates than display. You pay more per click, but the clicks are worth more.
Display wins on awareness. Display CPCs run about 70% lower than search, which makes the network efficient for building reach and feeding retargeting. The tradeoff is a 0.5% to 1% conversion rate, since most viewers are browsing, not buying.
How to act on it:
Judge each network against its own benchmark, never against a blended account average.
Lean on search for bottom-funnel, high-intent conversions.
Use display to build awareness and feed retargeting.
How to use Google Ads benchmarks to improve your ROI
Expert insights from
Kayla J.PPC Specialist at WebFX
“When an account underperforms against benchmarks, the first lever I would check is your conversion tracking setup/bid strategy, which often has the single largest impact on results. When we transitioned an account I work with to value-based bidding (setting dynamic conversion values based on lead quality and telling Google Ads to bid toward the highest-value leads), we saw a nearly 20% lift in qualified leads, coupled with a 25% drop in cost per qualified lead MoM.”
Use Google Ads benchmarks as a diagnostic instead of a target. Find the benchmark gap that affects revenue, then fix the campaign element most likely to move that number.
Benchmark before you optimize. Pull your CTR, CPC, conversion rate, CPA, and ROAS, then compare each against the 2026 averages above. You cannot measure improvement without a starting point.
Contextualize by funnel, network, and vertical. A $250 CPA looks brutal until the average B2B deal runs $20,000, and a 0.1% display CTR sits within range for awareness. Read every number against your own economics.
Fix Quality Score to lower CPC. Moving from a 5 to 7 Quality Score into the 8 to 10 range cuts your cost per click without touching your budget. Start with the high-spend keywords sitting below 7.
Size CPA to margin and deal value. Calculate the most you can profitably pay per acquisition based on gross margin and average order value, then judge your $50 to $80 benchmark against that ceiling.
Tie every click to revenue. These Google Ads metrics benchmarks only help once you can measure your own numbers against them. RevenueCloudFX gives you a single source of truth that connects ad spend to booked revenue, so you know which campaigns drive your bottom line and which only look busy.
Re-check your Google Ads benchmarks numbers each quarter. Costs climb as competition, seasonality, and auction pressure shift, so a quarterly review catches rising CPCs before they harden into your new normal.
Measuring the metrics that affect your bottom line.
Are you interested in custom reporting that is specific to your unique business needs? Powered by RevenueCloudFX, WebFX creates custom reports based on the metrics that matter most to your company.
Good 2026 Google Ads benchmarks are a 3% to 5% search CTR, a $2 to $4 search CPC, a 3% to 5% conversion rate, a $50 to $80 CPA, and a 200% to 400% ROAS. Strong search campaigns can push CTR toward 7% to 10%, while ecommerce campaigns often target ROAS around 400% or higher, though your real target depends on your network, vertical, margin, and deal value.
A good CTR for Google Ads search campaigns is 3% to 5%, and top performers reach 7% to 10%. Display CTR runs much lower at 0.05% to 0.1%, while shopping ads average 0.8% to 1.2%.
The average CPC for Google Ads is $2 to $4 on search and $0.50 to $1 on display. Competitive verticals like legal and insurance run much higher, from $50 to $100+ per click.
A good conversion rate for Google Ads is 3% to 5% on average, but it varies by business model. Ecommerce converts at 2% to 3%, B2B services at 5% to 10%, and lead generation at 7% to 12%.
Check your Google Ads benchmarks at least quarterly, since CPCs and competition climb over time. High-spend or seasonal accounts benefit from monthly reviews to catch cost spikes before they hurt ROI.
WebFX is a Partner in Driving Results
Hear from HydroWorx, who saw a 131% increase in organic forms by partnering with WebFX
Every overpriced click, weak landing page, and untracked conversion is revenue walking out the door. Knowing the 2026 Google Ads benchmarks tells you where you stand, and acting on them is what turns that knowledge into ROI.
With 30+ years of experience and a team of 150+ Google Ads certified experts, WebFX has driven more than $10 billion in revenue and 24 million qualified leads for clients, with a 93% satisfaction rate, by building proven PPC campaigns that beat relevant benchmarks instead of merely meeting them.
Let us help you land on the right side of every benchmark. Explore our Google Ads management services, or call 888-601-5359 to talk strategy with one of our PPC specialists today.
The benchmarks in this guide come from proprietary, aggregated, and anonymized WebFX Google Ads campaign data across search, display, and shopping campaigns in the U.S. market. Metrics include click-through rate, cost per click, conversion rate, cost per acquisition, return on ad spend, Quality Score, impression share, and cost per thousand impressions. Data was last updated in June 2026.
These benchmarks serve as directional planning ranges. Individual results vary by industry, competition, budget, bidding strategy, and account maturity.
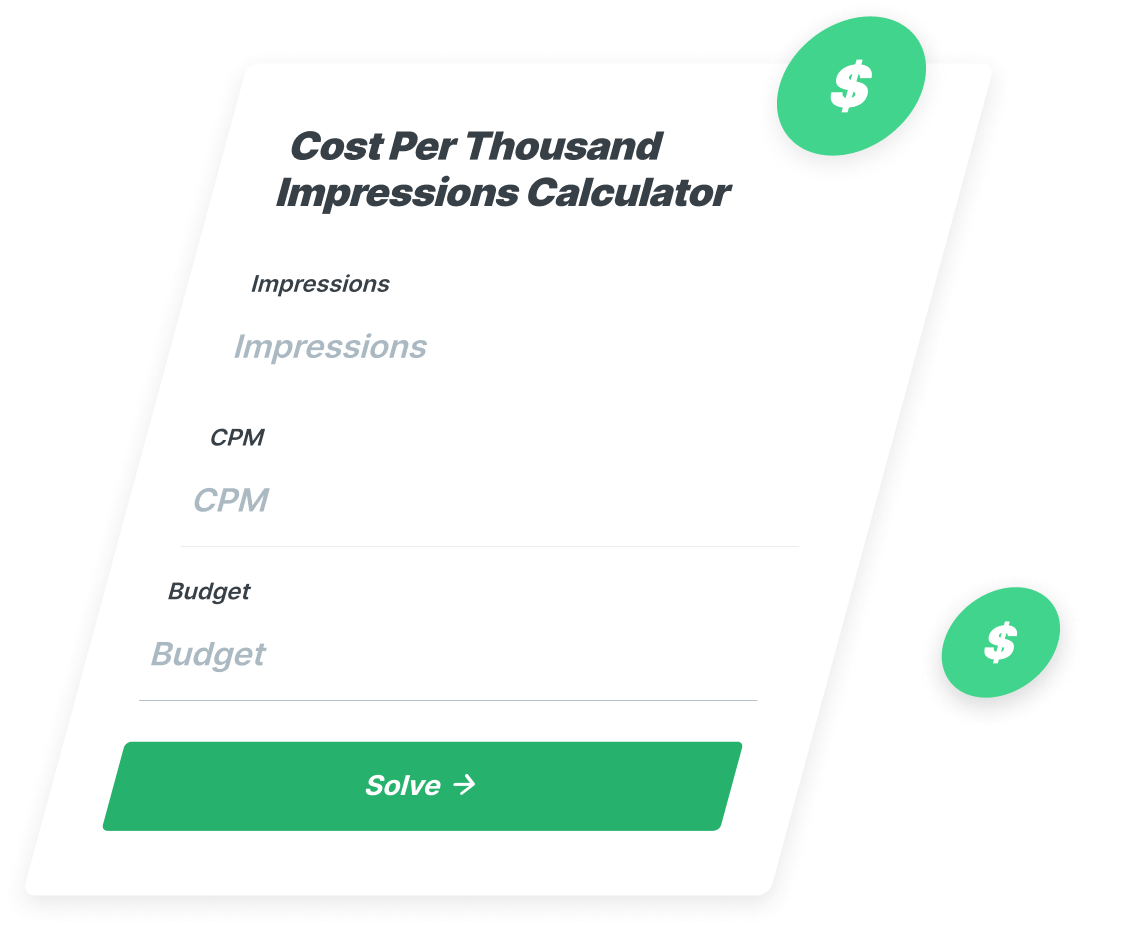
Cost Per Click (CPC) Calculator
Do you advertise on platforms that charge per click? Use our calculator and figure out exactly how many clicks will fit within your budget.


 Watch the Video Testimonial
 Albert Dandy Velasquez blends SEO strategy with compelling storytelling to help businesses boost their visibility and revenue online. With a B.A. in English and certifications from HubSpot, Semrush, and Google Analytics, he has written and optimized hundreds of articles on organic SEO, content strategy, and user experience. He regularly contributes to the WebFX blog and SEO.com, creating content that helps readers turn marketing goals into measurable results. When he’s off the clock, he’s usually exploring new neighborhoods on two wheels, filming travel content, or chasing golden hour with a coffee in hand. View full profile