Effective data visualization allows users to easily understand and consume otherwise complex, boring information. Plotting your data can serve as a replacement to tabular data, and is also a great way to add practical graphics to your web page or application. There are a variety of ways you can plot data on-the-fly – but in this article we’ll focus on 10 excellent JavaScript solutions to graphing/charting data that allow you to process data client-side.
You’ll also find a link to one of the demonstration pages of the script so that you can see it in action.
Flot
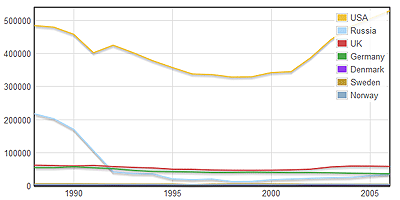 Flot is a data-plotting library developed by IOLA built on top of jQuery. It’s easy to use, yet feature-packed and elegant. It has a mouse-controlled zooming feature (click and drag over the target area) and some simple user interactivity features such the ability to determine the x and y coordinates of mouse clicks. Demonstration: Different graph types
Flotr Javascript Plotting Library
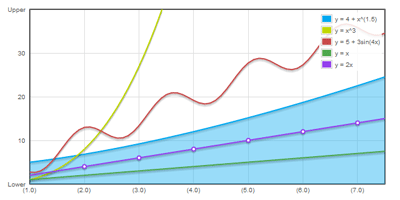 Flotr, written by Bas Wenneker of Solutoire.com, is a plotting solution inspired by Flot that uses the Prototype JS library and excanvas.js.
It supports most modern browsers including Internet Explorer 6, and has many features of Flot including mouse tracking, selection, mouse-tracking features. Demonstration: Basic Legend Example
fgCharting Plugin for jQuery
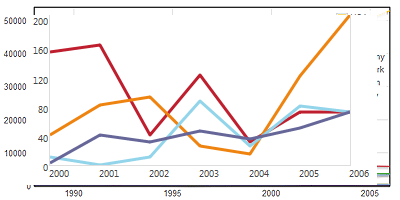 fgCharting jQuery plugin is an accessible solution for charting data. It takes data in an HTML table and dynamically transforms the table into charts, allowing non-traditional browsers (i.e.
– screen readers) access to the HTML table. Basic usage involves one line of code to initialize the plugin. Demonstration: Chart types page
PlotKit
PlotKit is a charts and graphs plotting solution written on top of Mochikit.
PlotKit a complete rewrite of a project called CanvasGraph.js, improving on code structure and adding support for SVG format. Demonstration: SVG Renderer Tests
JavaScript Diagram Builder
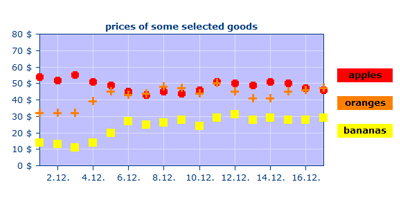 The JavaScript Diagram Builder supports several types of chart and graph types including bars, dots, lines, and pie charts. The developer has provided a Browser Support tool to help you check if particular objects/methods of the library are supported by your current browser.
Demonstration: The Bar object
Emprise JavaScript Charts
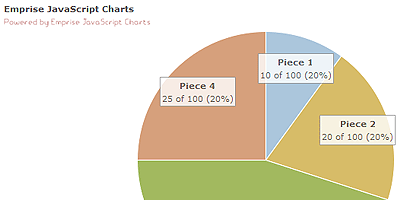
Emprise JavaScript Charts offers a free Personal License for their feature-packed charting/graphing script. Check out their feature comparison table of the different types of licenses to see which license is right for you. Demonstration: Area Chart Example
Dynamic Drive Pie Graph script
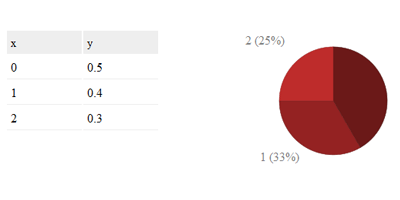
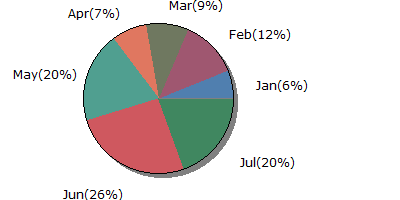 DynamicDrive offers a DHTML/CSS based solution for graphing pie charts.
The implementation is straightforward, just include two scripts provided (wz_jsgraphics.js and pie.js), define the values of each segment of your pie chart either inline or in an external JS file, and you’re set!
Dynamic Drive Line Graph script
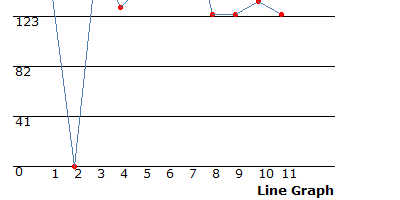 The Line Graph script is another DHTML solution from DynamicDrive that allows you display line graph data. The procedure for implementation is similar to the Pie Graph script.
Canvas 3D Graph
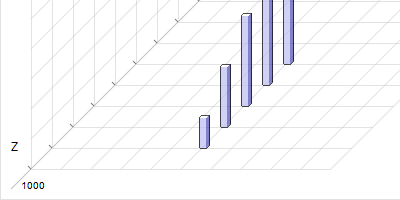 If you need to graph 3-dimensional data, Canvas 3D Graph is worth checking out. Canvas 3D Graph is written with excanvas.js to support Internet Explorer.
The Dojo Charting Engine
 The Dojo Charting Engine is a solution written on top of the Dojo Toolkit JavaScript library.
It is a feature-rich solution that includes trend methods for analyzing data on-the-fly, 3D visual bars, and animated hover-over effects. Note that the example test page linked on the project page doesn’t work, here’s the working example page link. Demonstration: Cylinder chart Your favorite charting solution not included in the list?
Have a web page that uses any of the solutions above? Share it with all of us in the comments.
-
 President of WebFX. Bill has over 25 years of experience in the Internet marketing industry specializing in SEO, UX, information architecture, marketing automation and more. William’s background in scientific computing and education from Shippensburg and MIT provided the foundation for RevenueCloudFX and other key research and development projects at WebFX.
 -

WebFX is a full-service marketing agency with 1,100+ client reviews and a 4.9-star rating on Clutch! Find out how our expert team and revenue-accelerating tech can drive results for you! Learn more
Make estimating web design costs easy
Website design costs can be tricky to nail down. Get an instant estimate for a custom web design with our free website design cost calculator!
Try Our Free Web Design Cost Calculator
Share this article


Web Design Calculator
Use our free tool to get a free, instant quote in under 60 seconds.
View Web Design Calculator
Make estimating web design costs easy
Website design costs can be tricky to nail down. Get an instant estimate for a custom web design with our free website design cost calculator!
Try Our Free Web Design Cost Calculator