16 Digital Marketing Metrics to Measure


There are dozens of digital marketing metrics to choose from, but which ones offer you the most value? We boil them down to the top 16 that give you the most value and insight into your performance marketing strategy.
Plus, learn how to measure any digital media metric in three simple steps. If you need professional help measuring (and improving) your Internet marketing, contact us online or call us at 888-601-5359 to see how we can help!
What type of metric are you looking for?
- Digital marketing metrics to boost your traffic
- Digital marketing metrics that focus on revenue
- How to measure your online metrics successfully
Want to know how to improve these metrics? We’ve included tips to improve your digital metrics at the end of each one!
Why should you measure metrics
Metrics help you to evaluate whether your marketing srrategies are working and if they are achieving their goals. Instead of guessing, you can analyze the performance of different campaigns, channels or strategies to focus your resources where they are most effective.
What are digital marketing metrics and KPIs?
Quick glance
Metrics are general measurements of performance.
KPIs are focused measurements tied to achieving specific goals.
Metrics refer to quantifiable measurements that show the specific outcomes or actions that are taken by users. Key Performance Indicators (KPIs) are also measurable values that are used to evaluate the effectiveness of a digital marketing strategy, but with a slightly different purpose. For definitions of these and other common terms, visit our digital analytics glossary.
| Aspect | Marketing Metrics | KPIs |
|
Purpose |
Provides insights into overall activities. | Measures progress toward key objectives |
|
Focus |
Tracks “what’s happening” | Tracks “what matters most” |
|
Use case |
Analysis and monitoring. | Decision-making and strategy evaluation |
|
Actionability |
It may not directly impact business goals. | Directly tied to achieving measurable results. |
Digital marketing metrics to boost traffic
When measuring digital marketing, a lot of companies look at traffic.
While traffic can sometimes serve as a vanity metric, there are a few digital marketing metrics that you want to measure. These metrics can help your team spot website issues, as well as get insight into your site visitors.
Quicklink to your metric of interest:
- Website traffic
- Traffic source
- New vs. returning visitors
- New sessions
- Time on page
- Bounce rate
- Device
- Exit rate
- Customer retention rate
1. Website traffic metric
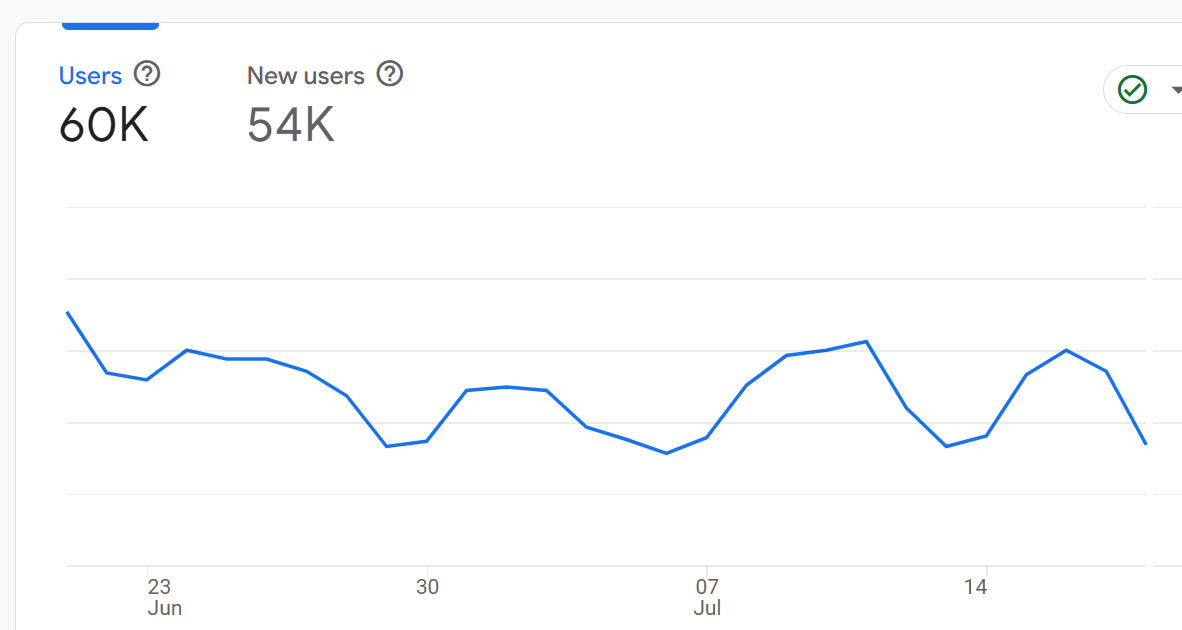
In almost all cases, your digital marketing strategy will focus on driving traffic to your website.
That’s why website traffic is a core online marketing metric. Website traffic describes the number of users visiting your site, whether they’re new or returning. It encompasses all your pages and can provide an overall assessment of your site — and marketing — performance.
When measuring this digital marketing metric, you want to watch for sudden drops or increases.
Usually, you should see repeat valleys in your website traffic. If you operate in the business-to-business (B2B) industry, for example, your site traffic may drop over the weekend and then return to normal levels during the workweek.
Website traffic can also help your team show the long-term impact of your online marketing.
If you invest in search engine optimization (SEO), for example, you may look at your website traffic at 12 months. Generally, SEO should start to deliver results after three to six months, which means your site traffic should show an increase.

Quick wins to improve website traffic metric
- Optimize SEO for relevant keywords
- Use targeted advertising with your paid ads
- Leverage email marketing
- Share engaging content on social media
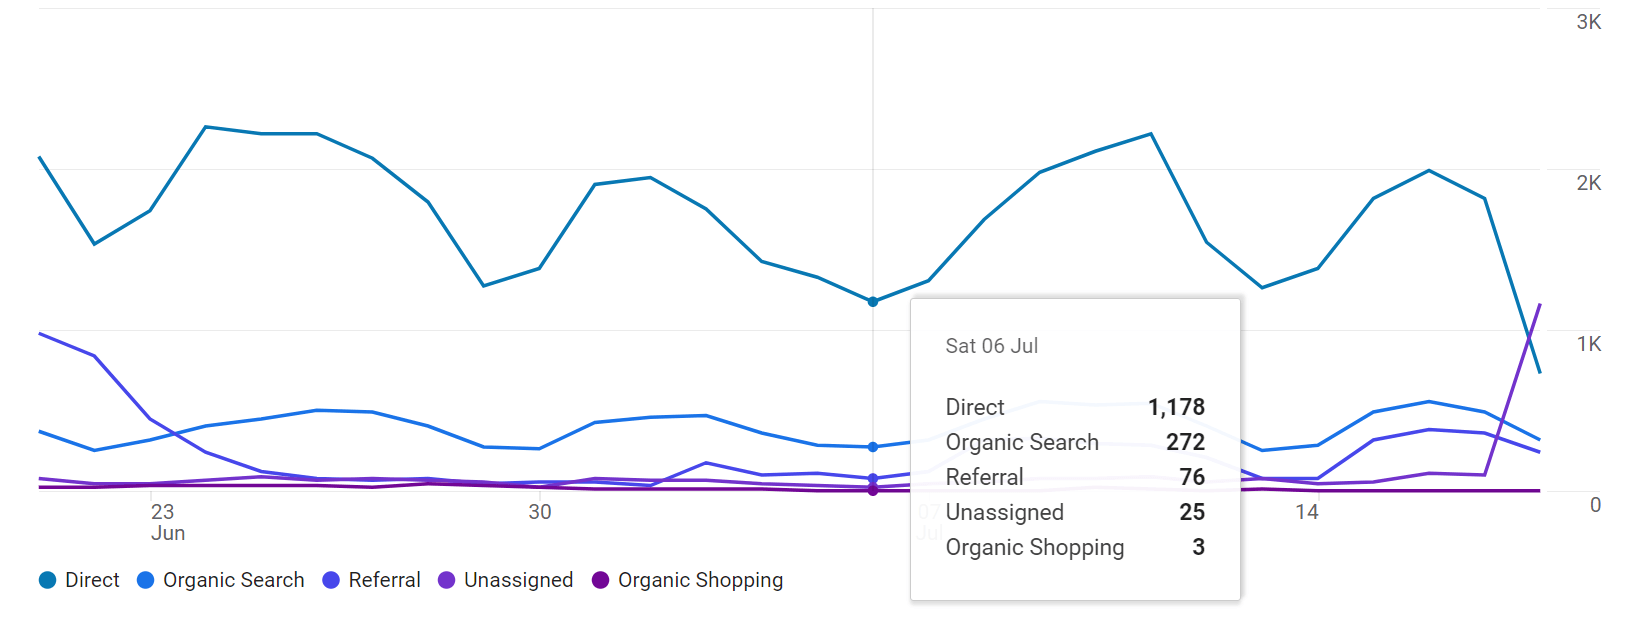
2. Traffic source metric
Traffic source is another vital digital marketing metric.
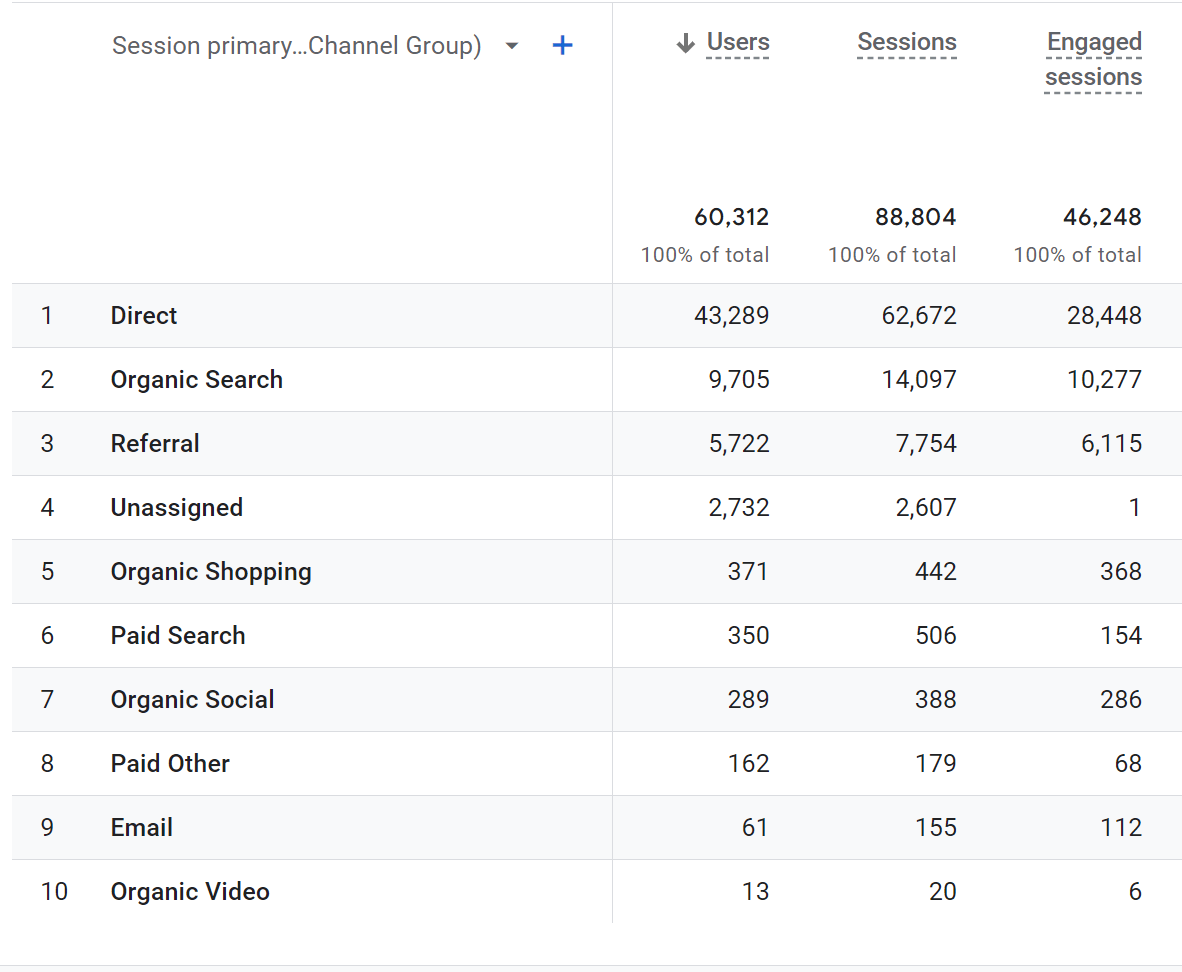
With traffic source, your team can learn which mediums, like organic or paid, drive traffic to your website. This metric helps your business by offering insight into your current Internet marketing strategy.
Maybe, for example, you earn too much traffic from paid tactics versus organic strategies.
The most common traffic sources include:
- Organic search: A user found your site via Google, Bing, or another search engine.
- Direct: A user visited your website directly by typing your URL into their browser.
- Referral: A website referred users to your site via a link.
- Social: A post or comment (with your site’s URL) directed users to your website.
- Paid search: A paid ad, like on Google, brought users to your site.
For the best results with your online marketing strategy, you want a balance between your traffic sources. If you earn all your traffic from one source, like social media or paid search, a single change to those strategies or sources could impact your website traffic and bottom line dramatically.
Quick wins to improve traffic sources
- analyze sources with tools like Google Analytics
- Invest more in high-performing channels
- Experiment with new channels
3. New vs. returning visitors metric
When measuring digital marketing, you also want to look at new versus returning visitors.
This online marketing metric can help your team understand how many new users visit your website, as well as how many past users return to your website. Whether your audience takes a while to make a purchase (or zero time at all), you want to watch this digital metric.
That’s because new vs. returning users can offer insight into the following factors:
- Your buying cycle
- Your ideal client’s brand awareness
- Your product or service’s appeal
- Your website’s usability
- And more
If you have a long buying cycle, but a low number of returning users, it could indicate a problem with your site, as well as offer. Maybe, for example, you aren’t conveying critical product or service information in a way that people understand.
Or, perhaps your site loads super slow, which turns users off from coming back.
Either way, you can use this digital marketing metric to get some insight into user behavior, website usability, and even core marketing factors, like copy. In most cases, you’ll want to monitor this metric for your overall site, as well as key individual pages.
Quick wins to improve new and returning vistors metric
- Offer exclusive deals or content for returning users
- run retargeting campaigns for past visitors
- Provide fresh, engaging content for new visitors
4. New sessions metrics
In Google Analytics, the term “session” defines whenever a visitor comes to your website.
A session might include browsing around several pages on your site, or it could be someone who bounced away.
New sessions occur every time new visitors stop by, and Google Analytics tracks them carefully so you can see how many people you’re attracting to your site.
Another word for this metric is “traffic” since it describes how many people are going to your site.
If you want customers, you need people coming to your site in the first place. And that’s exactly what new sessions tells you.
You can use this figure to help you understand how many of these sessions are converting into customers. A decline in new sessions indicates that people are no longer coming to your site as frequently as they were before, and an increase means your digital marketing plan is improving.
This metric doesn’t directly impact your bottom line, but it’s still important to see how many people come to your site so you can understand how many potential customers you get every day.
Quick wins to improve new sessions metric
- Promote your site via social media ads
- Use email newsletter with CTAs
- Partner with other brands or influencers to reach new audiences
5. Time on page metric
When it comes to digital media metrics, time on the page also deserves your attention.
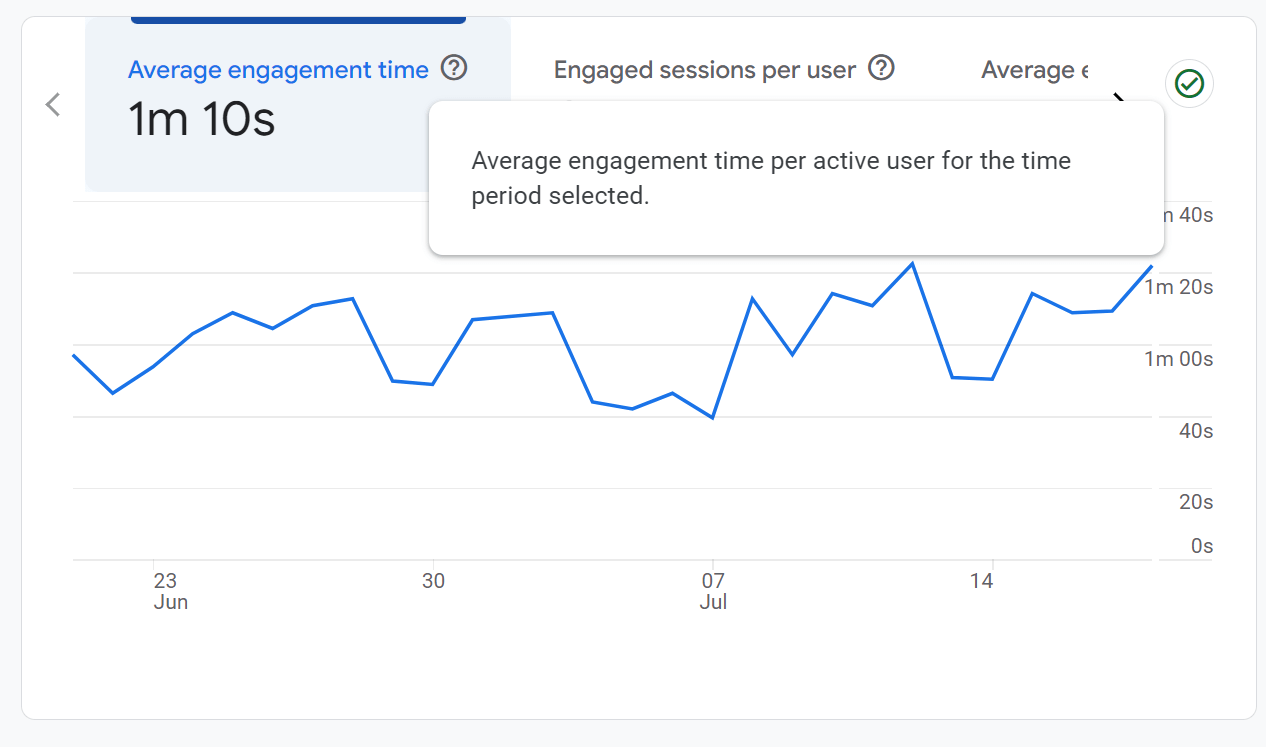
Time on page describes the average amount of time spent on a page. While every marketer wants to know the ideal time on page, it’s difficult to say. How long a user spends on a page depends on the page’s length and offer, as well as the user.
In most cases (based on the page), you will know what is too short.
Keep in mind, however, that most users skim.
They won’t read your content word-for-word, so don’t expect them to spend the same amount of time on a page that you would. Instead, look at your page from a user’s perspective and gauge a decent time on page.
You can understand this digital media metric better by looking at your bounce rate too.

If you have a high bounce rate and low time on page, you can guess that your page isn’t delivering. In response, you can audit the page, look for improvements, and make changes that provide a better user experience and improve your time on the page.
Quick wins to improve time on page metric
- Create high-quality, engaging content
- Use multimedia (such as videos and infographics)
- Improve readability with clear formatting and headings
6. Bounce rate metric
Have you ever gone to a website and left right away?
That’s called a “bounce,” and every good website tracks the percentage of people who “bounce” away.
A bounce rate is the percentage of people who leave a page before engaging with it or clicking to another page on your site.

Ideally, your bounce rate would be 0%, but that’s basically impossible.
If you have a page on your website that has a high bounce rate, you have an opportunity to make it better.
The problem could be anything from the way the copy is written to the images that you’re using, but one thing is clear: Your visitors aren’t finding what they want to see.
As you tweak your page, you will probably see the bounce rate change.
It may go up, which tells you that you should revert to the previous page design, or it may go down, which indicates that you made improvements.
It’s critical to keep visitors on your site as long as possible. The longer they’re with you, the more likely it is that they’ll become customers.
Quick wins to improve bounce rate metric
- Optimize landing pages for relevance
- Improve page load speed
- Use clear CTAs that match visitor expectations
7. Device tracking metric
With more users searching on tablets and mobile devices, companies can’t ignore this digital metric.
Device tracking allows your business to see the number or percentage of users and sessions coming from different devices, including desktops, mobile devices, and tablets. Understanding what people use to visit your site can help you design one that provides the best possible experience.
This online marketing metric can also alert you to pages that provide a terrible mobile experience.
In most cases, these pages lack a mobile-friendly or responsive design. Responsive design lets your website adapt to a user’s device, rather than forcing them to view and navigate your site from a desktop perspective.
A few signs that your website underdelivers for mobile or tablet users include:
- A high bounce rate for mobile or tablet users
- A low time on page for mobile or tablet users
- A high exit rate for mobile or tablet users
When you measure this digital marketing metric, look at the bounce rate, time on page, and exit rate for landing pages. This analysis can help you spot landing pages that fail to provide a mobile-friendly experience, which can hurt your paid and organic strategies.
Quick wins to improve device tracking metric
- Ensure responsive design for all devices
- Test and optimize UX/UI across difference devices
- Use device-specific targeting in ads
8. Exit rate metric
With exit rate, your team can see the percentage of users that leave a page after exploring your site. These users have visited more than one page. In comparison, bounce rate measures the percentage of users that leave after visiting only a single page.
Using exit rate, your company can gain some insight into the buyer’s journey.
For example, maybe users that find your website via a how-to blog post tend to leave or bounce afterward. In comparison, those that read your post about why a service (that you provide) matters tend to view your service pages and then exit your site.
With the above digital marketing metrics for traffic, your team can measure the impact of your online strategy. You can also spot and fix usability issues. These improvements can have a direct influence on the online marketing metrics that influence your revenue.
Quick wins to improve device tracking metric
- Add engaging CTAs to keep users on site
- Ensure navigation is user-friendly
- Use pop-ups or related content suggestion before exit
9. Customer retention rate metric
The customer retention rate measures the percentage of customers a business retains over a set time. It is calculated by subtracting the number of new customers acquired during a period from the total number of customers at the end of a period. You divide it by the number of customers at the start and then multiply by 100.
Retaining existing customers is often cheaper than acquiring new ones. Loyal customers will tend to repeat, and you can then upsell and cross-sell, as they are already familiar with your product.
Quick wins to improve customer retention rate
- Offer loyalty programs and discounts
- Use email campaigns to engage past customers
- Collect and act on customer feedback
Digital marketing metrics to track revenue
No matter which Internet marketing tactics your company uses, you want them to benefit your bottom line. The advantage of digital marketing is that it’s easy to show the link between online marketing and your bottom line. You just have to know which digital advertising metrics to measure.
Jump to your metric of choice
- Click-through rate (CTR)
- Cost per lead
- Cost per click (CPC)
- Cost per acquisition (CPA)
- ROI
- Customer acquisition cost (CAC)
- Conversion rate
10. Click-through rate (CTR) metric
When you advertise online, you want to monitor your click-through rate (CTR).

This digital marketing metric provides a ratio that describes the percentage of users that clicked on your ad, based on the total number of users that saw your ad. In most cases, CTRs are generally low. For example, the average CTR for Google Ads is less than 2%.
That doesn’t mean your business should settle for a low CTR.
You should always look for ways to increase your CTR. A few strategies include:
- Testing different ad copy
- Creating a compelling offer
- Optimizing landing page designs
- And more
When making changes to your ad campaigns, watch for any sudden increases or decreases in CTR.
If you see a sudden increase, it could signal an excellent campaign improvement by your team. In comparison, an immediate decrease that stays could indicate a change that needs reversing by your department.
As CTR will impact the visibility of your ads on platforms like Google Ads, you want to watch this metric.
Quick wins to improve click-through rate (CTR) metric
- Write compelling ad copy or subject lines
- Use eye-catching visuals in ads/emails
- A/B test CTAs and headlines
11. Cost per lead metric
Cost per lead tells you how much you spend to get someone to convert on your site.
A lead is not necessarily someone who has made a purchase (or will make a purchase), but they’re a prospect who you can eventually turn into a customer.

One way you can develop a cost per lead analysis is to look at all the factors that have gone into getting the lead, such as:
- Overall cost for a specific pay-per-click advertising (PPC) campaign focused on getting people to come to your site.
- How many people coming to your landing page give you their information so you can market to them in the future.
Most marketers consider their campaigns to be successful when their cost per lead is less than the average amount a customer spends. The lower your cost is, the more revenue you’re earning!
Many companies don’t realize how much it costs them to get a lead, and that can quickly lead to waste.
After you discover the cost of an average lead, you can try new techniques to determine how to be more cost-effective, get more leads, and maintain your current sources of leads.
Quick wins to improve cost per lead
- Optimize audience targeting
- Use remarketing to engage warmer leads
- Automate lead generation via chatbots or email sequences
12. Cost per click (CPC) metric
Depending on your bid settings, cost-per-click (CPC) may serve as a critical digital marketing metric in your ad campaigns. This metric measures what your company pays, on average, for every click on your ad.
In Google Ads, most businesses pay $1 to $2 per click.

While your company doesn’t want to pay an excessive amount for clicks, you need to have realistic expectations when it comes to your CPC. Depending on your industry, your CPC may go past $1 to $2. Businesses in the legal industry, for instance, pay an average of almost $7 per click.
For the best results measuring this digital marketing metric, as well as optimizing it, you should monitor your CPC over time. You should also research the average CPC in your industry. Looking at keyword data can also help you gauge an accurate or ideal CPC.
Quick wins to improve cost per click metric (CPC)
- Refine keyword targeting in paid ads
- Improve ad quality scores to reduce costs
- Test alternative bidding strategies or platforms
13. Cost per acquisition (CPA) metric
Cost per acquisition (CPA) is an overall online marketing metric for advertising.
With CPA, you can see what your company pays (on average) for a user to convert. Your conversion will depend on your advertising goals. Maybe, for example, you want users to submit a contact form, like a post, or file an application.
When looking at this digital metric, you need to think about the value of a lead or a purchase.
For example, maybe your manufacturing company maintains an average CPA of $50, but that new lead is worth thousands of dollars to your business. In comparison, an ecommerce store that earns about $25 per purchase may see that $50 as unsustainable.
As your CPA also depends on your bidding method, like CPC, optimizing your bids can improve your cost per acquisition. If you can lower your CPC by a few cents, for example, that will also lower your company’s CPA.
Quick wins to improve cost per acquisition (CPA) metric
- Focus on high-converting channels
- Retarget ads to users who show purchase intent
- Optimize landing pages for conversion
14. ROI metric tracking
Your ROI is a measurement of how much money you get back from your digital marketing strategies.
ROI compares how much money you’ve spent on digital marketing and how much you’ve earned as a result of it.

If your ROI is ever negative, it means you’re losing money on digital marketing. That’s never a good sign, and if that’s true for your company, your problem may lie with a low number of new sessions, a low conversion rate, or a high bounce rate.
Your ROI is the cumulative result of your digital marketing efforts, and it’s very cut and dry.
When it’s positive, you’re succeeding. When it’s negative, you need to fix a problem or two.
Quick wins to improve ROI metric
- Increase conversion rates with better UX
- Reduce wasted ad spend by targeting effectively
- Prioritize high-ROI channels and campaigns
15. Customer Acquisition Cost (CAC) metric
The CAC calculates the average cost of a business’s acquisition of a new customer. To calculate this, you add up all the costs associated with accruing the customers, including advertising costs, sales team salaries, and marketing expenses.
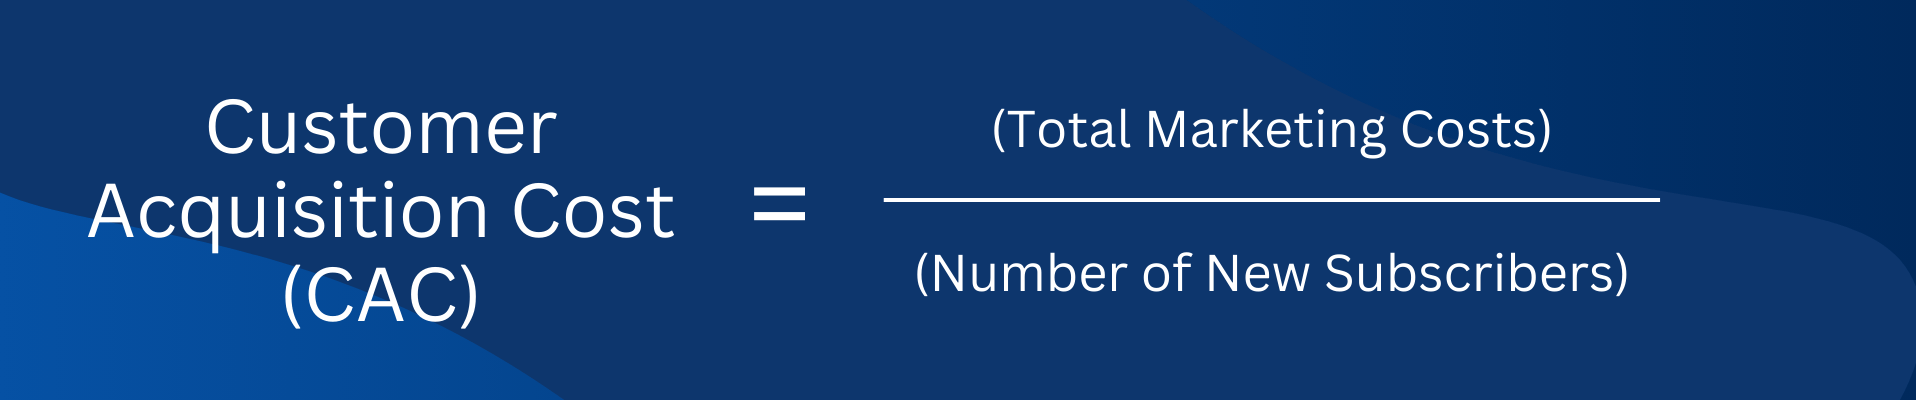
Once you have this number, you divide that total by the number of new customers during a set period. This will give you an idea of the viability of a business customer acquisition strategy. A lower CAC is more desirable, as it means you get customers at a low rate. However, what is considered a “good” CAC may differ from company to company.
Quick wins to improve customer acuisition cost (CAC)
- Improve organic traffic through SEO
- Use referral programs to lower acquisition costs
- Automate parts of the sales funnel
16. Conversion rate metric
The conversion rate of your digital marketing tells you how many people follow through on your call to action (CTA) as opposed to how many do not. Your CTA could encourage people to buy something from you, contact you via phone, or sign up for an email newsletter, to name a few.

For example, let’s say you have a page on your site that encourages people to sign up for your email newsletter.
Out of the 100 people who see it, only four actually sign up. That means your conversion rate is 4%. That may not sound like much, but it’s actually pretty good!
We can take a few steps further. Out of the four people who signed up for your newsletter, you discover that one of those people clicked on a product in your email and bought it.
That’s another conversion, making your conversion rate for your email 25%.
By looking at your conversion rate, you can see how many people you’re successfully turning into customers.
Once you know your conversion rate for a digital media campaign, you can test new ways to improve your results.
In the example above, you may want to try different text on your page or a new subject line of your email. No matter what you choose, the goal is to get more customers so you can grow your business.
Quick wins to improve conversion rate
- Simplify checkout processes
- Optimize landing pages for relevance and design
- Use social proof, such as reviews and testimonials
How to measure your online marketing metrics successfully
You can measure dozens of online marketing metrics. While that data may provide you with plenty of graphics, it may leave you without the insight that you need to analyze your campaign and discover ways to improve it.
If you want to choose and measure your digital marketing metrics, you should follow these three steps:
1. Develop SMART goals
With online marketing, you want to create S.M.A.R.T. goals, also known as:
- Specific: Is your goal detailed and specific?
- Measurable: Can you measure your goal easily?
- Achievable: Is your goal attainable, as well as challenging?
- Relevant: Does your goal align with your short- and long-term goals?
- Timely: When is your deadline for achieving this goal?
Building a S.M.A.R.T. goal will save your team time. It’ll also ensure everyone in your department understands what you want to accomplish. You don’t want to only run ads, for example. You want to drive five leads in three months with a monthly ad spend of $2500.
S.M.A.R.T. goals also make measuring your digital marketing efforts easier.
You know which online marketing metrics matter. In the example above, for instance, you know that your conversions are a top priority. CPC, as well as CPA, will probably also earn your attention because you want to see the financial effectiveness of your ad campaign.
Want to know more about SMART goals? Read this article, with video!
2. Choose effective tools
Next, you want to pick your toolset.
Companies can choose from a range of website analytics tools when it comes to digital marketing metrics. While Google Analytics is a popular choice, many businesses also invest in strategy-specific tools, like Ahrefs for SEO.
If you’re new to online marketing, try and start with some free tools, like Google Analytics.
3. Choose your reporting methods
In most cases, your team will need to compile and share your results with people throughout your business. Maybe, for example, company leaders would like quarterly digital marketing reports to see the effectiveness of your marketing and advertising efforts.
Deciding how you will report your data (before you launch your digital marketing strategy) can save time and headaches. It can also make sure that you’re monitoring critical online marketing metrics throughout the designated period.
You may also want to think about what platform or program you will use to build reports.
While you could use a presentation or text document, many companies and online marketing agencies use Google Data Studio. This free program makes it easy for your team to import data from places like Google Analytics and display it in an informative and easy-to-follow way.
Once you complete these three preliminary steps, you can get started with launching your campaigns!
Improve your digital marketing metrics with WebFX
At WebFX, we have a full team of experienced digital marketing experts who know the best ways to evaluate your online success. Our team covers a wide range of specialties from SEO to social media and beyond, and they know all the best ways to make sure you see the returns you want from your marketing dollar.
Contact us today to create a digital marketing plan for your company!