How much should a company spend on marketing in 2027?
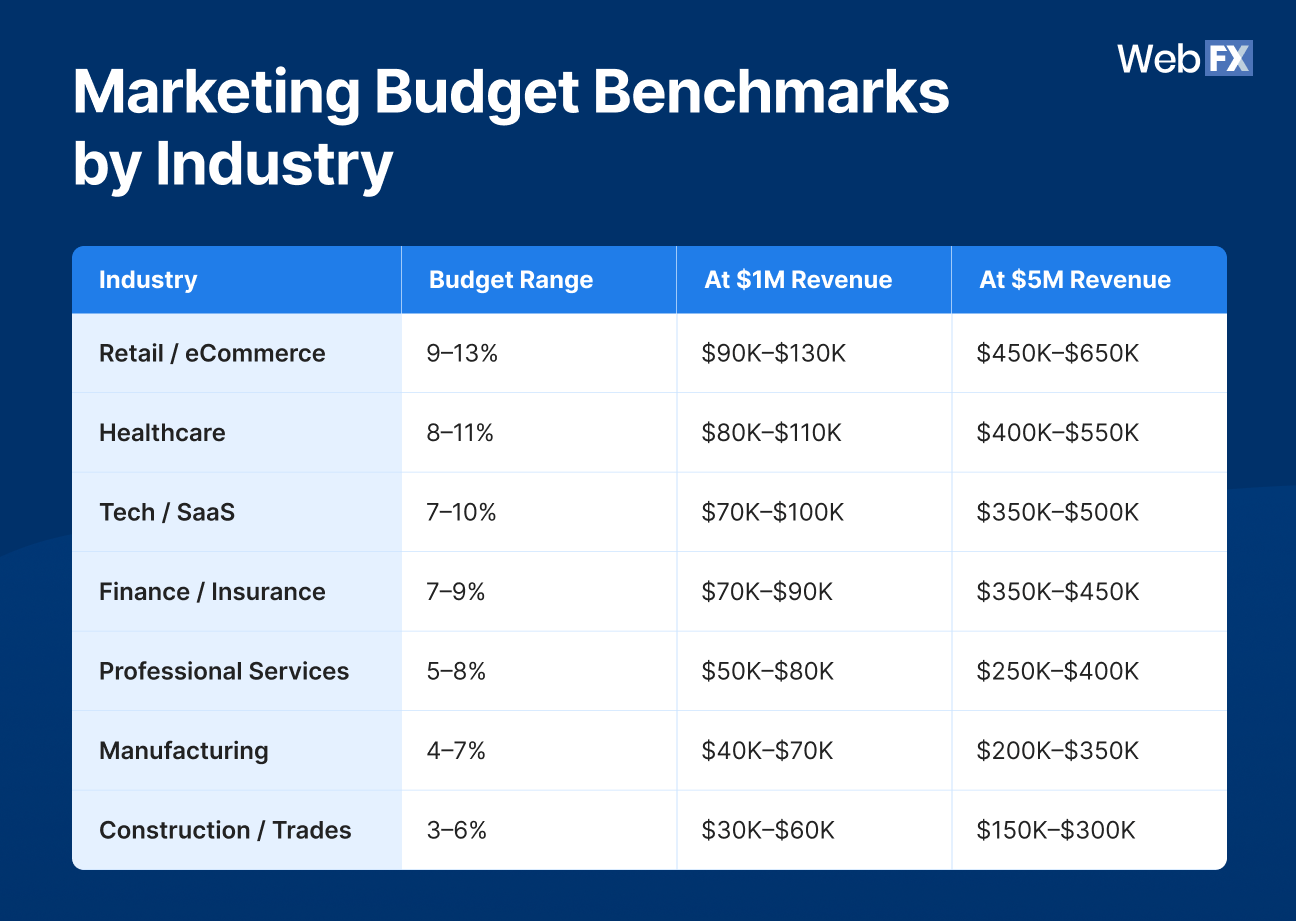
Based on WebFX’s data, companies should generally budget 3% to 13% of annual revenue for marketing, depending on their industry.
Industry sets your starting benchmark: Recommended budgets range from 4-6% for Manufacturing to 8-11% for Healthcare.
Marketing maturity refines your recommendation: Newer businesses may need more investment to build market awareness, while established brands may benefit from greater efficiency.
Growth goals shape your marketing mix: Recommended allocations across AI Search & SEO, content, digital advertising, email, and experimentation vary based on your business model and growth ambitions.
How much should your company invest in marketing to reach its growth goals?
The answer depends on more than revenue alone. Two companies generating the same annual revenue can have very different marketing needs based on their industry, market position, competition, and growth ambitions.
To help businesses plan for 2027, WebFX combined 30 years of experience serving thousands of businesses with AI-powered forecasting, internal data, and trusted third-party research.
Below, we break down what our data reveals about marketing budgets across industries, the factors that influence recommended spending, and how to allocate your investment based on your business and growth goals.
Try our free Marketing Calculator
Craft a tailored online marketing strategy! Utilize our free Internet marketing calculator for a custom plan based on your location, reach, timeframe, and budget.
What WebFX data shows about how much companies should spend on marketing
There’s no single marketing budget percentage that works for every company.
Our data shows that your industry provides a useful starting benchmark, but an effective marketing budget also accounts for where your business is today, where you want to go, and how you plan to get there.
Here are five findings to consider as you build your 2027 marketing budget.
1. Marketing budgets range from 3% to 13% of revenue by industry
Your industry provides the starting point for determining what percentage of revenue your company should spend on marketing.
Our recommended marketing budget percentages by industry range from 3% to 13% of annual revenue:
Revenue alone doesn’t tell you what a realistic marketing budget looks like.
Two companies can each generate $5 million annually and have very different marketing budgets. A retail business may invest $450,000 to $650,000 per year, while a construction business at the same revenue level may invest $150,000 to $300,000.
That means two equally sized businesses could reasonably have annual marketing budgets that differ by hundreds of thousands of dollars. A more useful marketing budget benchmark considers revenue in the context of how businesses in your industry compete for and win customers.
2. Marketing maturity helps refine your recommended marketing budget
Marketing maturity reflects how established your company and brand are in your market. Newer companies often need to invest more to build the awareness, visibility, and demand that established brands already have.
Market leaders may be able to operate more efficiently because they’ve already built advantages like brand recognition, organic visibility, an existing customer base, and market awareness.
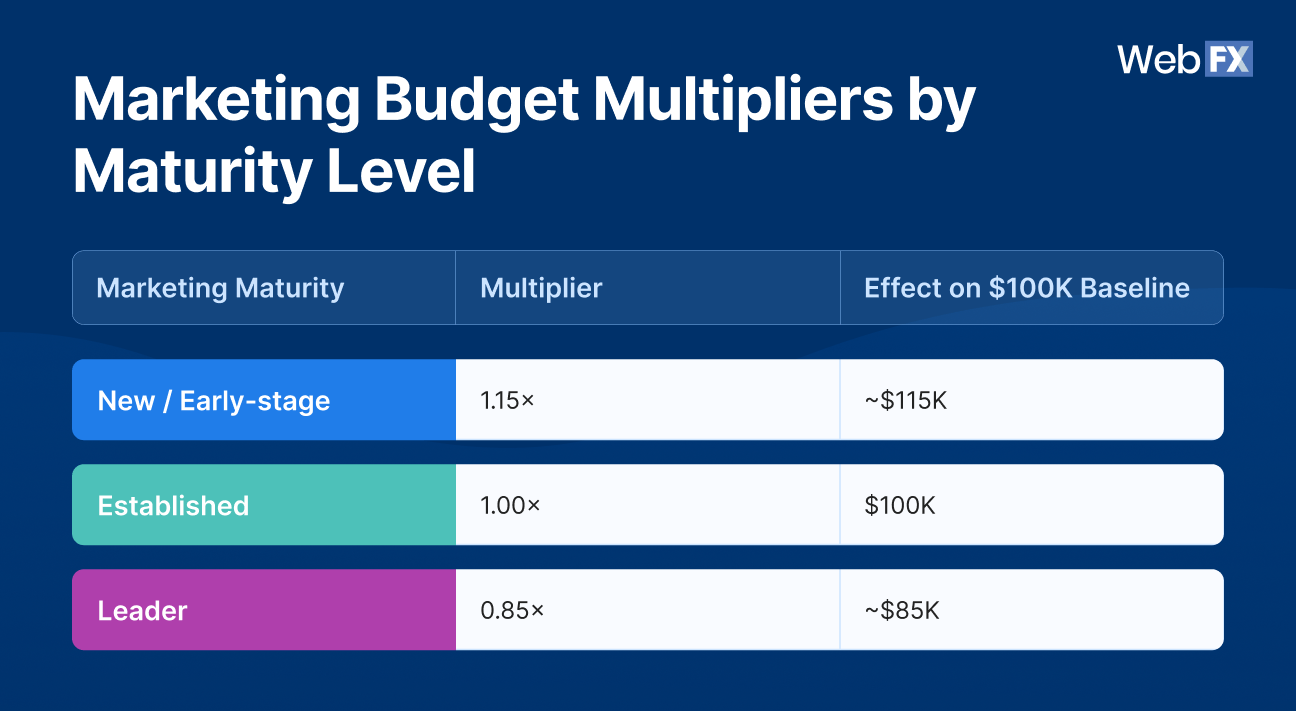
Our model uses the following marketing maturity multipliers to account for that difference:
An established company uses the 1.00x baseline. A newer company still building its market position uses a 1.15x multiplier, while a market leader uses a 0.85x multiplier.
With everything else equal, these adjustments create a meaningful difference in recommended investment between businesses at different maturity levels.
That doesn’t mean every market leader should reduce its marketing spend or every newer company should automatically spend more. Competition, expansion into new markets, product launches, and other business priorities can still require additional investment. Marketing maturity is one input that helps refine the broader recommendation for your business.
3. Growth goals change how companies allocate their marketing budgets
Once you have a starting marketing budget, your growth goal helps determine where to invest it.
We group growth goals into three categories:
Maintain: Focus on profitability and protecting your existing market share.
Grow: Pursue steady, sustainable growth.
Aggressive: Prioritize faster growth and capturing new market share, typically at a higher acquisition cost.
More aggressive growth doesn’t simply mean investing more in the same marketing channels. The recommended mix changes, too.
B2B marketing budget allocation
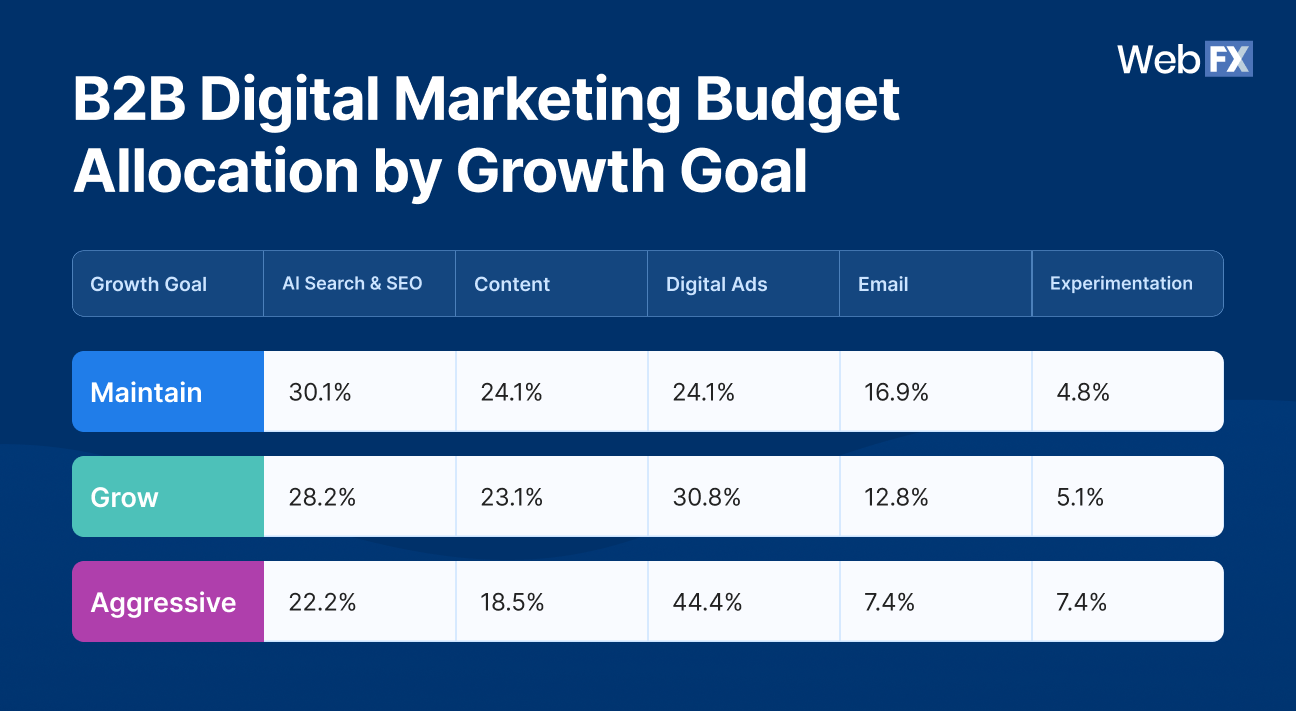
For B2B companies, the recommended channel mix shifts as growth goals become more ambitious:
AI Search & SEO receives the largest recommended share for B2B companies focused on maintaining their position. As the growth goal becomes more aggressive, a larger share shifts toward digital advertising and experimentation.
The most pronounced change is in digital advertising, which increases from 24.1% for Maintain to 44.4% for Aggressive growth. At the same time, the relative shares for AI Search & SEO, content, and email decrease.
The takeaway isn’t to pull budget from a channel that’s already performing well. Instead, use the mix as a starting point and weigh it against the channels already producing qualified leads and revenue for your business.
B2C marketing budget allocation
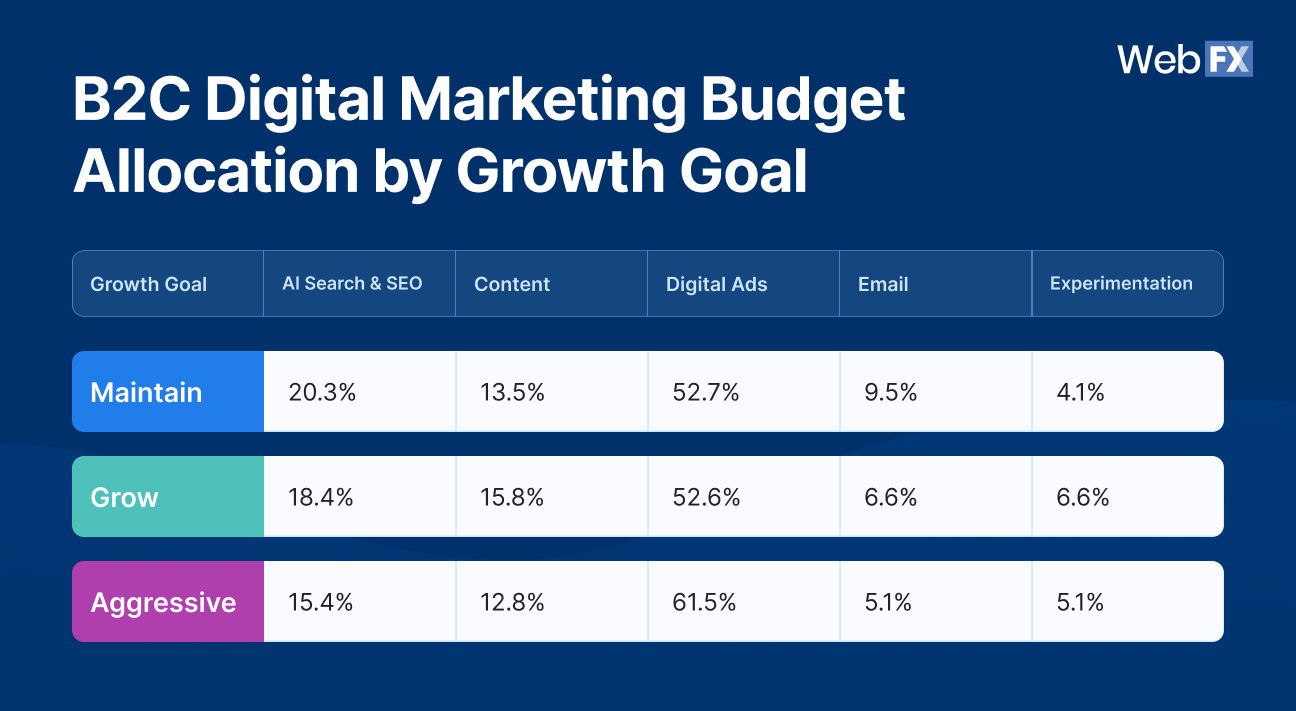
B2C businesses start with a different marketing mix:
Digital advertising accounts for more than half of the recommended B2C digital marketing budget at every growth goal, from 52.7% for Maintain to 61.5% for Aggressive.
The difference between B2B and B2C is important. B2B companies make a more pronounced shift in their channel mix as growth goals become more aggressive, while B2C companies begin with a larger share allocated to digital advertising.
Keep in mind that these are general benchmarks. Your recommended channel mix may vary based on your industry, business goals, existing performance, and other factors unique to your company. For a more personalized recommendation, use our Marketing Budget Calculator or connect with our team to build a budget around your specific needs and growth opportunities.
4. Industry changes the recommended marketing channel mix
Industry influences more than how much your company may need to spend on marketing. It can also influence where that investment goes.
Your business model and growth goal provide a starting marketing mix, while industry adds another layer to the recommended allocation.
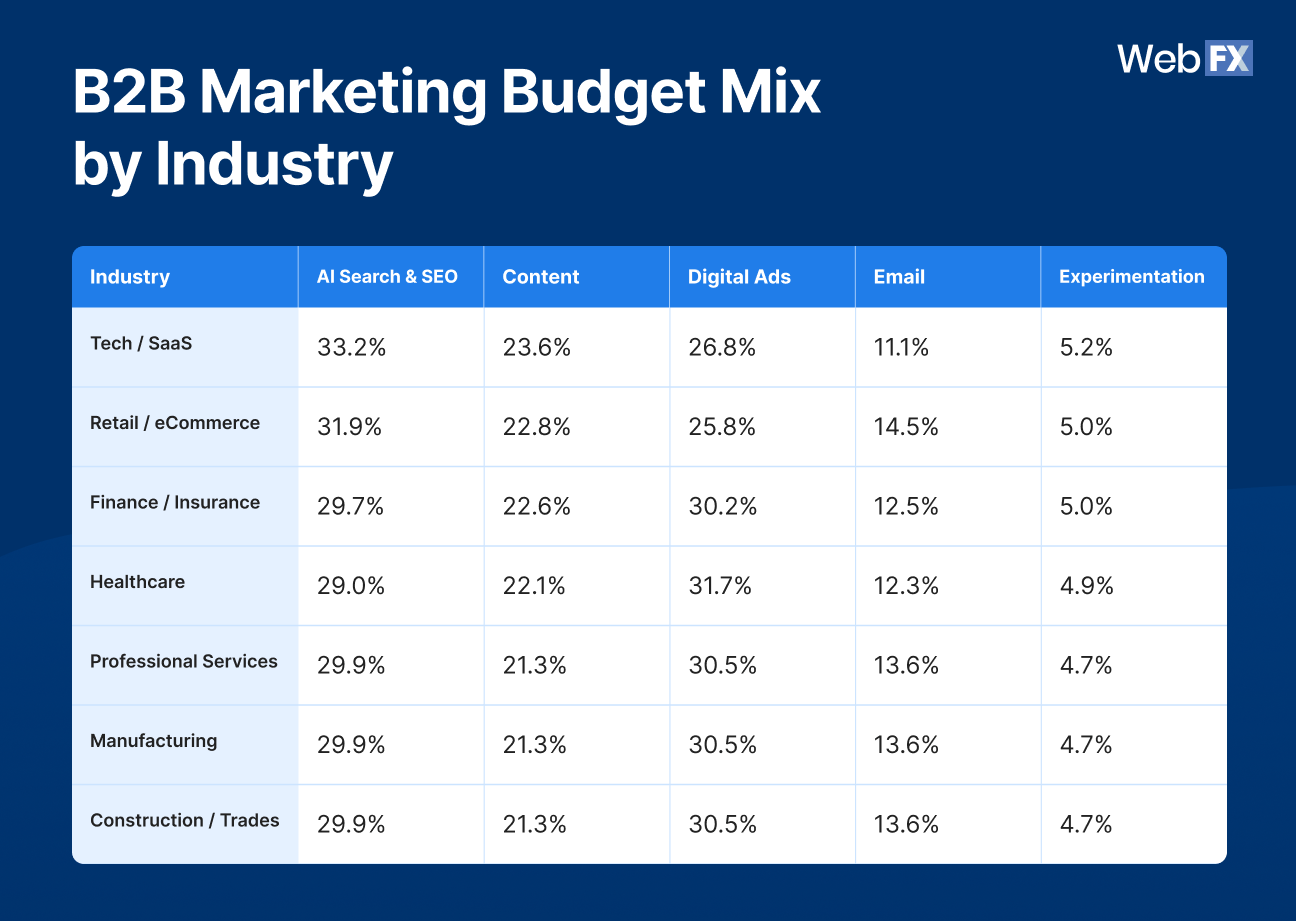
For example, here’s how the recommended channel mix differs across B2B industries pursuing a Grow goal:
These industry-level recommendations apply an industry modifier to the base B2B channel mix, which is why they differ slightly from the broader B2B recommendations above.
For Tech and SaaS and Retail and Ecommerce businesses focused on steady growth, AI Search & SEO receives the largest recommended share.
For Finance and Insurance, Healthcare, Professional Services, Manufacturing, and Construction and Trades, digital advertising narrowly receives the largest share.
The differences between some channels are small, so these benchmarks aren’t intended to dictate exactly where every marketing dollar goes. Use them as a starting point, then adjust your channel mix based on your own lead, customer, and revenue performance.
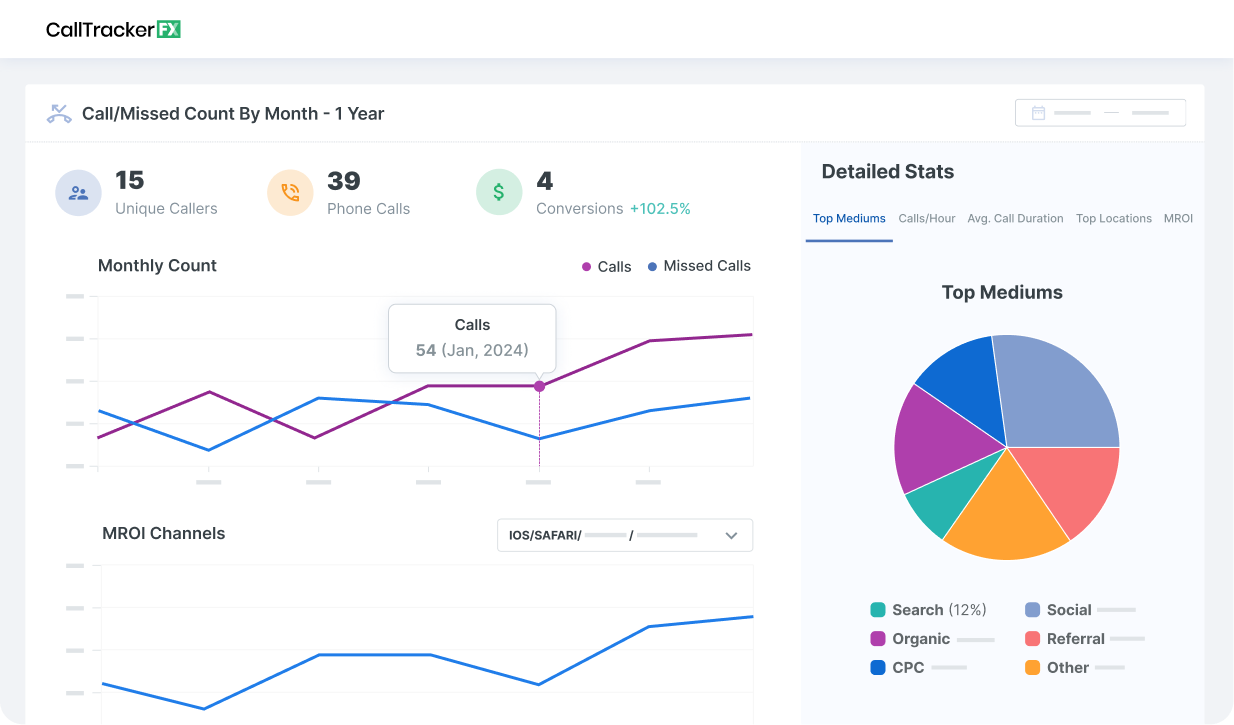
This is where having connected marketing and revenue data becomes especially valuable. With RevenueCloudFX, WebFX helps clients connect marketing performance to leads, customers, and revenue, giving our strategists greater visibility into which channels are driving business results and where to prioritize or reallocate marketing spend.
Measuring the metrics that affect your bottom line.
Are you interested in custom reporting that is specific to your unique business needs? Powered by RevenueCloudFX, WebFX creates custom reports based on the metrics that matter most to your company.
“Instead of driving a digital strategy based on metrics like cost per lead, number of form fills, or keyword rankings, we’re able to calculate the ROI of different marketing channels and continually tweak our strategy to focus budgets on the highest-performing channels. We’re able to give our team of expert consultants clear-cut data and forecasting, which leads to data-backed strategies and recommendations, something every business should look for from their marketing partners.”
5. Reserve 4% to 7% of your marketing budget for experimentation
Your digital marketing budget should also leave room to test emerging channels and strategies.
Our model recommends reserving roughly 4% to 7% of your digital marketing budget for experimentation, depending on your business model and growth goal:
Growth Goal
B2B Experimentation budget
B2C experimentation budget
Maintain
4.8%
4.1%
Grow
5.1%
6.6%
Aggressive
7.4%
5.1%
This allocation gives your team room to test emerging marketing opportunities before committing a larger share of your budget.
For every experiment, define what you’re testing, what success looks like, how much you’re willing to spend, and when you’ll evaluate the results. If the test works, you can scale it. If it doesn’t, you’ve limited the investment without taking significant budget away from proven marketing channels.
Expert insights from
Trevin S.SVP, Sales at WebFX
“One of the most common mistakes I see when determining how to spend a marketing budget is not allocating enough budget to new marketing channels. It’s good to double down on things that are reliable and work well, but marketers should be consistently budgeting for exploratory channels too. This helps develop new long-term marketing channels and also gives you a backup plan if your tried and true marketing channels start to sputter a bit.”
How to calculate your marketing budget
To calculate a starting marketing budget, combine your annual revenue, recommended industry percentage, and marketing maturity:
Annual revenue x industry marketing budget percentage x marketing maturity multiplier = recommended annual marketing budget
For example, consider a manufacturing company earning $5 million in annual revenue that’s still building its position in the market.
Manufacturing companies have a recommended marketing budget of 4% to 7% of annual revenue. Because this company is still building its market position, it applies the 1.15x New / Building maturity multiplier:
Low end: $5,000,000 × 4% x 1.15 = $230,000
High end: $5,000,000 × 7% x 1.15 = $402,500
The company’s recommended annual marketing budget is therefore $230,000 to $402,500.
From there, its growth goal, business model, industry, and actual marketing performance help determine how to allocate that budget across channels.
Your recommended marketing budget range is a starting point, not a fixed spending requirement. Your competitive environment, geographic reach, sales cycle, margins, existing performance, expansion plans, and other business priorities can influence your final investment.
Use our Marketing Budget Calculator to estimate how much your business should budget for marketing each month.
Start with your annual revenue and the recommended marketing budget percentage for your industry. Then adjust that amount using the marketing maturity multiplier that best represents your company’s current market position.
Our starting formula is:
Annual revenue x industry marketing budget percentage x marketing maturity multiplier = recommended annual marketing budget
Your growth goals, business model, industry, and actual performance can then help determine how to allocate that investment.
Where you invest depends on your business model, industry, growth goals, and existing performance.
Our data shows that recommended channel allocations change as businesses move from maintaining their position to pursuing steady or aggressive growth. Those shifts also differ between B2B and B2C businesses.
Use these benchmarks as a starting point, then prioritize the channels generating the strongest qualified leads, customers, and revenue for your business.
Your budget should also leave room for testing new channels and strategies rather than committing every dollar to existing programs.
The right marketing budget breakdown will look different for every company. Your industry, growth goals, business model, and existing performance can help determine which areas deserve the largest share.
We recommend reserving roughly 4% to 7% of your digital marketing budget for experimentation, depending on your business model and growth goal.
Treat experimentation as a dedicated budget line so your team can test emerging channels and tactics without taking significant investment away from proven marketing programs.
See What Smart Marketing Looks Like at Your Budget
We’ll show you what’s possible and where to focus—based on data from thousands of successful campaigns.
Your industry, marketing maturity, growth goals, and performance data can help you move from a generic marketing benchmark to a budget built around your business.
Start with our free Marketing Budget Calculator to get a personalized recommendation based on your business and goals.
Then, connect with our team to turn that budget into a strategy. Our strategists can help you evaluate where you’re investing today, identify your biggest opportunities, and build a data-backed marketing strategy focused on driving measurable leads and revenue in 2027.
Methodology
Our marketing budget recommendations are based on dozens of data points, including our 30 years of experience helping thousands of businesses across hundreds of industries grow through digital marketing.
We also use our AI-powered forecasting technology to model the level of marketing spend and channel allocation businesses may need to reach their growth goals. These recommendations account for factors including industry, business model, company size, marketing reach, marketing maturity, and growth goals.
Our methodology also incorporates research from trusted third-party organizations, including Gartner and Deloitte.
Together, these inputs help us estimate an effective marketing budget based on a business’s specific situation rather than relying on a single, one-size-fits-all percentage of revenue. The marketing budget percentages, industry benchmarks, maturity adjustments, and channel allocations throughout this article reflect that same data-backed approach.
Try our free Marketing Calculator
Craft a tailored online marketing strategy! Utilize our free Internet marketing calculator for a custom plan based on your location, reach, timeframe, and budget.
Craft a tailored online marketing strategy! Utilize our free Internet marketing calculator for a custom plan based on your location, reach, timeframe, and budget.










 Maria is a Lead Content Specialist at WebFX. With nearly two decades of experience in B2B and B2C publishing, marketing, and PR, she has authored hundreds of articles on digital marketing, AI, and SEO to help SMB marketers make informed strategic decisions. Maria has a degree in B.S. Development Communication major in Science Communication, and certifications in inbound marketing, content marketing, Google Analytics, and PR. When she’s not writing, you’ll find her playing with her dogs, running, swimming, or trying to love burpee broad jumps. View full profile
 Sarah Berry is a Lead SEO Consultant at one of the largest digital marketing agencies in the USA — WebFX. With more than 10,000 hours of experience, she offers practical insights and strategies to grow your digital revenue. Her work has been cited by Michigan State University, Business Insider, and Ars Technica. When she isn’t polishing her Time Magazine Person of the Year Award, she’s spending time with her flock of ducks. View full profile
 Emily Carter is the Sr. Content Team Lead at WebFX, where she leads the creative team behind the company’s content. With an M.S. in Digital Marketing and 10+ years of experience, she’s written and reviewed hundreds of articles on marketing, SEO, and tech. These days, her focus is on content strategy and operations, with a special interest in the systems, processes, and people that help great content come to life. Her work appears across WebFX and its brands, including SEO.com, Nutshell, and TeamAI, and has been featured by Social Media Today, HuffPost, and more. Outside the office, she’s usually road-tripping, hiking, or planning her next national park adventure. View full profile@emcarter16