



Contents
- How to allocate marketing budget across multiple locations and brands
- Core marketing budget allocation strategies for multi-location businesses
- How much should multi-location companies spend on a marketing budget in 2026?
- How WebFX helps multi-location companies make smarter budget decisions
- FAQs about allocating marketing budget across locations and brands
- Ready to build a smarter multi-location marketing budget?

How to allocate marketing budget across multiple locations and brands
- Score each location or brand on opportunity, performance, capacity, and priority.
- Marginal return matters more than average historical return when allocating budget.
- Different locations and brands need different budget decisions.
- Reserve dedicated test budget so new locations can prove themselves fairly.
The best way to allocate marketing budget across multiple locations and brands is to score each one on four factors, including opportunity, performance, capacity, and strategic priority. Let that score decide whether it should scale, fix, test, maintain, or shrink its investment.
This approach usually raises a follow-up question from leadership: Why doesn’t every location just get the same budget? It’s a fair question, and an even split is the easiest answer to give. It’s also rarely the answer that puts your next marketing dollar to its best use.
If you’re a marketing manager, CMO, or private equity operating partner responsible for splitting a budget across locations, brands, or acquired companies, this guide walks through how to apply that four-factor framework to your own numbers and why it may be more helpful than an even split.

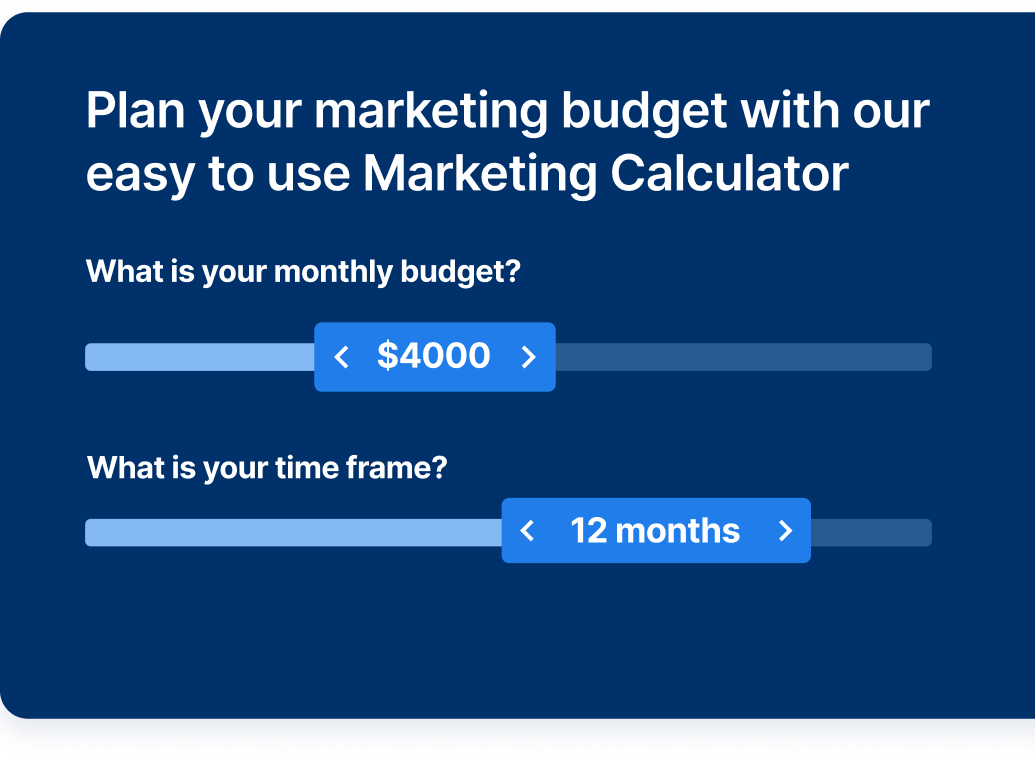
Try our free Marketing Calculator
Craft a tailored online marketing strategy! Utilize our free Internet marketing calculator for a custom plan based on your location, reach, timeframe, and budget.
How to allocate marketing budget across multiple locations and brands
Once you know roughly how much you have to invest, the real work starts: deciding how much each location or brand should get. Use four factors, opportunity, performance, capacity, and priority, to make that call instead of splitting the total evenly across every market.
1. Establish a common measurement framework across locations and brands
Before you compare a single location or brand’s numbers, make sure you’re comparing the same thing. Across every location and brand you’re evaluating, standardize your definitions for factors like:
- Spend
- Lead
- Qualified lead
- Opportunity
- Customer
- Revenue
- Cost per lead
- Customer acquisition cost
- ROI
You can’t allocate budget intelligently across businesses that measure performance differently.
For example, Brand A might count any form submission as a lead, while Brand B only counts a sales-qualified opportunity as a lead.
Comparing cost per lead between the two brands might not provide useful information, since Brand A’s leads are far easier to generate than Brand B’s.
This is also where centralized reporting earns its keep. A fragmented setup, where every brand or location runs its own dashboard, attribution model, and lead definition, makes an apples-to-apples comparison nearly impossible without weeks of manual reconciliation.
A platform that rolls performance up from corporate to brand to location to channel gives you one consistent view instead.
2. Measure market opportunity
Once your definitions match, figure out how much room each location or brand actually has to grow. Three categories of inputs matter most:
- Search and demand signals: Look at search volume, paid search impression opportunity, local demand, and organic visibility gaps.
- Market signals: Consider population or businesses served, geographic coverage, competitive intensity, and current market share.
- Customer economics: Factor in average sale value, recurring revenue, lifetime value, and margin where you have the data.
A location with excellent marketing efficiency but almost no remaining addressable demand may have less room to grow than a moderately performing location sitting in a much larger, mostly untapped market.
Efficiency tells you how well a market is being served today. Opportunity tells you how much room is left.
3. Measure current marketing performance
Track the full funnel rather than stopping at cost per lead. That includes tracking spend, leads, qualified leads, customers, and revenue.
Say Location A generates leads for $100 each, but few of them close. Location B generates leads for $300 each, and most of them become high-value, repeat customers.
Judging the two locations by cost per lead alone would favor Location A, even though Location B likely creates more revenue per dollar spent.
This is also where marginal return matters more than average return. Historical ROAS tells you how a market has performed. It doesn’t tell you what the next dollar you spend there will produce.
Location A might show a strong historical return, but if that market is close to saturated, the next $10,000 spent there might barely break even. Location B might show a more modest historical return, but with real headroom left, that same $10,000 could generate several times its cost in new revenue.
The lesson: When you’re measuring current marketing performance, don’t stop at each location’s historical average. Ask what the next dollar is likely to produce in each market, and let that marginal return, not the average one, guide where your incremental budget goes.
4. Account for operational capacity
This is the factor that gets skipped most often, and it’s what separates a real multi-location budget plan from generic marketing advice.
A location can have excellent marketing economics and still have no ability to serve more customers. Before increasing spend anywhere, check sales and technician or crew capacity, appointment availability, inventory and service radius, installation backlog, and call center capacity.
Let’s take, for example, two locations owned by the same company. Location A shows an excellent return on ad spend, but its technicians are fully booked. Location B shows a good, slightly lower return, with 30% of its capacity still available.
Location B is likely the stronger candidate for incremental spend, even though its numbers look worse on paper, because Location A can’t actually convert new demand into served customers yet.
Capacity constraints and demand constraints aren’t the same thing, either. A location might be capped because it’s run out of technicians, which is an operational limit, or because it’s already reaching most of its addressable local audience, which is a demand limit.
Both cap how much a strong performer can absorb, but they call for different fixes. Marketing budget should follow business capacity, not marketing efficiency alone.
5. Layer in strategic priority
Not every budget decision is a short-term return on investment question. Even when the near-term numbers don’t look as strong as an established location’s, leadership may intentionally prioritize:
- New markets
- Recent acquisitions
- Strategic brands
- New service lines
- Geographic expansion
A newly acquired location, for example, often starts with higher customer acquisition costs, lower brand awareness, and limited organic visibility. It can still deserve investment if it’s strategically important to where the company wants to grow.
Performance tells you what has worked. Strategy tells you where the company wants to go. A solid budget allocation needs both.
6. Build a multi-location marketing opportunity score
Once you’ve gathered opportunity, performance, capacity, and priority data for each location or brand, turn it into a score you can compare side by side.
| Factor | What you’re measuring | Example inputs |
| Opportunity | Available growth |
|
| Performance | Marketing economics |
|
| Capacity | Ability to serve growth |
|
| Priority | Strategic importance |
|
Score each factor for every location on a simple scale:
- 1 = Low
- 3 = Moderate
- 5 = High
Score them and look at the pattern the scores create.
| Location | Opportunity | Performance | Capacity | Priority | Likely action |
| A | 5 | 5 | 5 | 4 | Scale |
| B | 5 | 2 | 5 | 4 | Fix |
| C | 3 | 4 | 1 | 3 | Maintain |
| D | 5 | New market | 5 | 5 | Test |
Here’s what these numbers tell us:
- Location A scores well across the board, which makes it a clear candidate to scale.
- Location B has the demand and capacity but a performance problem, pointing to a fix before adding spend.
- Location C has strong performance but almost no remaining capacity, so protecting its current investment makes more sense than growing it.
- Location D is a new or recently acquired market with no performance history yet, so it becomes a controlled test.
The numbers above are just a few examples of what a spread could look like. There’s no single correct weighting for these four factors, and you should adjust the weighting to fit your own business model and growth plan.
This kind of scoring becomes especially useful when you’re splitting a real incremental budget. Picture a 20-location home services company with $500,000 in new budget to deploy for the year.
Instead of splitting that into 20 equal $25,000 shares, the company runs each location group through the opportunity score. Locations with strong opportunity, performance, and capacity get the largest increases, while locations with strong demand but a conversion problem get a smaller increase earmarked specifically for fixing the funnel.
New or recently acquired locations get a modest, clearly labeled test budget, and locations with strong existing share and limited remaining capacity get just enough to maintain their position.
The $500,000 ends up split unevenly on purpose, because the underlying opportunities are uneven too.
7. Put every location or brand into one of 5 budget buckets
A score tells you how a location or brand compares to the rest. It doesn’t tell you what to actually do with its budget, so turn each score into one of five actions.
Scale
The strongest signals that indicate you should be scaling include:
- Strong demand
- Strong customer economics
- Strong conversion
- Available capacity
When all or most conditions are met, the budget action should be to increase your investment, since the location or brand has both the demand and the ability to serve it.
Fix
The strongest signals that indicate you need to fix before you scale include:
- Strong demand
- Weak conversion or poor close rates
- Lead-routing issues
- A weak website or landing experience
- Gaps in tracking
When these conditions show up, the budget action should be to invest in fixing the constraint first, whether that’s conversion rate optimization, the sales process, or tracking, rather than pouring more spend into demand generation.
Sometimes the best use of an extra $50,000 is fixing what’s broken in the funnel, not buying $50,000 more in ads.
Test
The strongest signals that indicate a location or brand belongs in a test budget include:
- An attractive, high-demand market
- A new acquisition or new branch
- A new service line
- Limited or no historical performance data
When these conditions apply, the budget action should be to set aside a controlled test investment that establishes baseline demand, cost per lead, lead quality, close rate, customer acquisition cost, and revenue potential before judging it against mature markets.
Maintain
The strongest signals that indicate you should maintain current investment include:
- Strong existing market share
- Stable performance
- Limited remaining demand
- Limited capacity
When these conditions apply, the budget action should be to protect current visibility and customer flow rather than aggressively growing spend that the location or brand can’t fully use yet.
Reduce or reallocate
The strongest signals that indicate you should reduce or reallocate budget include:
- Persistently weak economics
- Limited demand
- Poor customer quality
- A saturated opportunity
- Stronger opportunities elsewhere in the portfolio
When these conditions apply, the budget action should be to pull back incremental spend and move that budget to a location or brand where the evidence supports a stronger return.
Budget allocation should stay dynamic, not permanent. A location can move between these five buckets as demand, performance, capacity, or strategy shift, so revisit the classification regularly instead of setting it once a year.
8. Build a quarterly multi-location budget review
Budget allocation isn’t a spreadsheet exercise you run once a year and forget. Review the following on a recurring basis, ideally quarterly:
- Market opportunity: Has demand changed in any location or brand?
- Performance: Which locations or brands improved or declined?
- Capacity: Can each location take on more business right now?
- Strategy: Have company priorities shifted?
- Tests: What did your test budget teach you?
- Reallocation: Where should incremental budget move next?
Each review should produce a clear decision for every location or brand regarding whether you need to increase, maintain, fix, test, or reduce. Your budget should move as the evidence moves.
Core marketing budget allocation strategies for multi-location businesses
Here are some top strategies to help you allocate your budget effectively:
- Match investment to each location’s growth stage: Newer locations need more awareness spend, while established ones get more from channels close to the purchase, like branded search and retargeting.
- Weight incremental budget toward markets with room to grow: Give underpenetrated markets a bigger share of new budget, and give saturated markets enough to hold their position.
- Use the 70-20-10 rule as your starting split: Put 70% toward proven locations and channels, 20% toward promising markets gaining traction, and 10% toward experiments like a pilot campaign at a new branch.
- Centralize the foundation and give locations a local budget: Corporate should fund shared assets like your website, brand creative, and reporting, and each location manager should get a sub-budget for local events and geo-targeted ads.
- Set a baseline floor for every location: Fund the local search basics everywhere, including an accurate Google Business Profile, a location page, and review management, so no location drops out of sight.
- Plan spend around each market’s seasonality: Shift dollars into each market ahead of its own peak season so campaigns have time to ramp up before demand arrives.
How much should multi-location companies spend on a marketing budget in 2026?
A healthy digital marketing budget generally runs 5% to 12% of company revenue, based on our marketing budget research, which drew responses from 700 business leaders across 12 industries.
Growth-focused companies tend to invest closer to 10% to 12% of revenue, while established companies protecting market share often spend closer to 5% to 8%.
That percentage is a useful starting point for your total marketing budget, but it breaks down the moment you apply it evenly across every location or brand.
Applying 8% of revenue company-wide and then dividing the result evenly by your location count produces a very different number than applying that same 8% to each location’s own revenue and adjusting from there.
A location generating $2 million a year and a location generating $8 million a year shouldn’t get the same marketing dollars just because they share a percentage benchmark. The percentage tells you roughly how much to invest overall. It doesn’t tell you where that investment should go.
How WebFX helps multi-location companies make smarter budget decisions
Making these decisions well depends on having comparable data across every location and brand in the first place, which is where most companies get stuck.
WebFX helps multi-location and multi-brand companies centralize marketing and revenue data, compare performance across locations and brands, and turn that comparison into a real budget decision.
Our technology, RevenueCloudFX, connects spend, leads, customers, revenue, customer acquisition cost, and return on investment across every location and brand in one platform. This replaces the patchwork of separate dashboards and spreadsheets most multi-location companies rely on.
That kind of visibility helped WebFX rebuild the search strategy for Kampgrounds of America (KOA), a brand operating more than 500 locations, growing organic revenue 260% alongside a 198% increase in organic transactions.
Once you can see which locations and brands should scale, fix, test, maintain, or reduce, WebFX’s specialists execute across SEO, PPC, local SEO, content, conversion rate optimization, AI search optimization, and email to act on those decisions channel by channel.
Learn how we increased organic revenue by 260%, and organic transactions by 198% for a multi-location client with over 500 locations.

FAQs about allocating marketing budget across locations and brands
How should you allocate marketing budget across multiple locations?
Evaluate each location using opportunity, performance, capacity, and strategic priority, then decide whether it should receive more investment, optimization resources, test budget, maintenance spend, or reduced investment, rather than splitting the total evenly.
Should every location get the same marketing budget?
Usually not. Locations differ in market demand, competition, customer value, marketing performance, operational capacity, and growth potential, so a shared evaluation framework produces a more defensible allocation than an even split.
How should marketing budget be allocated across brands?
Consider each brand’s market opportunity, customer economics, maturity, current performance, growth runway, and strategic importance, rather than allocating based on current revenue or historical spend alone.
Should every location use the same channel mix?
No. A location with strong organic visibility but weak paid coverage has a different incremental opportunity than a location with strong paid demand but weak organic visibility, so centralized budgeting doesn’t require an identical channel split everywhere.
What data do you need to allocate marketing budget well?
At minimum, you need spend, leads, qualified leads, customers, and revenue by location or brand and by channel. Ideally, you’ll also have customer value, operational capacity, and market demand data, since marketing data alone can’t answer the full allocation question.
How much of your budget should you reserve for testing?
If you allocate 100% of your budget based on historical performance, your newer locations and emerging markets never get enough investment to prove what they can do. Split your budget into three pools instead:
- Core or proven budget: This pool supports established markets, channels, and campaigns with a track record.
- Optimization budget: This pool funds incremental investment in already strong markets, conversion rate optimization, and expansion within proven territory.
- Test budget: This pool funds new locations, new acquisitions, new channels, new services, and new audiences that don’t have enough history yet to compete fairly against mature markets.
WebFX’s own research found that more than 42% of companies dedicate less than 10% of their annual marketing budget to experimental strategies, and 20% dedicate none at all. That’s a common gap, and it means most companies are quietly starving their newest opportunities of the budget they’d need to prove themselves.
Avoid making a brand-new branch or a recent acquisition compete against a ten-year-old location using that location’s own performance benchmarks on day one.
How often should multi-location companies reallocate marketing budgets?
There’s no universal cadence, but you should review allocation often enough to respond to performance changes, seasonality, capacity shifts, new locations, and test results. A quarterly strategic review paired with more frequent channel-level optimization works well for most organizations.
How should marketing budgets change after an acquisition?
Establish what the acquired company’s marketing currently produces before changing anything, then sort investments into what to protect, fix, scale, test, or reduce, rather than immediately equalizing budgets or replacing the acquired company’s approach with the parent company’s playbook.
How should budget allocation work across brands?
Locations mostly introduce differences in market opportunity and capacity. Brands introduce a wider set of differences, including:
- Audience
- Positioning
- Customer economics
- Maturity
- Growth goals
- Competitive position
When considering how to allocate budget across brands, ask yourself:
- Which brand has the best return on ad spend (ROAS)?
- Which brand has the largest growth runway?
- Which has the strongest customer economics?
- Which is strategically important to the business’s future?
- Which has untapped demand?
- Which is mature or closer to saturated?
- Which needs investment to build awareness?
A brand with a lower current return may still deserve investment if it’s the one the company is intentionally building into its future growth engine, rather than the one currently paying the bills.
How should you allocate budget after an acquisition?
Resist the urge to immediately cut inherited spend, equalize the new company’s budget with the rest of the platform, or move everything to the parent company’s preferred channels.
Establish a baseline first, including the acquired company’s current performance, attribution, customer quality, revenue by channel, existing demand, and operational capacity.
Once you have that baseline, sort the acquired company’s marketing investments into five categories: protect, fix, scale, test, and reduce.
The first post-acquisition marketing plan and budget should be informed by what you actually acquired, not simply imposed from the parent company’s existing playbook.
Try our free Marketing Calculator
Craft a tailored online marketing strategy! Utilize our free Internet marketing calculator for a custom plan based on your location, reach, timeframe, and budget.
Ready to build a smarter multi-location marketing budget?
Marketing budget allocation across multiple locations or brands works best when it follows opportunity, performance, capacity, and priority, not an even split or last year’s spreadsheet.
WebFX centralizes your marketing and revenue data through RevenueCloudFX so you can compare locations and brands on equal footing and put your next dollar where it will do the most.
If you’re not sure where to start, we’ll be happy to analyze your current multi-location marketing setup and plan an appropriate budget based on each location’s or brand’s needs. Contact WebFX today to set up a 30-minute discovery call with our specialists.
-
 Thaakirah Abrahams is a Lead Editor at WebFX, where she leverages her 5+ years of experience to craft compelling website content. With a background in Journalism and Media studies and certifications in inbound marketing, she holds a keen eye for detail and a talent for breaking down complex topics for numerous sectors, including the legal and finance industries. When she’s not writing or optimizing content, Thaakirah enjoys the simple pleasures of reading in her garden and spending quality time with her family during game nights. View full profile
 -

WebFX is a full-service digital marketing agency delivering revenue-driving strategies across online advertising, SEO and AI search optimization, and digital marketing. Backed by 1,100+ client reviews, a 4.9-star rating on Clutch, and proprietary revenue-tracking technology, our team helps businesses grow visibility and revenue across platforms, from Google to ChatGPT to LinkedIn. Discover how our expert team and revenue-accelerating tech can drive results for you. Learn more
Try our free Marketing Calculator
Craft a tailored online marketing strategy! Utilize our free Internet marketing calculator for a custom plan based on your location, reach, timeframe, and budget.
Contents
- How to allocate marketing budget across multiple locations and brands
- Core marketing budget allocation strategies for multi-location businesses
- How much should multi-location companies spend on a marketing budget in 2026?
- How WebFX helps multi-location companies make smarter budget decisions
- FAQs about allocating marketing budget across locations and brands
- Ready to build a smarter multi-location marketing budget?
Share this article


Proven Marketing Strategies
Try our free Marketing Calculator
Craft a tailored online marketing strategy! Utilize our free Internet marketing calculator for a custom plan based on your location, reach, timeframe, and budget.
What to read next




FAQs about allocating marketing budget across locations and brands
How should you allocate marketing budget across multiple locations?
Evaluate each location using opportunity, performance, capacity, and strategic priority, then decide whether it should receive more investment, optimization resources, test budget, maintenance spend, or reduced investment, rather than splitting the total evenly.
Should every location get the same marketing budget?
Usually not. Locations differ in market demand, competition, customer value, marketing performance, operational capacity, and growth potential, so a shared evaluation framework produces a more defensible allocation than an even split.
How should marketing budget be allocated across brands?
Consider each brand’s market opportunity, customer economics, maturity, current performance, growth runway, and strategic importance, rather than allocating based on current revenue or historical spend alone.
Should every location use the same channel mix?
No. A location with strong organic visibility but weak paid coverage has a different incremental opportunity than a location with strong paid demand but weak organic visibility, so centralized budgeting doesn’t require an identical channel split everywhere.
What data do you need to allocate marketing budget well?
At minimum, you need spend, leads, qualified leads, customers, and revenue by location or brand and by channel. Ideally, you’ll also have customer value, operational capacity, and market demand data, since marketing data alone can’t answer the full allocation question.
How much of your budget should you reserve for testing?
If you allocate 100% of your budget based on historical performance, your newer locations and emerging markets never get enough investment to prove what they can do. Split your budget into three pools instead:
- Core or proven budget: This pool supports established markets, channels, and campaigns with a track record.
- Optimization budget: This pool funds incremental investment in already strong markets, conversion rate optimization, and expansion within proven territory.
- Test budget: This pool funds new locations, new acquisitions, new channels, new services, and new audiences that don’t have enough history yet to compete fairly against mature markets.
WebFX’s own research found that more than 42% of companies dedicate less than 10% of their annual marketing budget to experimental strategies, and 20% dedicate none at all. That’s a common gap, and it means most companies are quietly starving their newest opportunities of the budget they’d need to prove themselves.
Avoid making a brand-new branch or a recent acquisition compete against a ten-year-old location using that location’s own performance benchmarks on day one.
How often should multi-location companies reallocate marketing budgets?
There’s no universal cadence, but you should review allocation often enough to respond to performance changes, seasonality, capacity shifts, new locations, and test results. A quarterly strategic review paired with more frequent channel-level optimization works well for most organizations.
How should marketing budgets change after an acquisition?
Establish what the acquired company’s marketing currently produces before changing anything, then sort investments into what to protect, fix, scale, test, or reduce, rather than immediately equalizing budgets or replacing the acquired company’s approach with the parent company’s playbook.
How should budget allocation work across brands?
Locations mostly introduce differences in market opportunity and capacity. Brands introduce a wider set of differences, including:
- Audience
- Positioning
- Customer economics
- Maturity
- Growth goals
- Competitive position
When considering how to allocate budget across brands, ask yourself:
- Which brand has the best return on ad spend (ROAS)?
- Which brand has the largest growth runway?
- Which has the strongest customer economics?
- Which is strategically important to the business’s future?
- Which has untapped demand?
- Which is mature or closer to saturated?
- Which needs investment to build awareness?
A brand with a lower current return may still deserve investment if it’s the one the company is intentionally building into its future growth engine, rather than the one currently paying the bills.
How should you allocate budget after an acquisition?
Resist the urge to immediately cut inherited spend, equalize the new company’s budget with the rest of the platform, or move everything to the parent company’s preferred channels.
Establish a baseline first, including the acquired company’s current performance, attribution, customer quality, revenue by channel, existing demand, and operational capacity.
Once you have that baseline, sort the acquired company’s marketing investments into five categories: protect, fix, scale, test, and reduce.
The first post-acquisition marketing plan and budget should be informed by what you actually acquired, not simply imposed from the parent company’s existing playbook.