Skip to main content ↓
Coins stacked up on a blue desk

2025 Marketing Budget Planning & Allocation [Research Data]

notes icon

Quick Stats: 2025 Marketing Budget Trends

  • 70% of business leaders will spend the same amount or more on marketing in 2025.
  • 54% of business leaders will spend $1,000-$10,000 per month on marketing. 
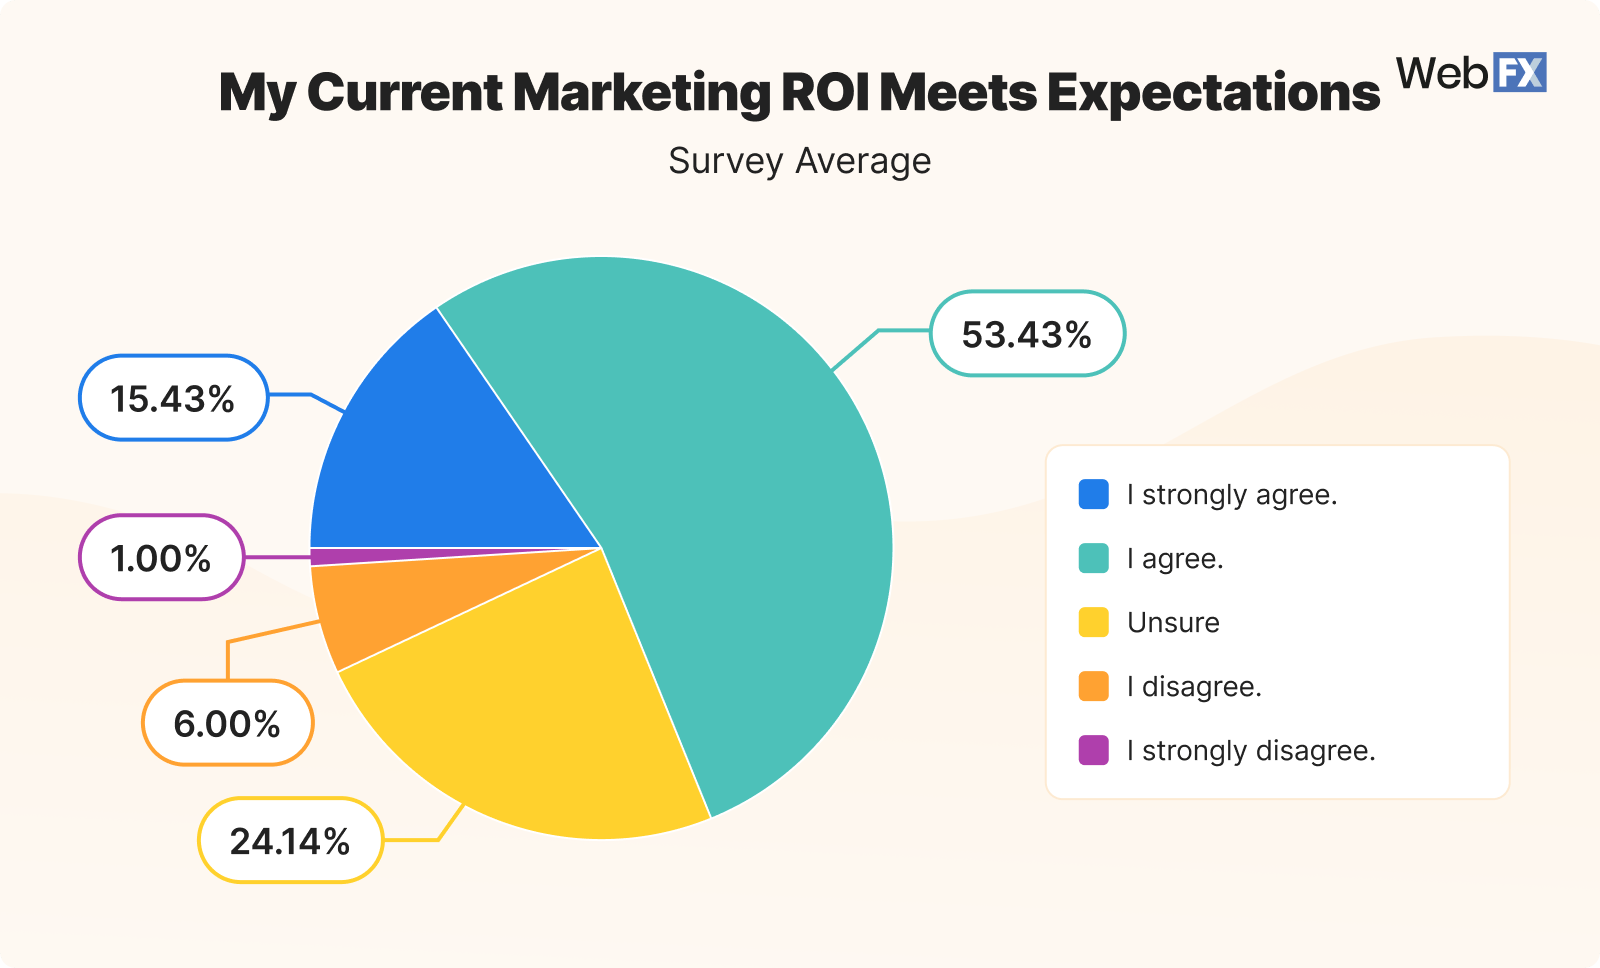
  • 53% of business leaders agree that their ROI meets their expectations.
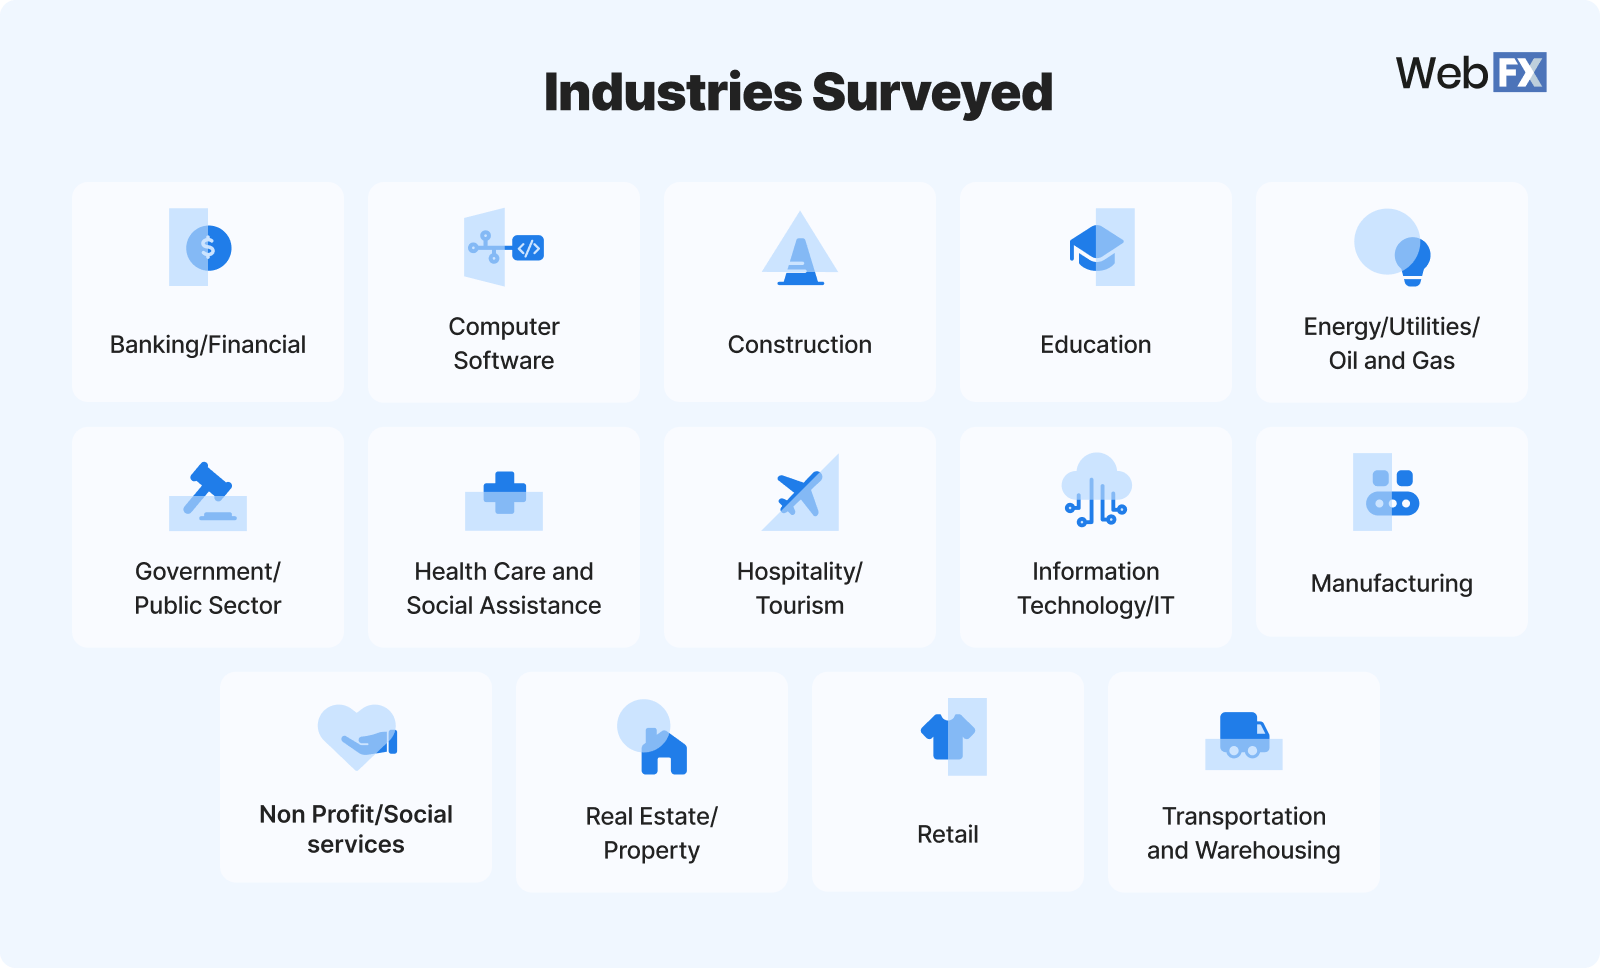
Whether you’re reviewing your quarterly budget or preparing for a new year — examining the current market and industry budget trends can help you make the smartest investments. Marketing budgets usually range from 5-15%, but that number depends on a series of factors and influences.

We surveyed 700 business leaders from over 12 industries to learn how and where they plan to invest their marketing budgets this year for the highest ROI. This data will help you allocate your marketing budget toward the right strategies.

Keep reading to learn more about how to allocate your marketing budget in 2025: 

How much will companies spend on marketing in 2025

15 industries surveyed 1 1

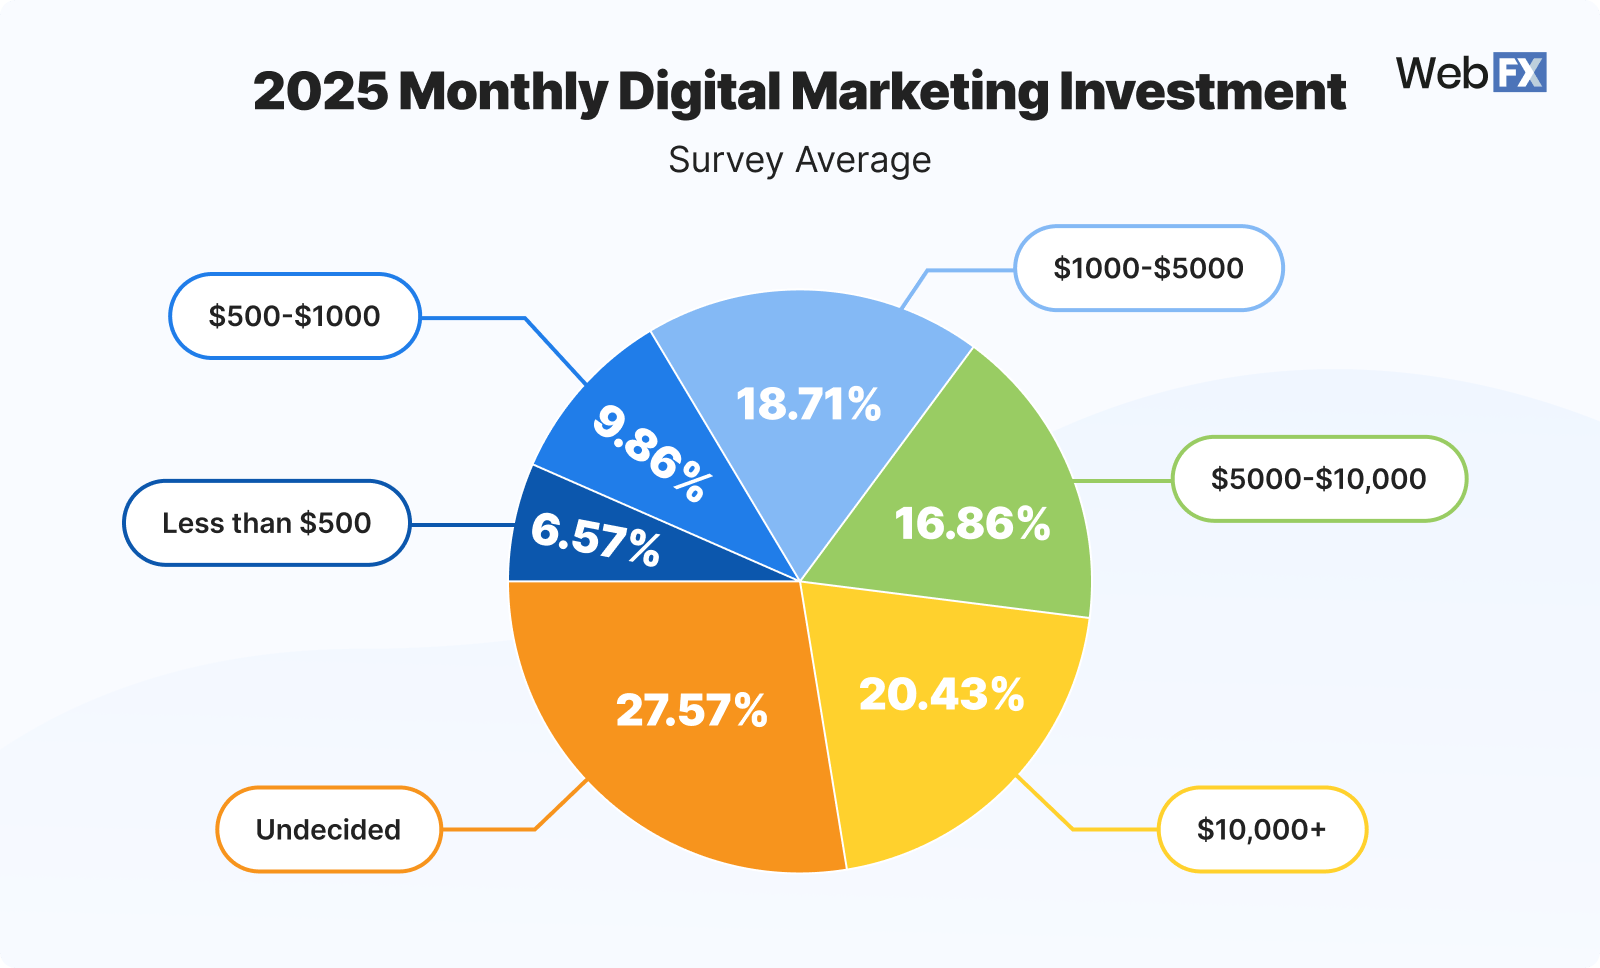
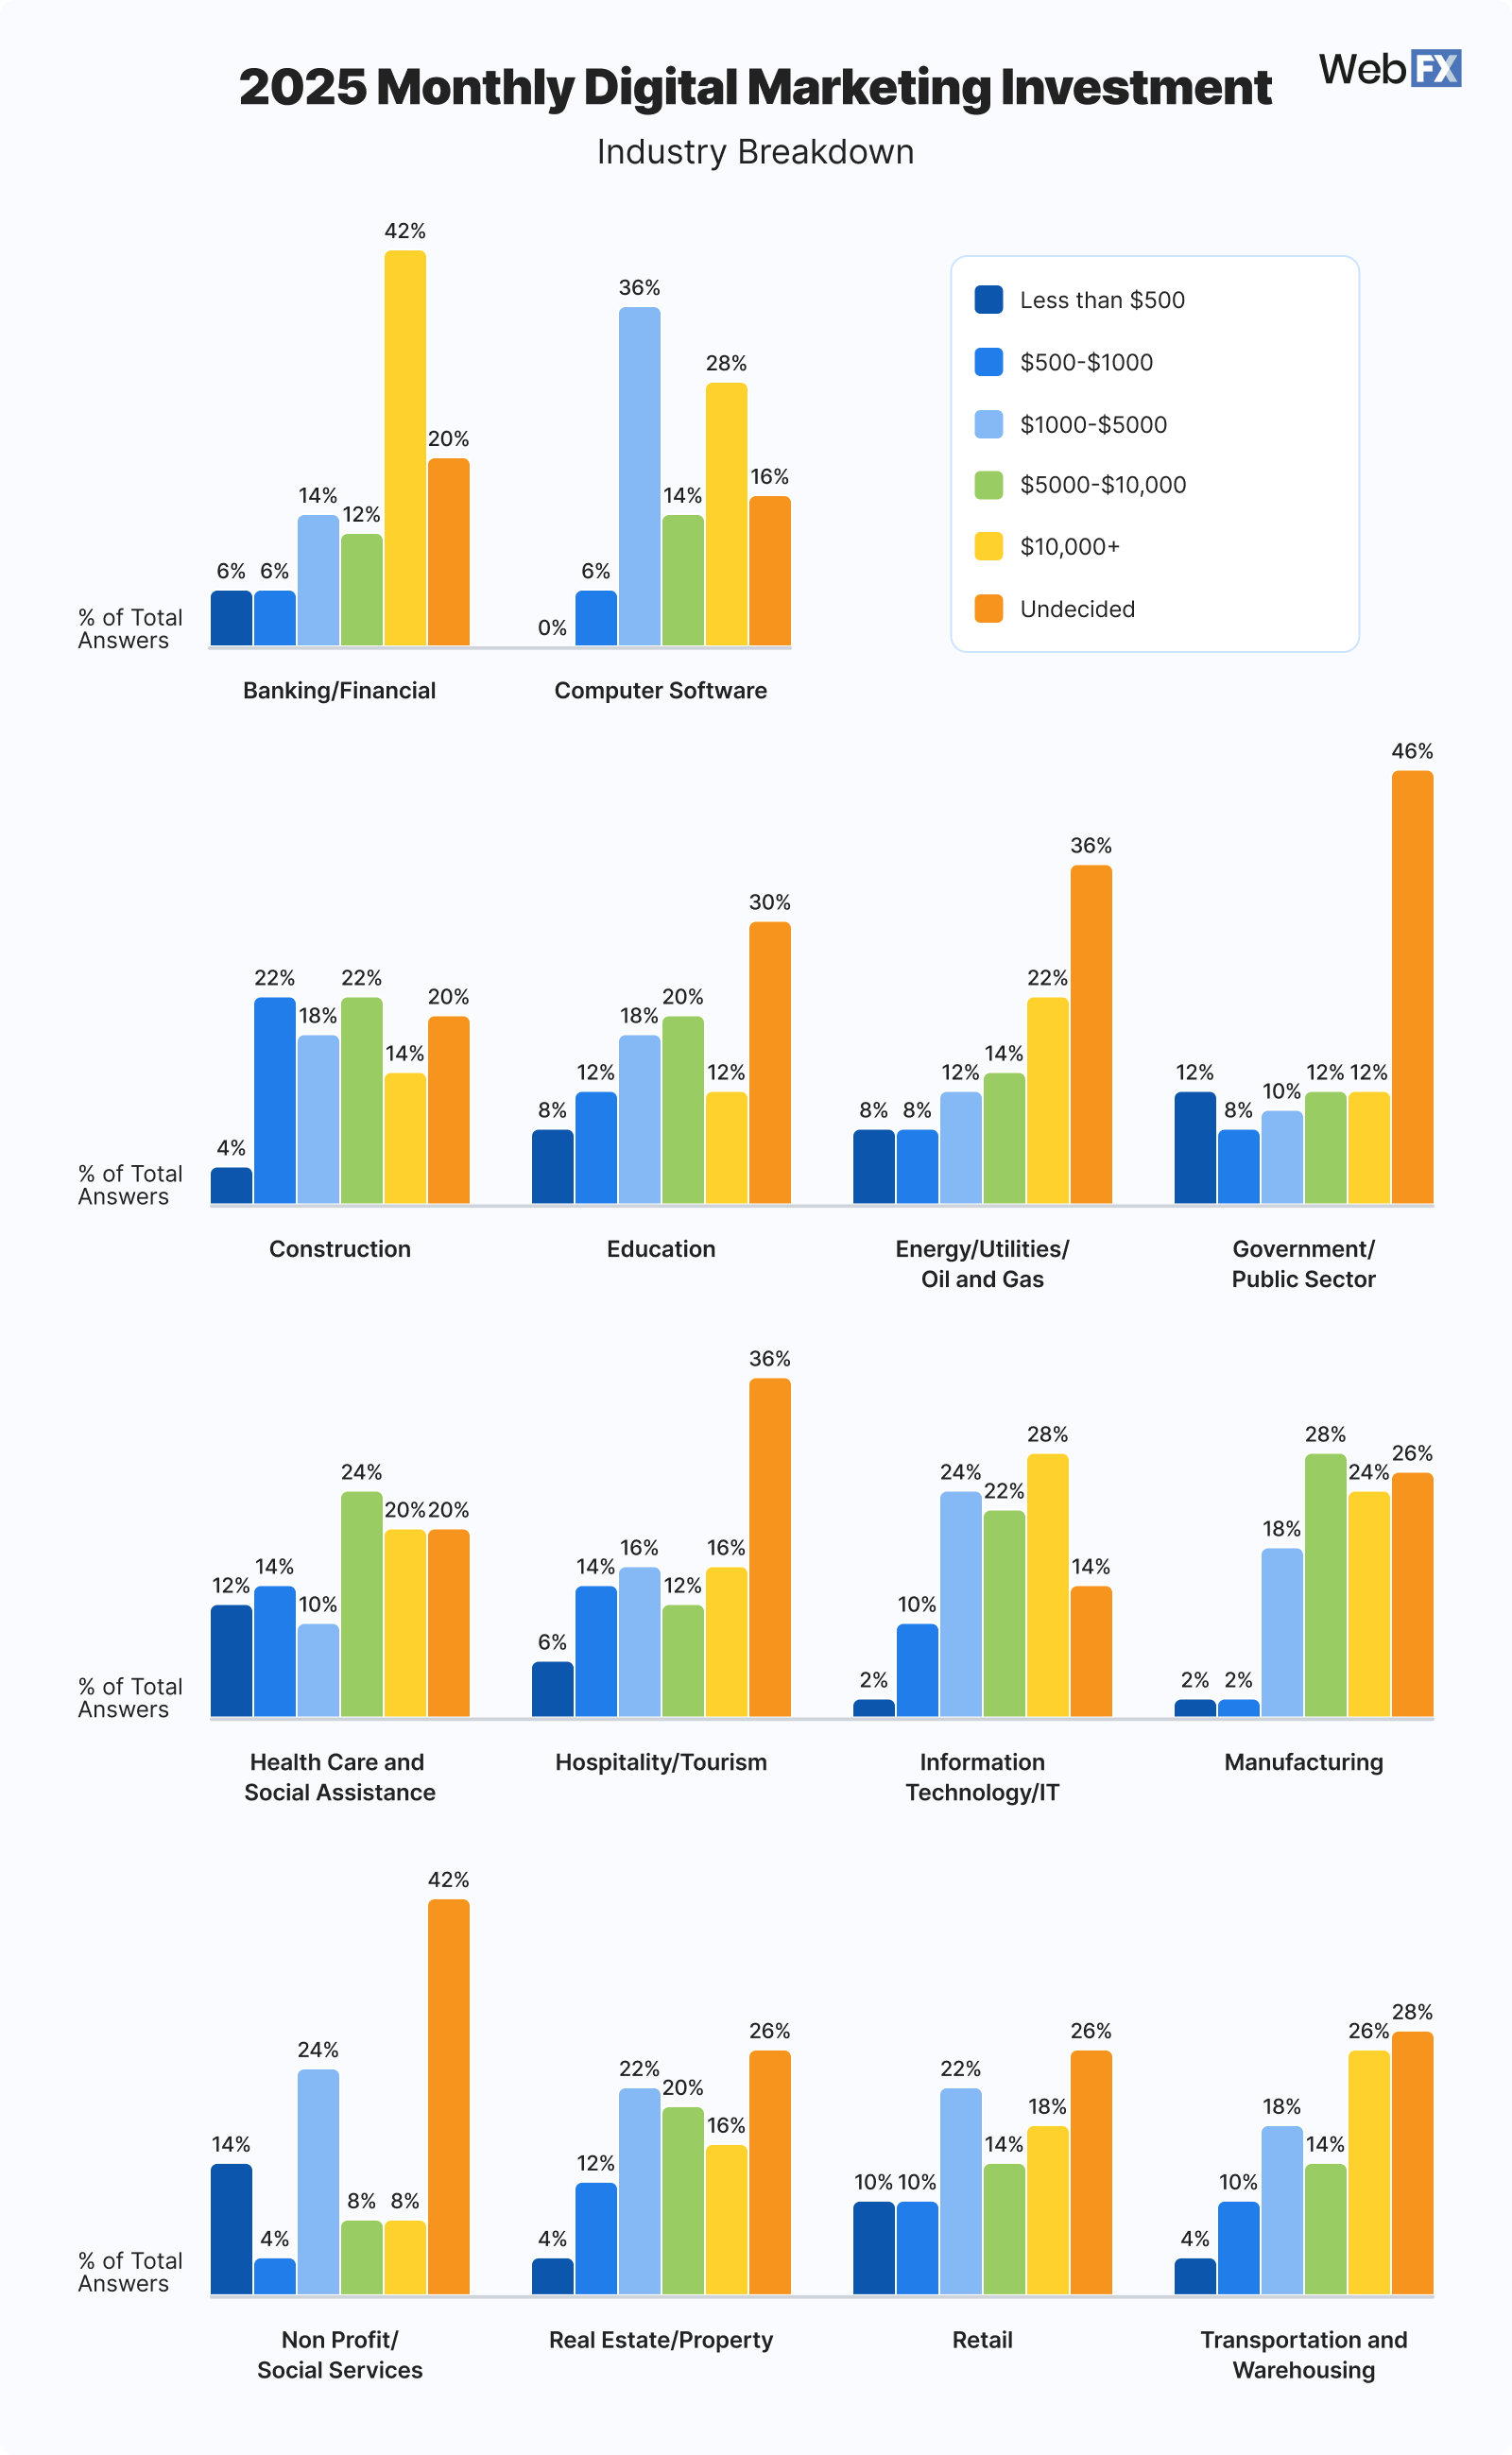
1. 2025 monthly marketing budget

When asked how much respondents were planning to spend in 2025, this is how they responded: 

1 2025 Monthly Digital Marketing Investment

What does this mean for me?

Based on the data above, the average marketing spend ranges for small to mid-size businesses (SMBs) are: 

  1. $10,000+ (20.43%)
  2. $1000-$5000 (18.71%) 
  3. $5000-$10,000 (16.86%)

So, what does this mean for you? Here are the main trends to take away from these results:

  • Shift toward higher budgets: Compared to last year’s digital marketing investment, the percentage of people spending more is growing, and the percentage of companies spending <$500/month is getting smaller (from 23.2% to 6.57%).
  • Inflation and raised marketing costs: Between inflation and rising costs around the world, the emerging trend could simply be that rising prices lead to higher investments. It also shows that smaller budgets are simply not as effective as they once were.
  • Mature marketing strategies: Companies are moving away from single-channel marketing strategies (which cost less) and investing in more mature, complex marketing strategies to grow their business.
  • Mid-range investment stability: The $1,000-$5,000 range shows a strong middle ground, representing companies who prioritize digital marketing but don’t have the funds to reach the top spend level. Companies are finding balance between impact and cost-effectiveness.

View Source Data

2025 Monthly Digital Marketing Investment % of Total Answers
Less than $500 6.57%
$500-$1000 9.86%
$1000-$5000 18.71%
$5000-$10,000 16.86%
$10,000+ 20.43%
Undecided 27.57%

View Industry Data

1 Industry 2025 Monthly Digital Marketing Investment

Banking/Financial

2025 Digital Marketing Investment % of Answers
Less than $500 6.00%
$500-$1000 6.00%
$1000-$5000 14.00%
$5000-$10,000 12.00%
$10,000+ 42.00%
Undecided 20.00%

Computer Software

2025 Digital Marketing Investment % of Answers
Less than $500 0.00%
$500-$1000 6.00%
$1000-$5000 36.00%
$5000-$10,000 14.00%
$10,000+ 28.00%
Undecided 16.00%

Construction

2025 Digital Marketing Investment % of Answers
Less than $500 4.00%
$500-$1000 22.00%
$1000-$5000 18.00%
$5000-$10,000 22.00%
$10,000+ 14.00%
Undecided 20.00%

Education

2025 Digital Marketing Investment % of Answers
Less than $500 8.00%
$500-$1000 12.00%
$1000-$5000 18.00%
$5000-$10,000 20.00%
$10,000+ 12.00%
Undecided 30.00%

Energy/Utilities/Oil and Gas

2025 Digital Marketing Investment % of Answers
Less than $500 8.00%
$500-$1000 8.00%
$1000-$5000 12.00%
$5000-$10,000 14.00%
$10,000+ 22.00%
Undecided 36.00%

Government/Public Sector

2025 Digital Marketing Investment % of Answers
Less than $500 12.00%
$500-$1000 8.00%
$1000-$5000 10.00%
$5000-$10,000 12.00%
$10,000+ 12.00%
Undecided 46.00%

Health Care and Social Assistance

2025 Digital Marketing Investment % of Answers
Less than $500 12.00%
$500-$1000 14.00%
$1000-$5000 10.00%
$5000-$10,000 24.00%
$10,000+ 20.00%
Undecided 20.00%

Hospitality/Tourism

2025 Digital Marketing Investment % of Answers
Less than $500 6.00%
$500-$1000 14.00%
$1000-$5000 16.00%
$5000-$10,000 12.00%
$10,000+ 16.00%
Undecided 36.00%

Information Technology/IT

2025 Digital Marketing Investment % of Answers
Less than $500 2.00%
$500-$1000 10.00%
$1000-$5000 24.00%
$5000-$10,000 22.00%
$10,000+ 28.00%
Undecided 14.00%

Manufacturing

2025 Digital Marketing Investment % of Answers
Less than $500 2.00%
$500-$1000 2.00%
$1000-$5000 18.00%
$5000-$10,000 28.00%
$10,000+ 24.00%
Undecided 26.00%

Non Profit/Social services

2025 Digital Marketing Investment % of Answers
Less than $500 14.00%
$500-$1000 4.00%
$1000-$5000 24.00%
$5000-$10,000 8.00%
$10,000+ 8.00%
Undecided 42.00%

Real Estate/Property

2025 Digital Marketing Investment % of Answers
Less than $500 4.00%
$500-$1000 12.00%
$1000-$5000 22.00%
$5000-$10,000 20.00%
$10,000+ 16.00%
Undecided 26.00%

Retail

2025 Digital Marketing Investment % of Answers
Less than $500 10.00%
$500-$1000 10.00%
$1000-$5000 22.00%
$5000-$10,000 14.00%
$10,000+ 18.00%
Undecided 26.00%

Transportation and Warehousing

2025 Digital Marketing Investment % of Answers
Less than $500 4.00%
$500-$1000 10.00%
$1000-$5000 18.00%
$5000-$10,000 14.00%
$10,000+ 26.00%
Undecided 28.00%
notes icon

Industry Budget Trends

Industries with the highest reported spend:


Industries with the lowest reported spend:

  • Non-profit/social services
  • Government/Public sector 
  • Retail

2. Marketing investment trend (2025 vs. 2024)

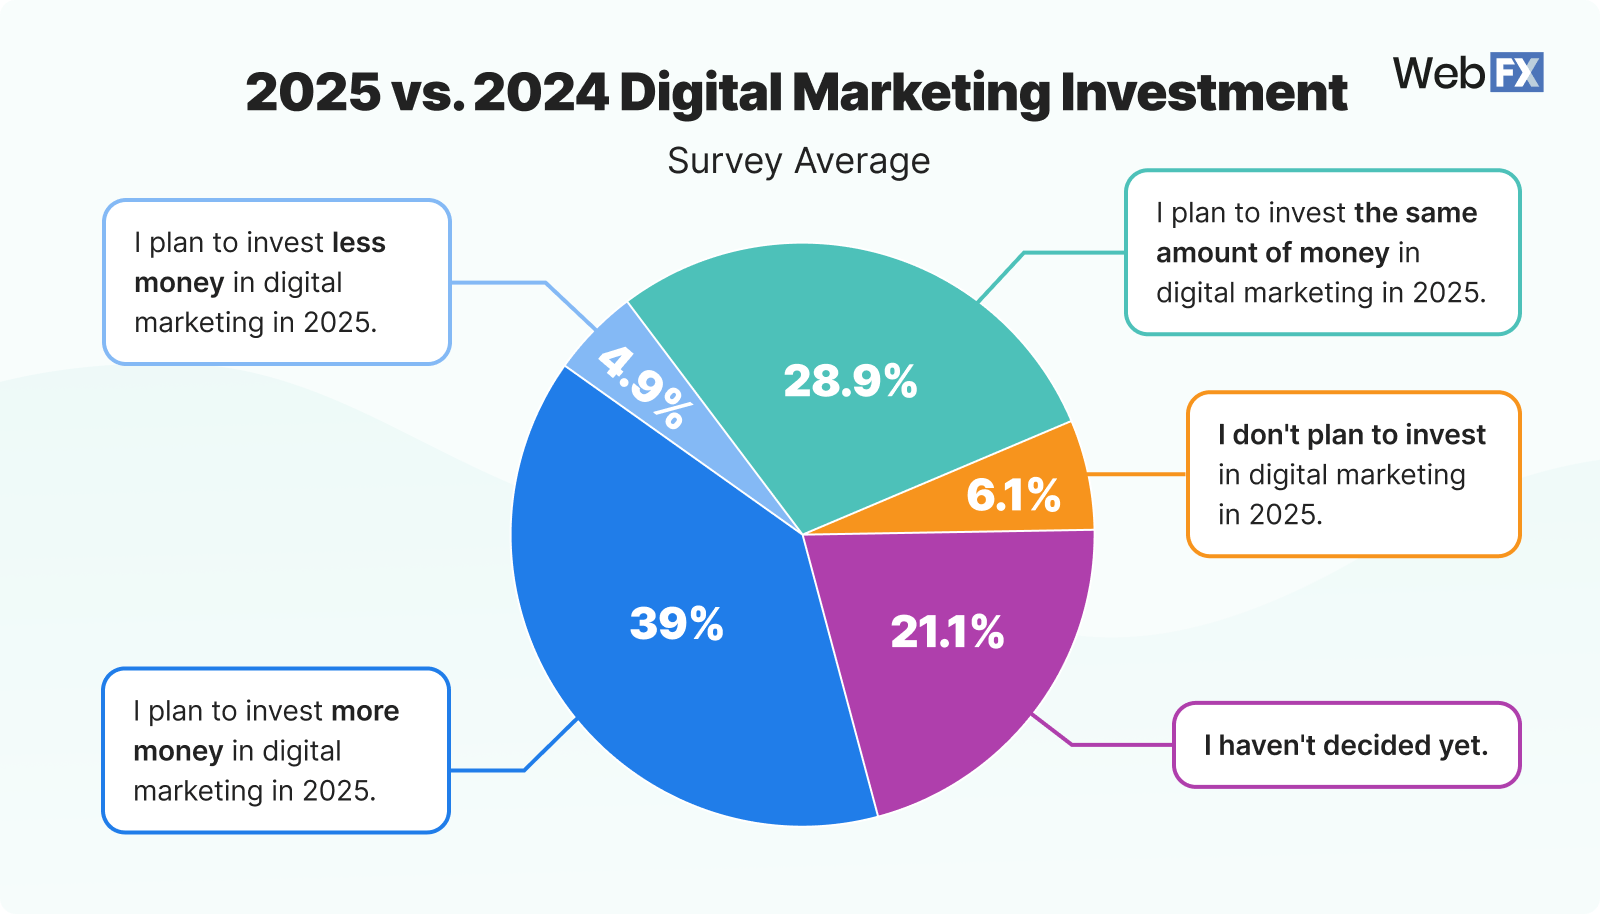
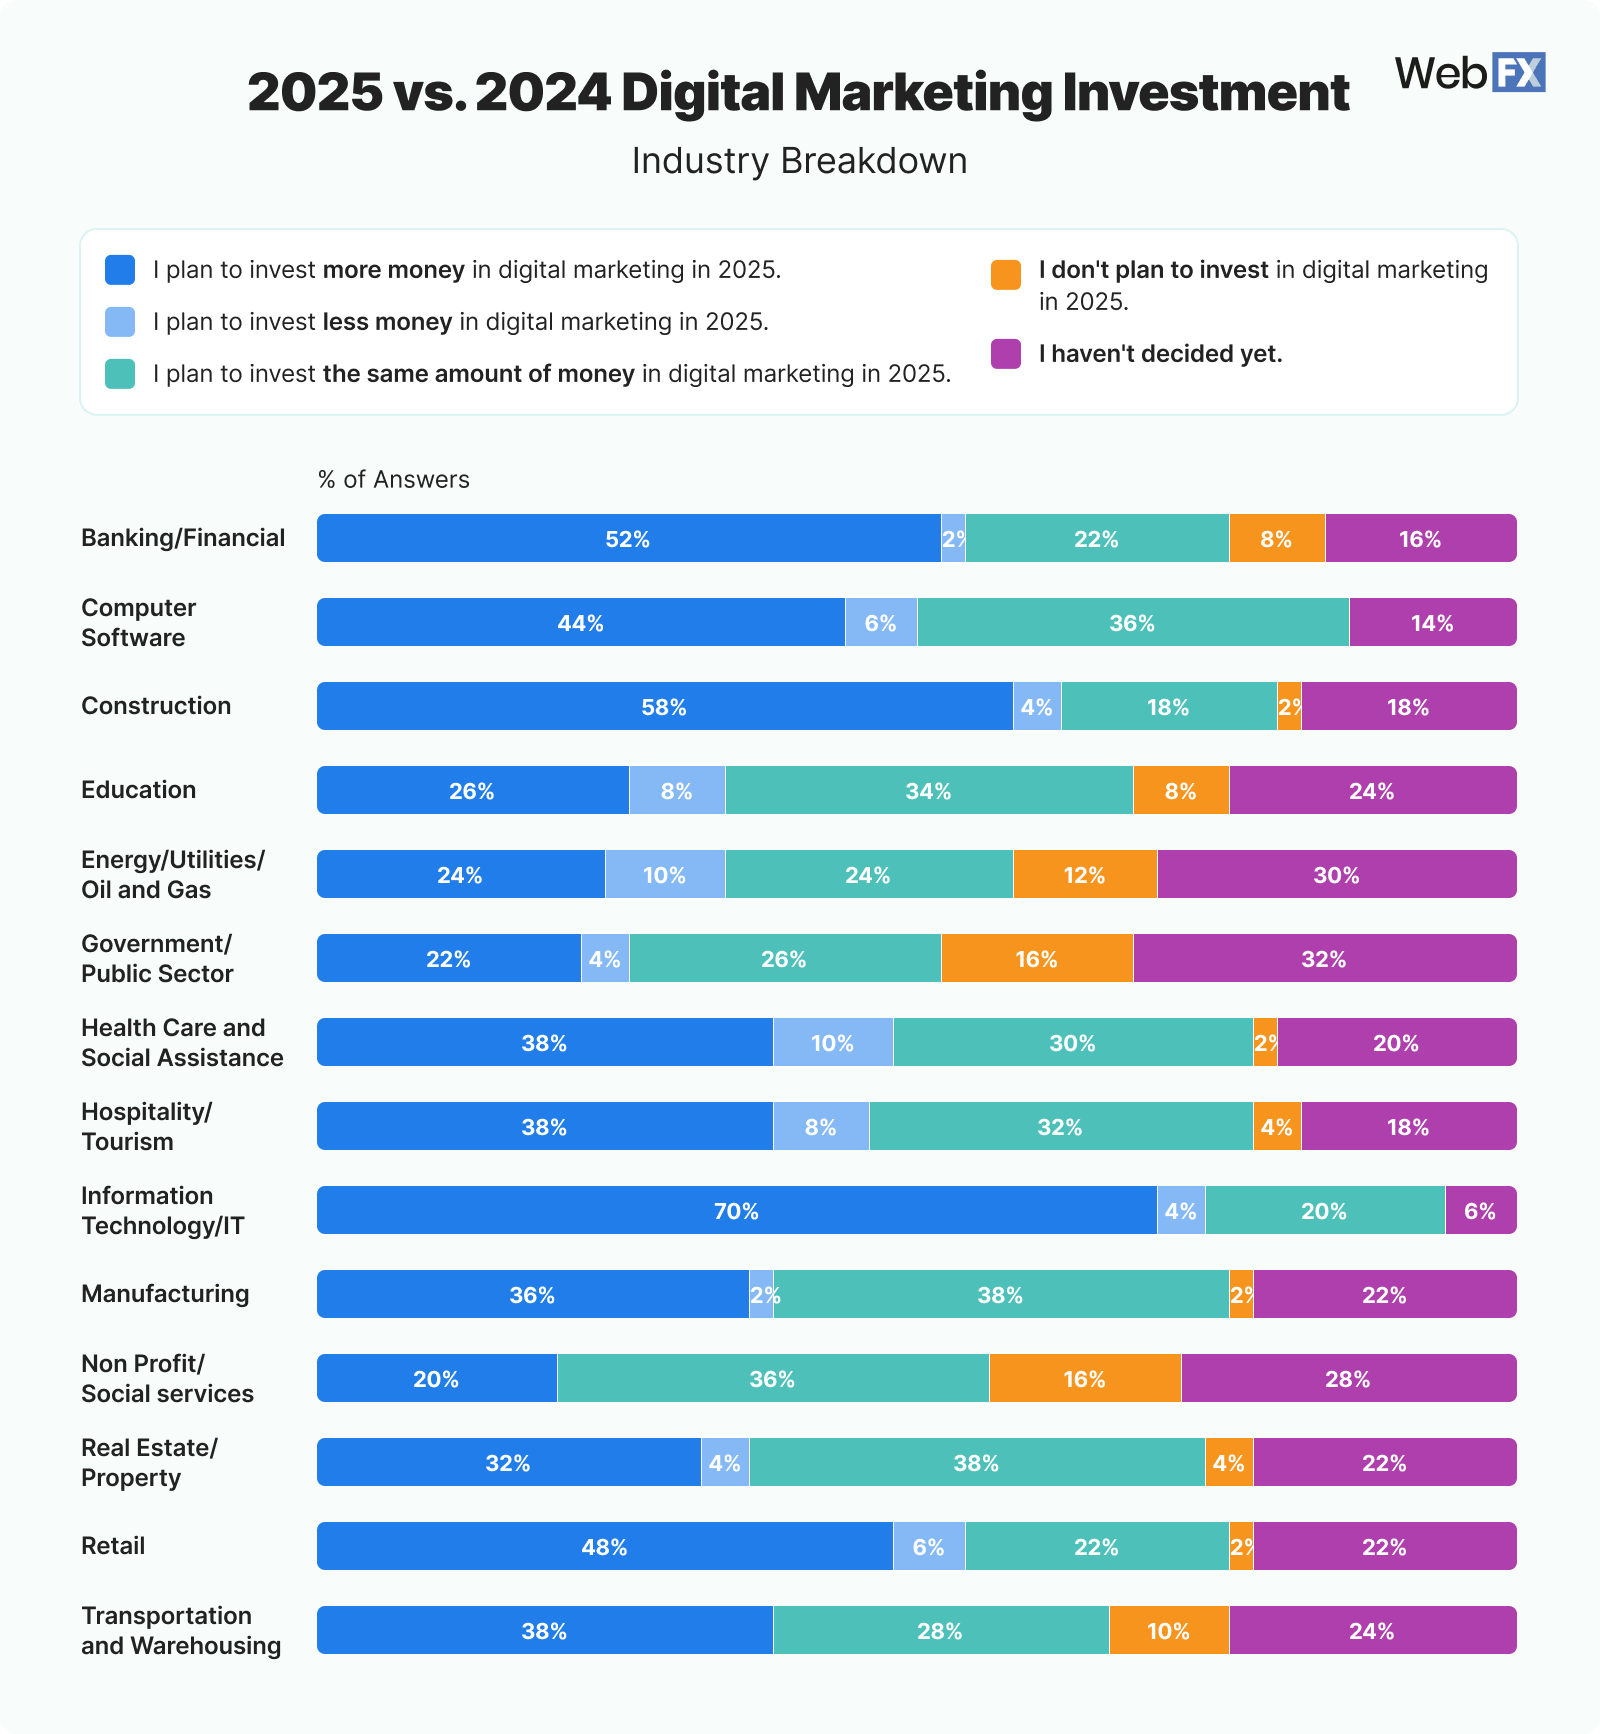
Next, we asked how much they plan to invest in digital marketing in 2025 compared to what they invested in 2024.

2 2025 vs 2024 Digital Marketing Investment

What does this mean for me?

The continued investment in digital marketing shows a confidence in digital marketing’s returns and stability. As more consumers become reliant on digital channels for decision-making, companies will invest more in advertising and marketing on those channels. 

There is also a plateau effect happening, which shows more of a “wait-and-see” attitude toward digital marketing in 2025. This effect could reflect negatively on experimentation and represent a more reserved approach to digital marketing. These companies are seeing positive returns on their marketing, but they delay decisions based on economic factors or their lack of updated technology.

Those who aren’t investing more or are undecided likely have lacking tools and resources for measuring the ROI of digital marketing, which can blur the benefits of digital marketing that other companies experience. Without the proper data, they choose to play it safe, which ultimately puts them behind other companies who are investing, creating a bigger gap between their investment and their possible returns.

View Source Data

2025 vs. 2024 Digital Marketing Investment % of Answers
I plan to invest more money in digital marketing in 2025. 39.00%
I plan to invest less money in digital marketing in 2025. 4.86%
I plan to invest the same amount of money in digital marketing in 2025. 28.86%
I don’t plan to invest in digital marketing in 2025. 6.14%
I haven’t decided yet. 21.14%

View Industry Data

2 Industry 2025 vs 2024 Digital Marketing Investment

Banking/Financial

2025 vs. 2024 Digital Marketing Investment % of Answers
I plan to invest more money in digital marketing in 2025. 52.00%
I plan to invest less money in digital marketing in 2025. 2.00%
I plan to invest the same amount of money in digital marketing in 2025. 22.00%
I don’t plan to invest in digital marketing in 2025. 8.00%
I haven’t decided yet. 16.00%

Computer Software

2025 vs. 2024 Digital Marketing Investment % of Answers
I plan to invest more money in digital marketing in 2025. 44.00%
I plan to invest less money in digital marketing in 2025. 6.00%
I plan to invest the same amount of money in digital marketing in 2025. 36.00%
I don’t plan to invest in digital marketing in 2025. 0.00%
I haven’t decided yet. 14.00%

Construction

2025 vs. 2024 Digital Marketing Investment % of Answers
I plan to invest more money in digital marketing in 2025. 58.00%
I plan to invest less money in digital marketing in 2025. 4.00%
I plan to invest the same amount of money in digital marketing in 2025. 18.00%
I don’t plan to invest in digital marketing in 2025. 2.00%
I haven’t decided yet. 18.00%

Education

2025 vs. 2024 Digital Marketing Investment % of Answers
I plan to invest more money in digital marketing in 2025. 26.00%
I plan to invest less money in digital marketing in 2025. 8.00%
I plan to invest the same amount of money in digital marketing in 2025. 34.00%
I don’t plan to invest in digital marketing in 2025. 8.00%
I haven’t decided yet. 24.00%

Energy/Utilities/Oil and Gas

2025 vs. 2024 Digital Marketing Investment % of Answers
I plan to invest more money in digital marketing in 2025. 24.00%
I plan to invest less money in digital marketing in 2025. 10.00%
I plan to invest the same amount of money in digital marketing in 2025. 24.00%
I don’t plan to invest in digital marketing in 2025. 12.00%
I haven’t decided yet. 30.00%

Government/Public Sector

2025 vs. 2024 Digital Marketing Investment % of Answers
I plan to invest more money in digital marketing in 2025. 22.00%
I plan to invest less money in digital marketing in 2025. 4.00%
I plan to invest the same amount of money in digital marketing in 2025. 26.00%
I don’t plan to invest in digital marketing in 2025. 16.00%
I haven’t decided yet. 32.00%

Health Care and Social Assistance

2025 vs. 2024 Digital Marketing Investment % of Answers
I plan to invest more money in digital marketing in 2025. 38.00%
I plan to invest less money in digital marketing in 2025. 10.00%
I plan to invest the same amount of money in digital marketing in 2025. 30.00%
I don’t plan to invest in digital marketing in 2025. 2.00%
I haven’t decided yet. 20.00%

Hospitality/Tourism

2025 vs. 2024 Digital Marketing Investment % of Answers
I plan to invest more money in digital marketing in 2025. 38.00%
I plan to invest less money in digital marketing in 2025. 8.00%
I plan to invest the same amount of money in digital marketing in 2025. 32.00%
I don’t plan to invest in digital marketing in 2025. 4.00%
I haven’t decided yet. 18.00%

Information Technology/IT

2025 vs. 2024 Digital Marketing Investment % of Answers
I plan to invest more money in digital marketing in 2025. 70.00%
I plan to invest less money in digital marketing in 2025. 4.00%
I plan to invest the same amount of money in digital marketing in 2025. 20.00%
I don’t plan to invest in digital marketing in 2025. 0.00%
I haven’t decided yet. 6.00%

Manufacturing

2025 vs. 2024 Digital Marketing Investment % of Answers
I plan to invest more money in digital marketing in 2025. 36.00%
I plan to invest less money in digital marketing in 2025. 2.00%
I plan to invest the same amount of money in digital marketing in 2025. 38.00%
I don’t plan to invest in digital marketing in 2025. 2.00%
I haven’t decided yet. 22.00%

Non Profit/Social services

2025 vs. 2024 Digital Marketing Investment % of Answers
I plan to invest more money in digital marketing in 2025. 20.00%
I plan to invest less money in digital marketing in 2025. 0.00%
I plan to invest the same amount of money in digital marketing in 2025. 36.00%
I don’t plan to invest in digital marketing in 2025. 16.00%
I haven’t decided yet. 28.00%

Real Estate/Property

2025 vs. 2024 Digital Marketing Investment % of Answers
I plan to invest more money in digital marketing in 2025. 32.00%
I plan to invest less money in digital marketing in 2025. 4.00%
I plan to invest the same amount of money in digital marketing in 2025. 38.00%
I don’t plan to invest in digital marketing in 2025. 4.00%
I haven’t decided yet. 22.00%

Retail

2025 vs. 2024 Digital Marketing Investment % of Answers
I plan to invest more money in digital marketing in 2025. 48.00%
I plan to invest less money in digital marketing in 2025. 6.00%
I plan to invest the same amount of money in digital marketing in 2025. 22.00%
I don’t plan to invest in digital marketing in 2025. 2.00%
I haven’t decided yet. 22.00%

Transportation and Warehousing

2025 vs. 2024 Digital Marketing Investment % of Answers
I plan to invest more money in digital marketing in 2025. 38.00%
I plan to invest less money in digital marketing in 2025. 0.00%
I plan to invest the same amount of money in digital marketing in 2025. 28.00%
I don’t plan to invest in digital marketing in 2025. 10.00%
I haven’t decided yet. 24.00%


notes icon

Industry Budget Trends

Industries expanding marketing budgets the most in 2025:

  • Information Technology/IT 
  • Construction
  • Banking/Financial  

Industries maintaining marketing budgets the most in 2025:

3. Factors impacting digital marketing investment

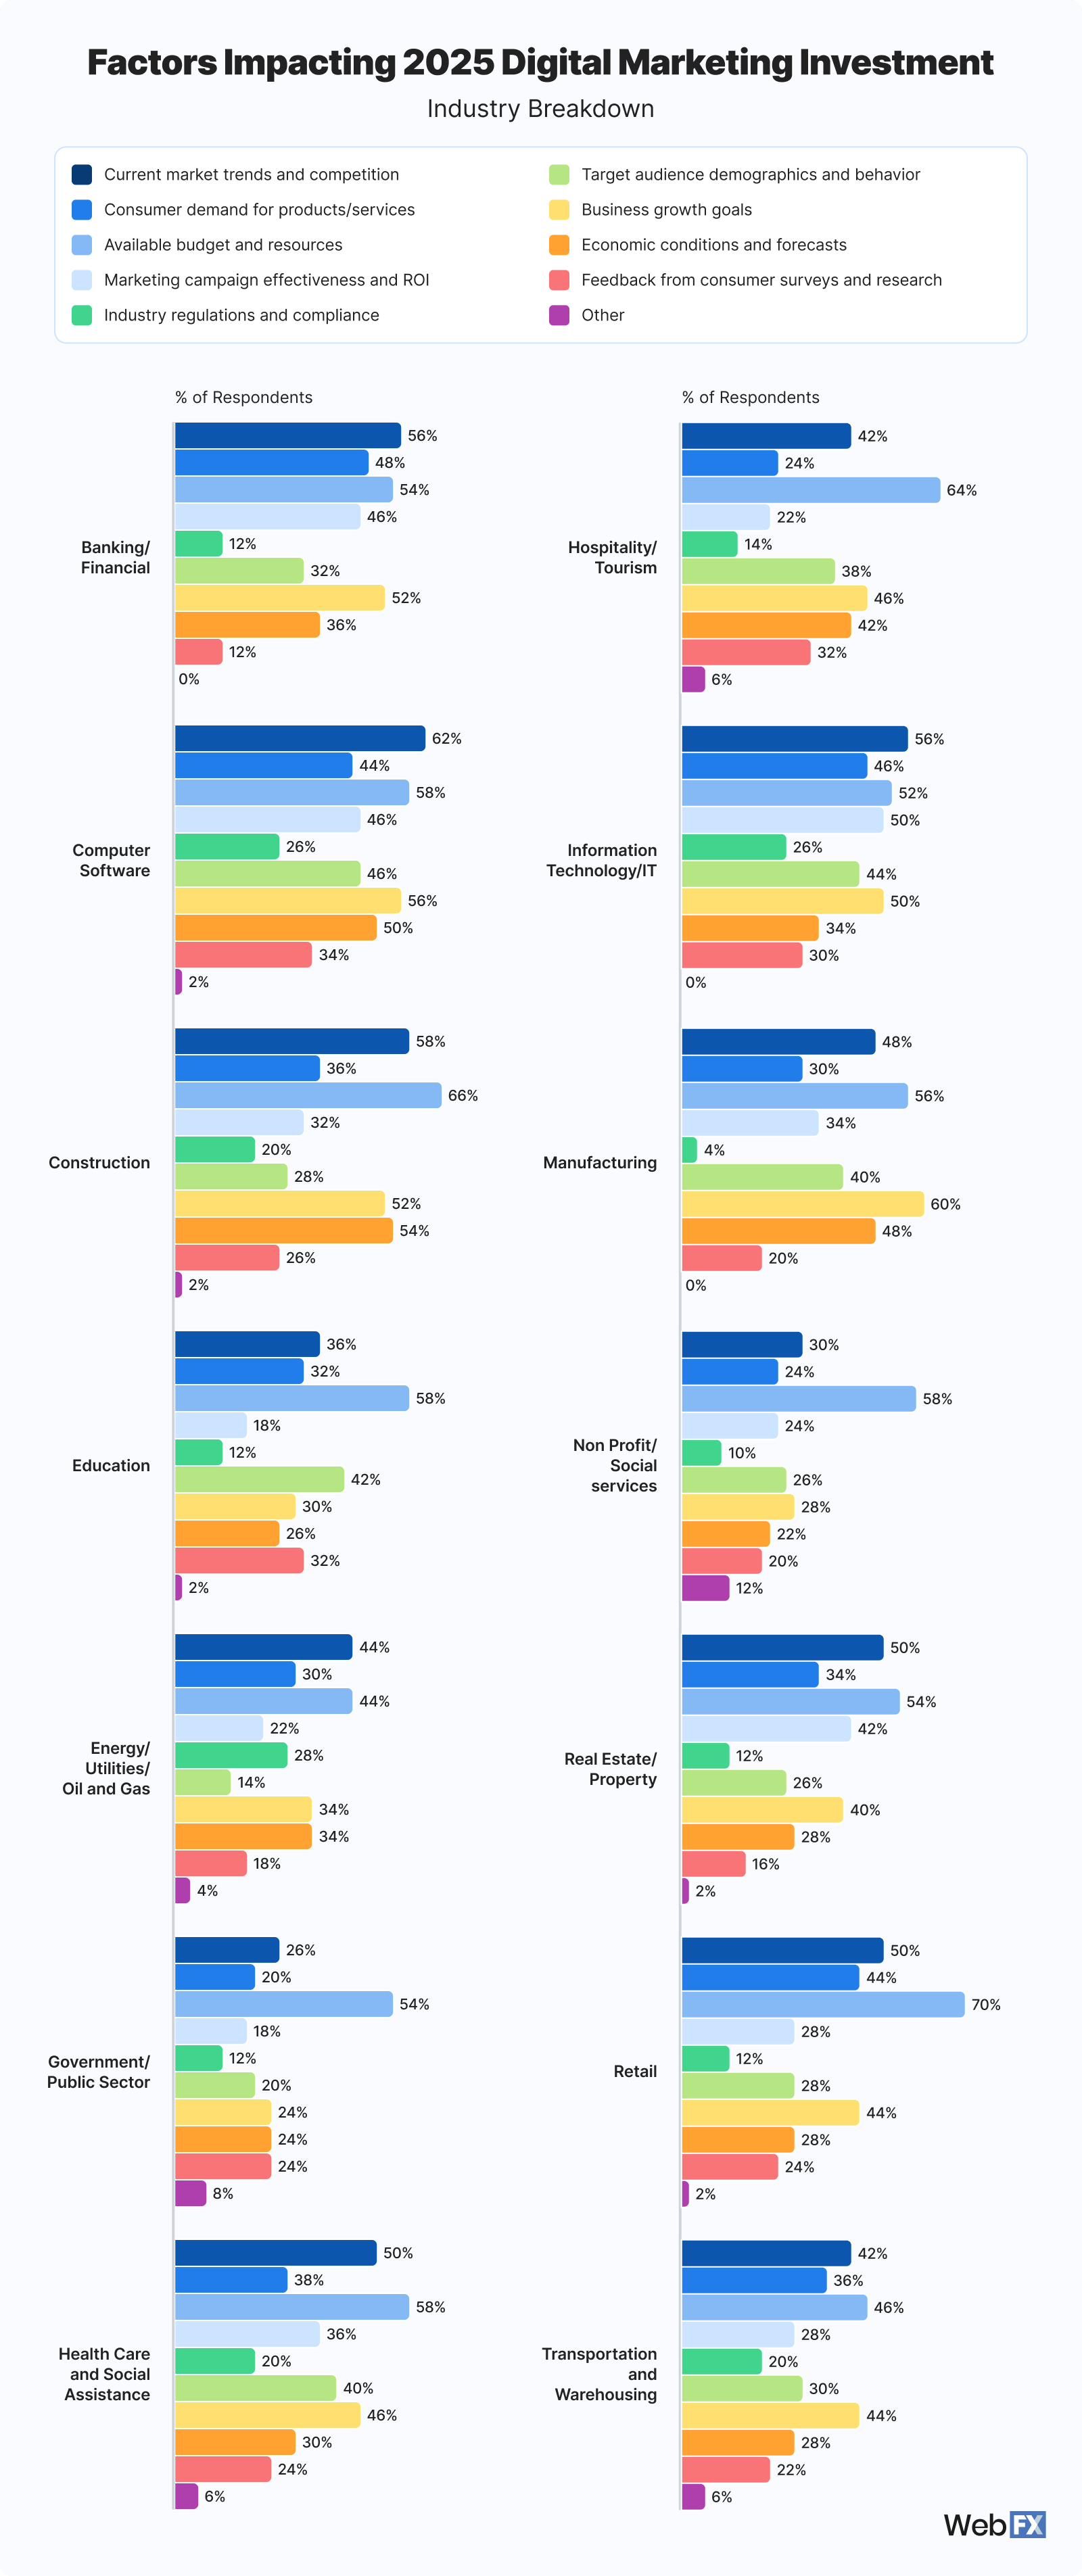
We wanted to understand what factors were most important to respondents as they built out their marketing investments. When asked, the top three factors were:

  1. Budget and resources
  2. Market trends and competition
  3. Business growth goals

See the complete breakdown below:

13 Factors Impacting Digital Marketing Provider Choice

What does this mean for me?

While budgets are increasing from this year to next, companies are still limited to what they can spend. Businesses are choosing proven strategies rather than experimenting with new marketing technologies or platforms. To help balance their investments, business strategies will likely target high-ROI channels like SEO, PPC, and email marketing, rather than risky or unfamiliar ventures. Companies are investing in what they know works for their business, rather than jumping into a whole new approach to marketing to maybe achieve growth.

Market factors are also playing their role in investments. Companies are monitoring their competitors and responding to new industry trends to avoid losing their market share. For example, companies face an increased focus on keeping pace with competitors while adopting new technologies like AI, automation, and omnichannel strategies. Investing in these strategies takes resources, and your available budget will dictate what you are able to spend to alleviate this pressure. 

Companies are considering their internal processes and competition to find the right amount to invest in marketing. To make the smartest investments, you should evaluate current and past strategies and prioritize channels that bring results. If you have room in your budget to experiment, you should, as it will definitely help you stand out from other companies who don’t have the ability or desire to do so.

View Source Data

Factors Impacting 2025 Digital Marketing Investment % of Respondents
Available budget and resources 56.57%
Current market trends and competition 46.43%
Business growth goals 43.29%
Consumer demand for products/services 34.71%
Economic conditions and forecasts 34.57%
Target audience demographics and behavior 32.43%
Marketing campaign effectiveness and ROI 31.86%
Feedback from consumer surveys 23.86%
Industry regulations and compliance 16.29%
Other 3.71%


View Industry Data

3 Industry Factors Impacting 2025 Digital Marketing Investment

Banking/Financial

Factors Impacting 2025 Digital Marketing Investment % of Respondents
Current market trends and competition 56.00%
Consumer demand for products/services 48.00%
Available budget and resources 54.00%
Marketing campaign effectiveness and ROI 46.00%
Industry regulations and compliance 12.00%
Target audience demographics and behavior 32.00%
Business growth goals 52.00%
Economic conditions and forecasts 36.00%
Feedback from consumer surveys and research 12.00%
Other 0.00%

Computer Software

Factors Impacting 2025 Digital Marketing Investment % of Respondents
Current market trends and competition 62.00%
Consumer demand for products/services 44.00%
Available budget and resources 58.00%
Marketing campaign effectiveness and ROI 46.00%
Industry regulations and compliance 26.00%
Target audience demographics and behavior 46.00%
Business growth goals 56.00%
Economic conditions and forecasts 50.00%
Feedback from consumer surveys and research 34.00%
Other 2.00%

Construction

Factors Impacting 2025 Digital Marketing Investment % of Respondents
Current market trends and competition 58.00%
Consumer demand for products/services 36.00%
Available budget and resources 66.00%
Marketing campaign effectiveness and ROI 32.00%
Industry regulations and compliance 20.00%
Target audience demographics and behavior 28.00%
Business growth goals 52.00%
Economic conditions and forecasts 54.00%
Feedback from consumer surveys and research 26.00%
Other 2.00%

Education

Factors Impacting 2025 Digital Marketing Investment % of Respondents
Current market trends and competition 36.00%
Consumer demand for products/services 32.00%
Available budget and resources 58.00%
Marketing campaign effectiveness and ROI 18.00%
Industry regulations and compliance 12.00%
Target audience demographics and behavior 42.00%
Business growth goals 30.00%
Economic conditions and forecasts 26.00%
Feedback from consumer surveys and research 32.00%
Other 2.00%

Energy/Utilities/Oil and Gas

Factors Impacting 2025 Digital Marketing Investment % of Respondents
Current market trends and competition 44.00%
Consumer demand for products/services 30.00%
Available budget and resources 44.00%
Marketing campaign effectiveness and ROI 22.00%
Industry regulations and compliance 28.00%
Target audience demographics and behavior 14.00%
Business growth goals 34.00%
Economic conditions and forecasts 34.00%
Feedback from consumer surveys and research 18.00%
Other 4.00%

Government/Public Sector

Factors Impacting 2025 Digital Marketing Investment % of Respondents
Current market trends and competition 26.00%
Consumer demand for products/services 20.00%
Available budget and resources 54.00%
Marketing campaign effectiveness and ROI 18.00%
Industry regulations and compliance 12.00%
Target audience demographics and behavior 20.00%
Business growth goals 24.00%
Economic conditions and forecasts 24.00%
Feedback from consumer surveys and research 24.00%
Other 8.00%

Health Care and Social Assistance

Factors Impacting 2025 Digital Marketing Investment % of Respondents
Current market trends and competition 50.00%
Consumer demand for products/services 38.00%
Available budget and resources 58.00%
Marketing campaign effectiveness and ROI 36.00%
Industry regulations and compliance 20.00%
Target audience demographics and behavior 40.00%
Business growth goals 46.00%
Economic conditions and forecasts 30.00%
Feedback from consumer surveys and research 24.00%
Other 6.00%

Hospitality/Tourism

Factors Impacting 2025 Digital Marketing Investment % of Respondents
Current market trends and competition 42.00%
Consumer demand for products/services 24.00%
Available budget and resources 64.00%
Marketing campaign effectiveness and ROI 22.00%
Industry regulations and compliance 14.00%
Target audience demographics and behavior 38.00%
Business growth goals 46.00%
Economic conditions and forecasts 42.00%
Feedback from consumer surveys and research 32.00%
Other 6.00%

Information Technology/IT

Factors Impacting 2025 Digital Marketing Investment % of Respondents
Current market trends and competition 56.00%
Consumer demand for products/services 46.00%
Available budget and resources 52.00%
Marketing campaign effectiveness and ROI 50.00%
Industry regulations and compliance 26.00%
Target audience demographics and behavior 44.00%
Business growth goals 50.00%
Economic conditions and forecasts 34.00%
Feedback from consumer surveys and research 30.00%
Other 0.00%

Manufacturing

Factors Impacting 2025 Digital Marketing Investment % of Respondents
Current market trends and competition 48.00%
Consumer demand for products/services 30.00%
Available budget and resources 56.00%
Marketing campaign effectiveness and ROI 34.00%
Industry regulations and compliance 4.00%
Target audience demographics and behavior 40.00%
Business growth goals 60.00%
Economic conditions and forecasts 48.00%
Feedback from consumer surveys and research 20.00%
Other 0.00%

Non Profit/Social services

Factors Impacting 2025 Digital Marketing Investment % of Respondents
Current market trends and competition 30.00%
Consumer demand for products/services 24.00%
Available budget and resources 58.00%
Marketing campaign effectiveness and ROI 24.00%
Industry regulations and compliance 10.00%
Target audience demographics and behavior 26.00%
Business growth goals 28.00%
Economic conditions and forecasts 22.00%
Feedback from consumer surveys and research 20.00%
Other 12.00%

Real Estate/Property

Factors Impacting 2025 Digital Marketing Investment % of Respondents
Current market trends and competition 50.00%
Consumer demand for products/services 34.00%
Available budget and resources 54.00%
Marketing campaign effectiveness and ROI 42.00%
Industry regulations and compliance 12.00%
Target audience demographics and behavior 26.00%
Business growth goals 40.00%
Economic conditions and forecasts 28.00%
Feedback from consumer surveys and research 16.00%
Other 2.00%

Retail

Factors Impacting 2025 Digital Marketing Investment % of Respondents
Current market trends and competition 50.00%
Consumer demand for products/services 44.00%
Available budget and resources 70.00%
Marketing campaign effectiveness and ROI 28.00%
Industry regulations and compliance 12.00%
Target audience demographics and behavior 28.00%
Business growth goals 44.00%
Economic conditions and forecasts 28.00%
Feedback from consumer surveys and research 24.00%
Other 2.00%

Transportation and Warehousing

Factors Impacting 2025 Digital Marketing Investment % of Respondents
Current market trends and competition 42.00%
Consumer demand for products/services 36.00%
Available budget and resources 46.00%
Marketing campaign effectiveness and ROI 28.00%
Industry regulations and compliance 20.00%
Target audience demographics and behavior 30.00%
Business growth goals 44.00%
Economic conditions and forecasts 28.00%
Feedback from consumer surveys and research 22.00%
Other 6.00%


notes icon

Industry Budget Trends

Industries that are not prioritizing budget above all other factors: 

  • Banking/financial respondents (current market trends and competition)
  • Manufacturing respondents (business growth goals) 
  • Construction respondents (economic conditions and forecasts)


4. Current marketing strategies

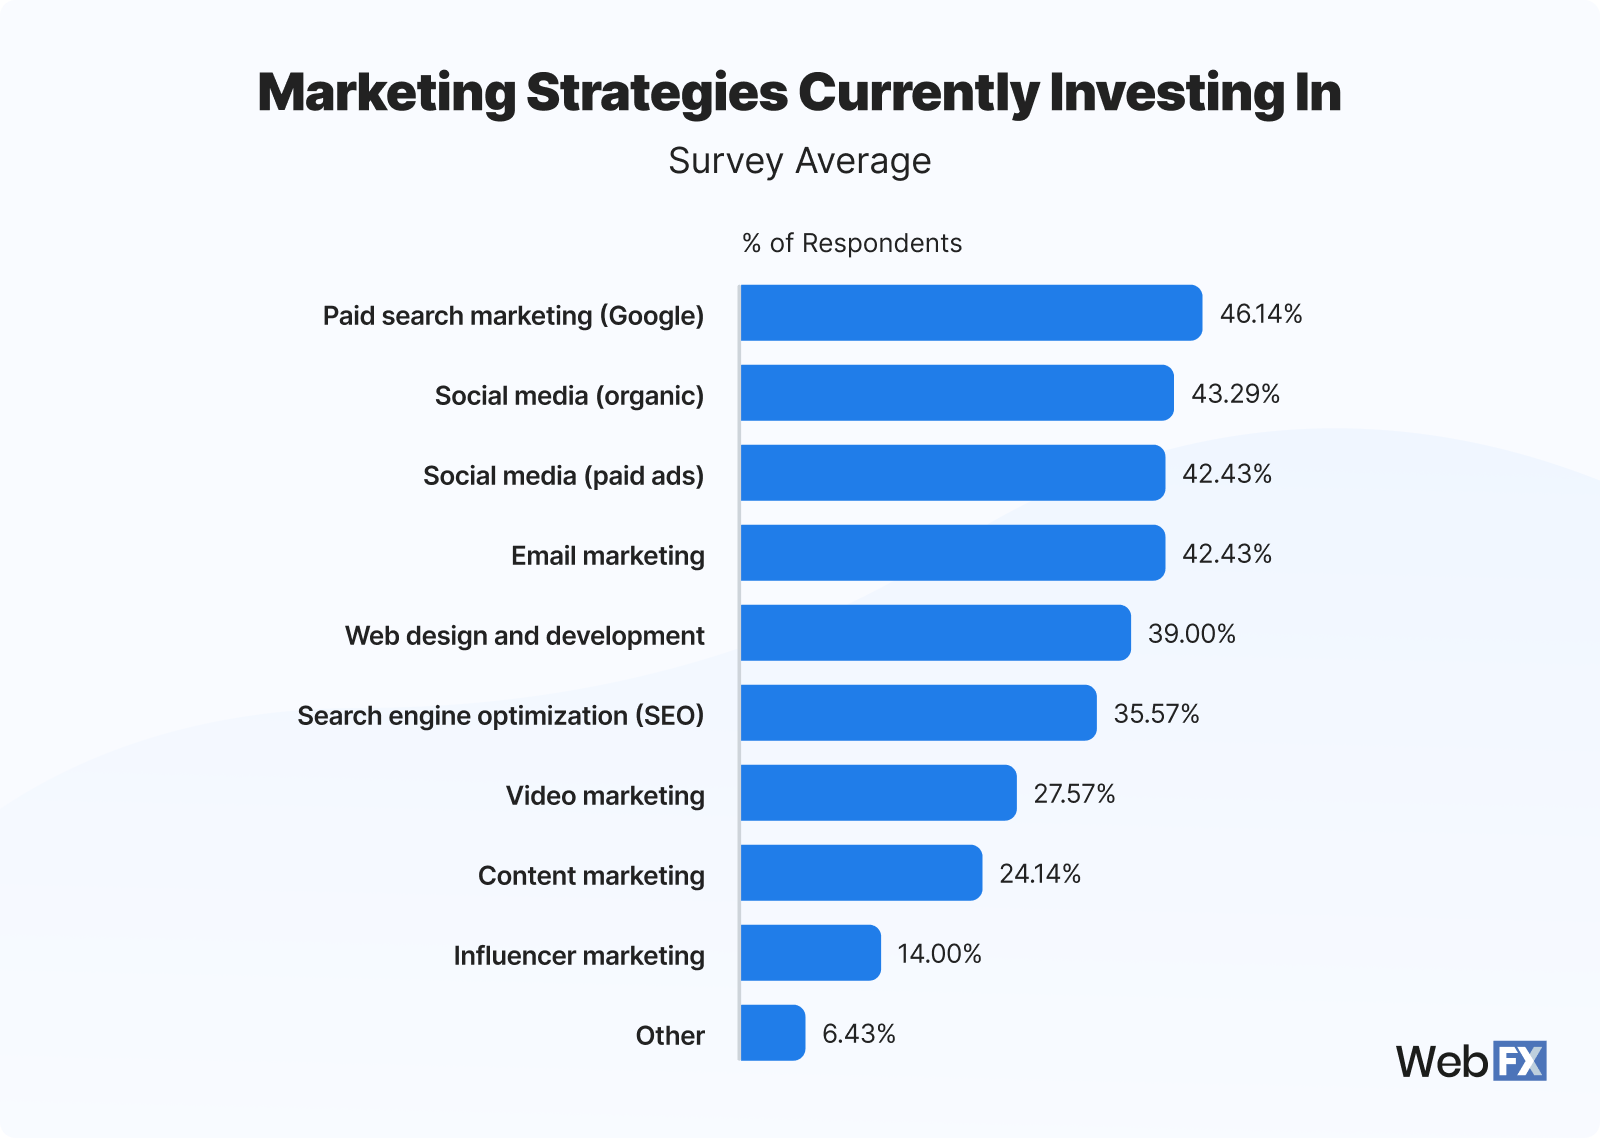
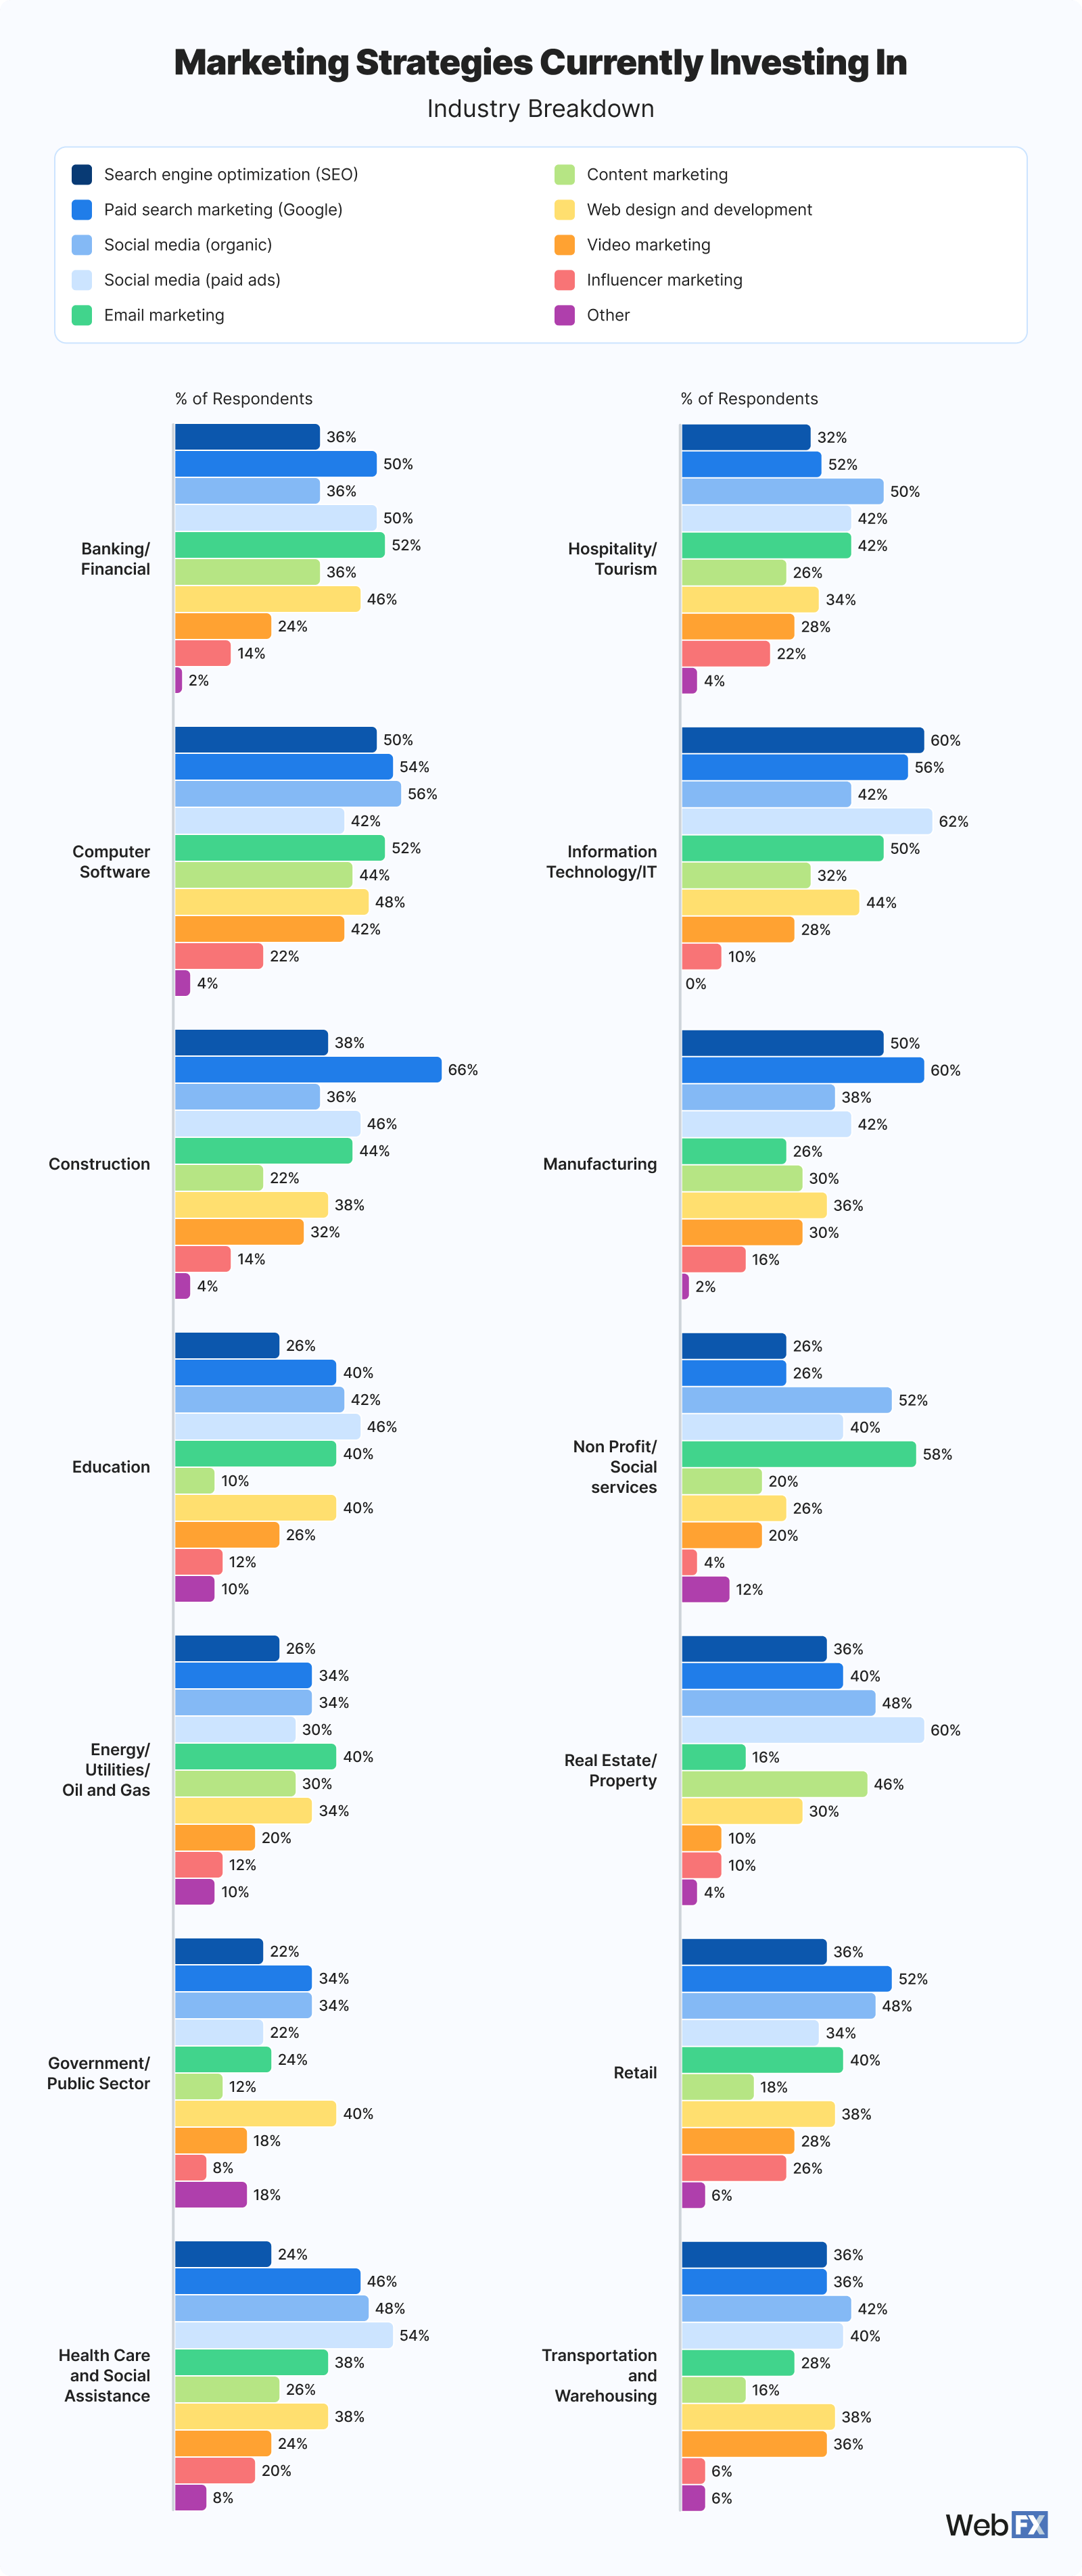
So, what marketing strategies are these budgets funding? Let’s take a look:

4 Marketing Strategies Currently Investing In

What does this mean for me?

Paid search marketing, social media, and email marketing are the top strategies that companies invest in, based on our research. Budget allocations are aiming to balance immediate returns with sustainable growth. Diversifying your budget will help you achieve both short- and long-term business goals. 

We can see an example of omnichannel strategies at work through the choice of top investment strategies:

  • Paid strategies (like PPC and paid social media) drive immediate results
  • Organic strategies (like organic social and web development) focus on long-term brand building.
  • Email marketing bridges between these to nurture leads over time while driving conversions.

As businesses target these strategies, they are also paying their web design mind to make sure users are converting when they land on pages ready to convert.

These investments show a careful approach to spending, which makes sense given the current economy and market climate. Marketing budgets for 2025 are conservative, favoring strategies with a track record of success, likely due to economic uncertainties or pressure to justify spending.

With experimental strategies (e.g., emerging platforms, AR/VR, or even influencer marketing) missing from the top priorities, we learn that businesses are allocating budgets toward proven channels.

View Source Data

Marketing Strategies Currently Investing In % of Respondents
Paid search marketing (Google) 46.14%
Social media (organic) 43.29%
Social media (paid ads) 42.43%
Email marketing 42.43%
Web design and development 39.00%
Search engine optimization (SEO) 35.57%
Video marketing 27.57%
Content marketing 24.14%
Influencer marketing 14.00%
Other 6.43%

View Industry Data

4 Industry Marketing Strategies Currently Investing In

Banking/Financial

Marketing Strategies Currently Investing In % of Respondents
Search engine optimization (SEO) 36.00%
Paid search marketing (Google) 50.00%
Social media (organic) 36.00%
Social media (paid ads) 50.00%
Email marketing 52.00%
Content marketing 36.00%
Web design and development 46.00%
Video marketing 24.00%
Influencer marketing 14.00%
Other 2.00%

Computer Software

Marketing Strategies Currently Investing In % of Respondents
Search engine optimization (SEO) 50.00%
Paid search marketing (Google) 54.00%
Social media (organic) 56.00%
Social media (paid ads) 42.00%
Email marketing 52.00%
Content marketing 44.00%
Web design and development 48.00%
Video marketing 42.00%
Influencer marketing 22.00%
Other 4.00%

Construction

Marketing Strategies Currently Investing In % of Respondents
Search engine optimization (SEO) 38.00%
Paid search marketing (Google) 66.00%
Social media (organic) 36.00%
Social media (paid ads) 46.00%
Email marketing 44.00%
Content marketing 22.00%
Web design and development 38.00%
Video marketing 32.00%
Influencer marketing 14.00%
Other 4.00%

Education

Marketing Strategies Currently Investing In % of Respondents
Search engine optimization (SEO) 26.00%
Paid search marketing (Google) 40.00%
Social media (organic) 42.00%
Social media (paid ads) 46.00%
Email marketing 40.00%
Content marketing 10.00%
Web design and development 40.00%
Video marketing 26.00%
Influencer marketing 12.00%
Other 10.00%

Energy/Utilities/Oil and Gas

Marketing Strategies Currently Investing In % of Respondents
Search engine optimization (SEO) 26.00%
Paid search marketing (Google) 34.00%
Social media (organic) 34.00%
Social media (paid ads) 30.00%
Email marketing 40.00%
Content marketing 30.00%
Web design and development 34.00%
Video marketing 20.00%
Influencer marketing 12.00%
Other 10.00%

Government/Public Sector

Marketing Strategies Currently Investing In % of Respondents
Search engine optimization (SEO) 22.00%
Paid search marketing (Google) 34.00%
Social media (organic) 34.00%
Social media (paid ads) 22.00%
Email marketing 24.00%
Content marketing 12.00%
Web design and development 40.00%
Video marketing 18.00%
Influencer marketing 8.00%
Other 18.00%

Health Care and Social Assistance

Marketing Strategies Currently Investing In % of Respondents
Search engine optimization (SEO) 24.00%
Paid search marketing (Google) 46.00%
Social media (organic) 48.00%
Social media (paid ads) 54.00%
Email marketing 38.00%
Content marketing 26.00%
Web design and development 38.00%
Video marketing 24.00%
Influencer marketing 20.00%
Other 8.00%

Hospitality/Tourism

Marketing Strategies Currently Investing In % of Respondents
Search engine optimization (SEO) 32.00%
Paid search marketing (Google) 52.00%
Social media (organic) 50.00%
Social media (paid ads) 42.00%
Email marketing 42.00%
Content marketing 26.00%
Web design and development 34.00%
Video marketing 28.00%
Influencer marketing 22.00%
Other 4.00%

Information Technology/IT

Marketing Strategies Currently Investing In % of Respondents
Search engine optimization (SEO) 60.00%
Paid search marketing (Google) 56.00%
Social media (organic) 42.00%
Social media (paid ads) 62.00%
Email marketing 50.00%
Content marketing 32.00%
Web design and development 44.00%
Video marketing 28.00%
Influencer marketing 10.00%
Other 0.00%

Manufacturing

Marketing Strategies Currently Investing In % of Respondents
Search engine optimization (SEO) 50.00%
Paid search marketing (Google) 60.00%
Social media (organic) 38.00%
Social media (paid ads) 42.00%
Email marketing 26.00%
Content marketing 30.00%
Web design and development 36.00%
Video marketing 30.00%
Influencer marketing 16.00%
Other 2.00%

Non Profit/Social services

Marketing Strategies Currently Investing In % of Respondents
Search engine optimization (SEO) 26.00%
Paid search marketing (Google) 26.00%
Social media (organic) 52.00%
Social media (paid ads) 40.00%
Email marketing 58.00%
Content marketing 20.00%
Web design and development 26.00%
Video marketing 20.00%
Influencer marketing 4.00%
Other 12.00%

Real Estate/Property

Marketing Strategies Currently Investing In % of Respondents
Search engine optimization (SEO) 36.00%
Paid search marketing (Google) 40.00%
Social media (organic) 48.00%
Social media (paid ads) 44.00%
Email marketing 60.00%
Content marketing 16.00%
Web design and development 46.00%
Video marketing 30.00%
Influencer marketing 10.00%
Other 4.00%

Retail

Marketing Strategies Currently Investing In % of Respondents
Search engine optimization (SEO) 36.00%
Paid search marketing (Google) 52.00%
Social media (organic) 48.00%
Social media (paid ads) 34.00%
Email marketing 40.00%
Content marketing 18.00%
Web design and development 38.00%
Video marketing 28.00%
Influencer marketing 26.00%
Other 6.00%

Transportation and Warehousing

Marketing Strategies Currently Investing In % of Respondents
Search engine optimization (SEO) 36.00%
Paid search marketing (Google) 36.00%
Social media (organic) 42.00%
Social media (paid ads) 40.00%
Email marketing 28.00%
Content marketing 16.00%
Web design and development 38.00%
Video marketing 36.00%
Influencer marketing 6.00%
Other 6.00%

notes icon

Industry Budget Trends

Industries prioritizing other channels:

  • IT (paid social media)
  • Retail (influencer marketing)
  • Banking/financial (web design and development)

5. Investment amounts across marketing channels

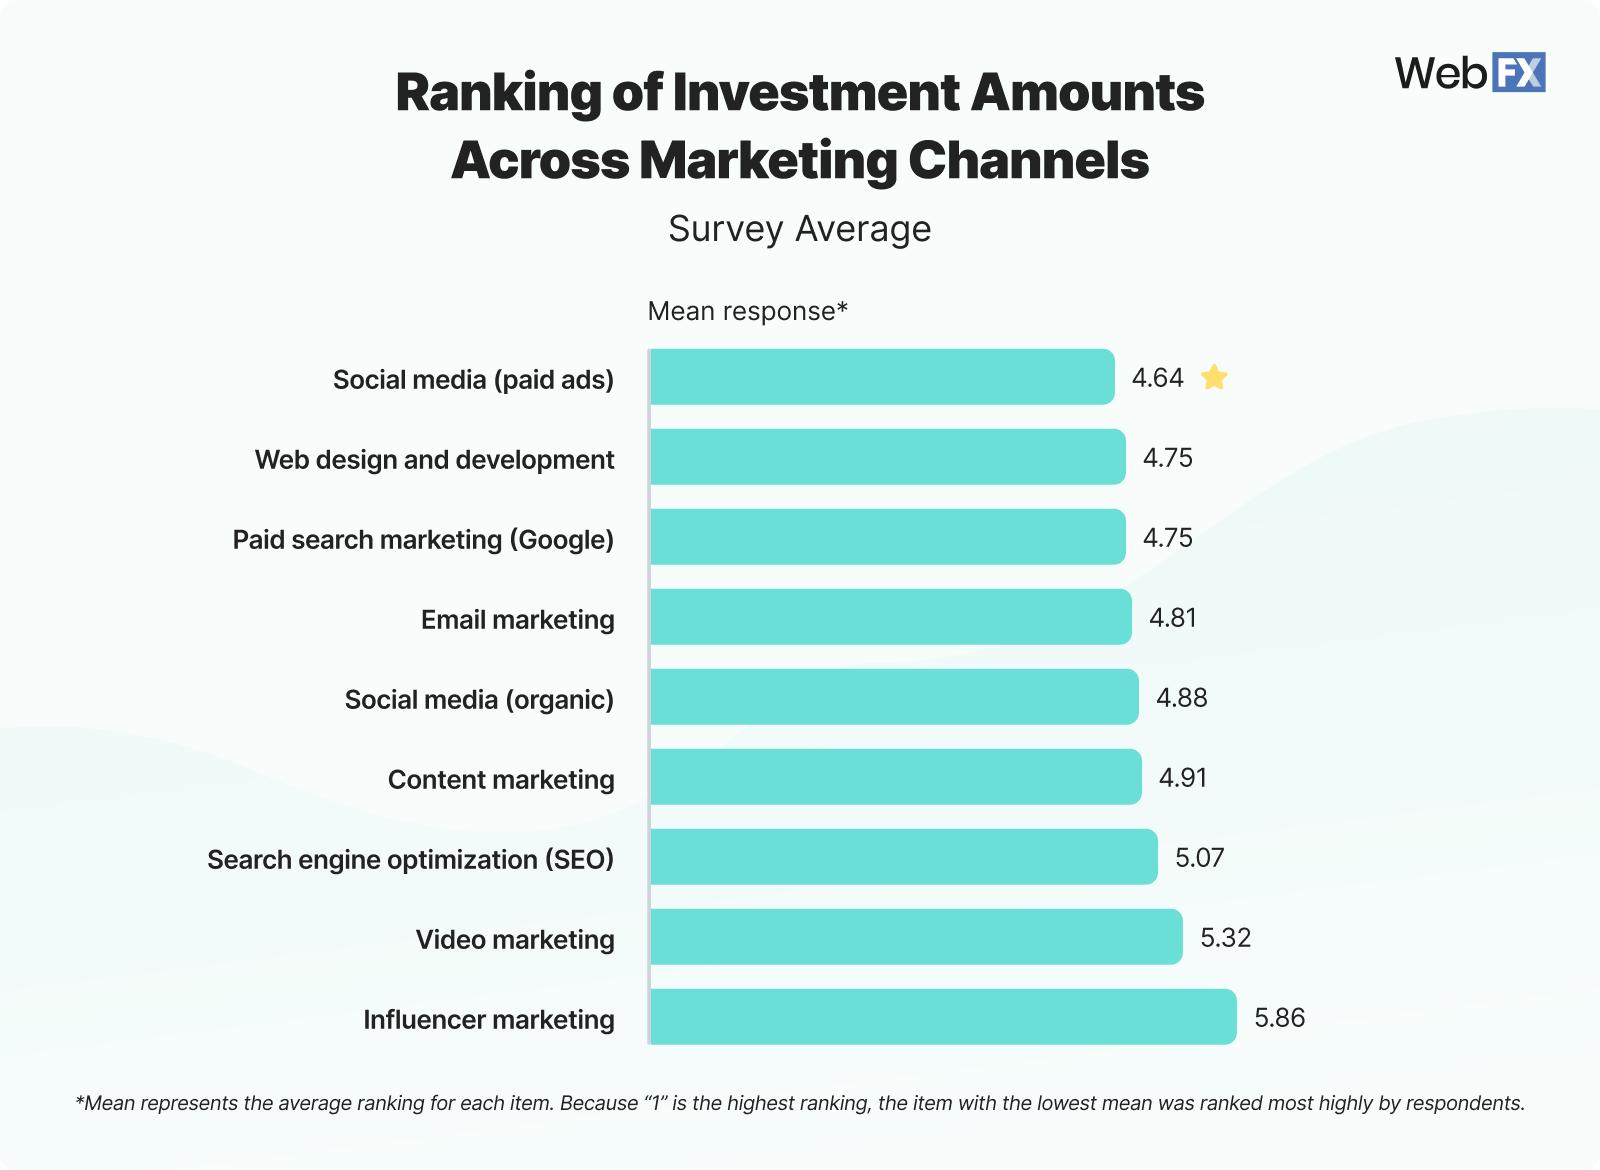
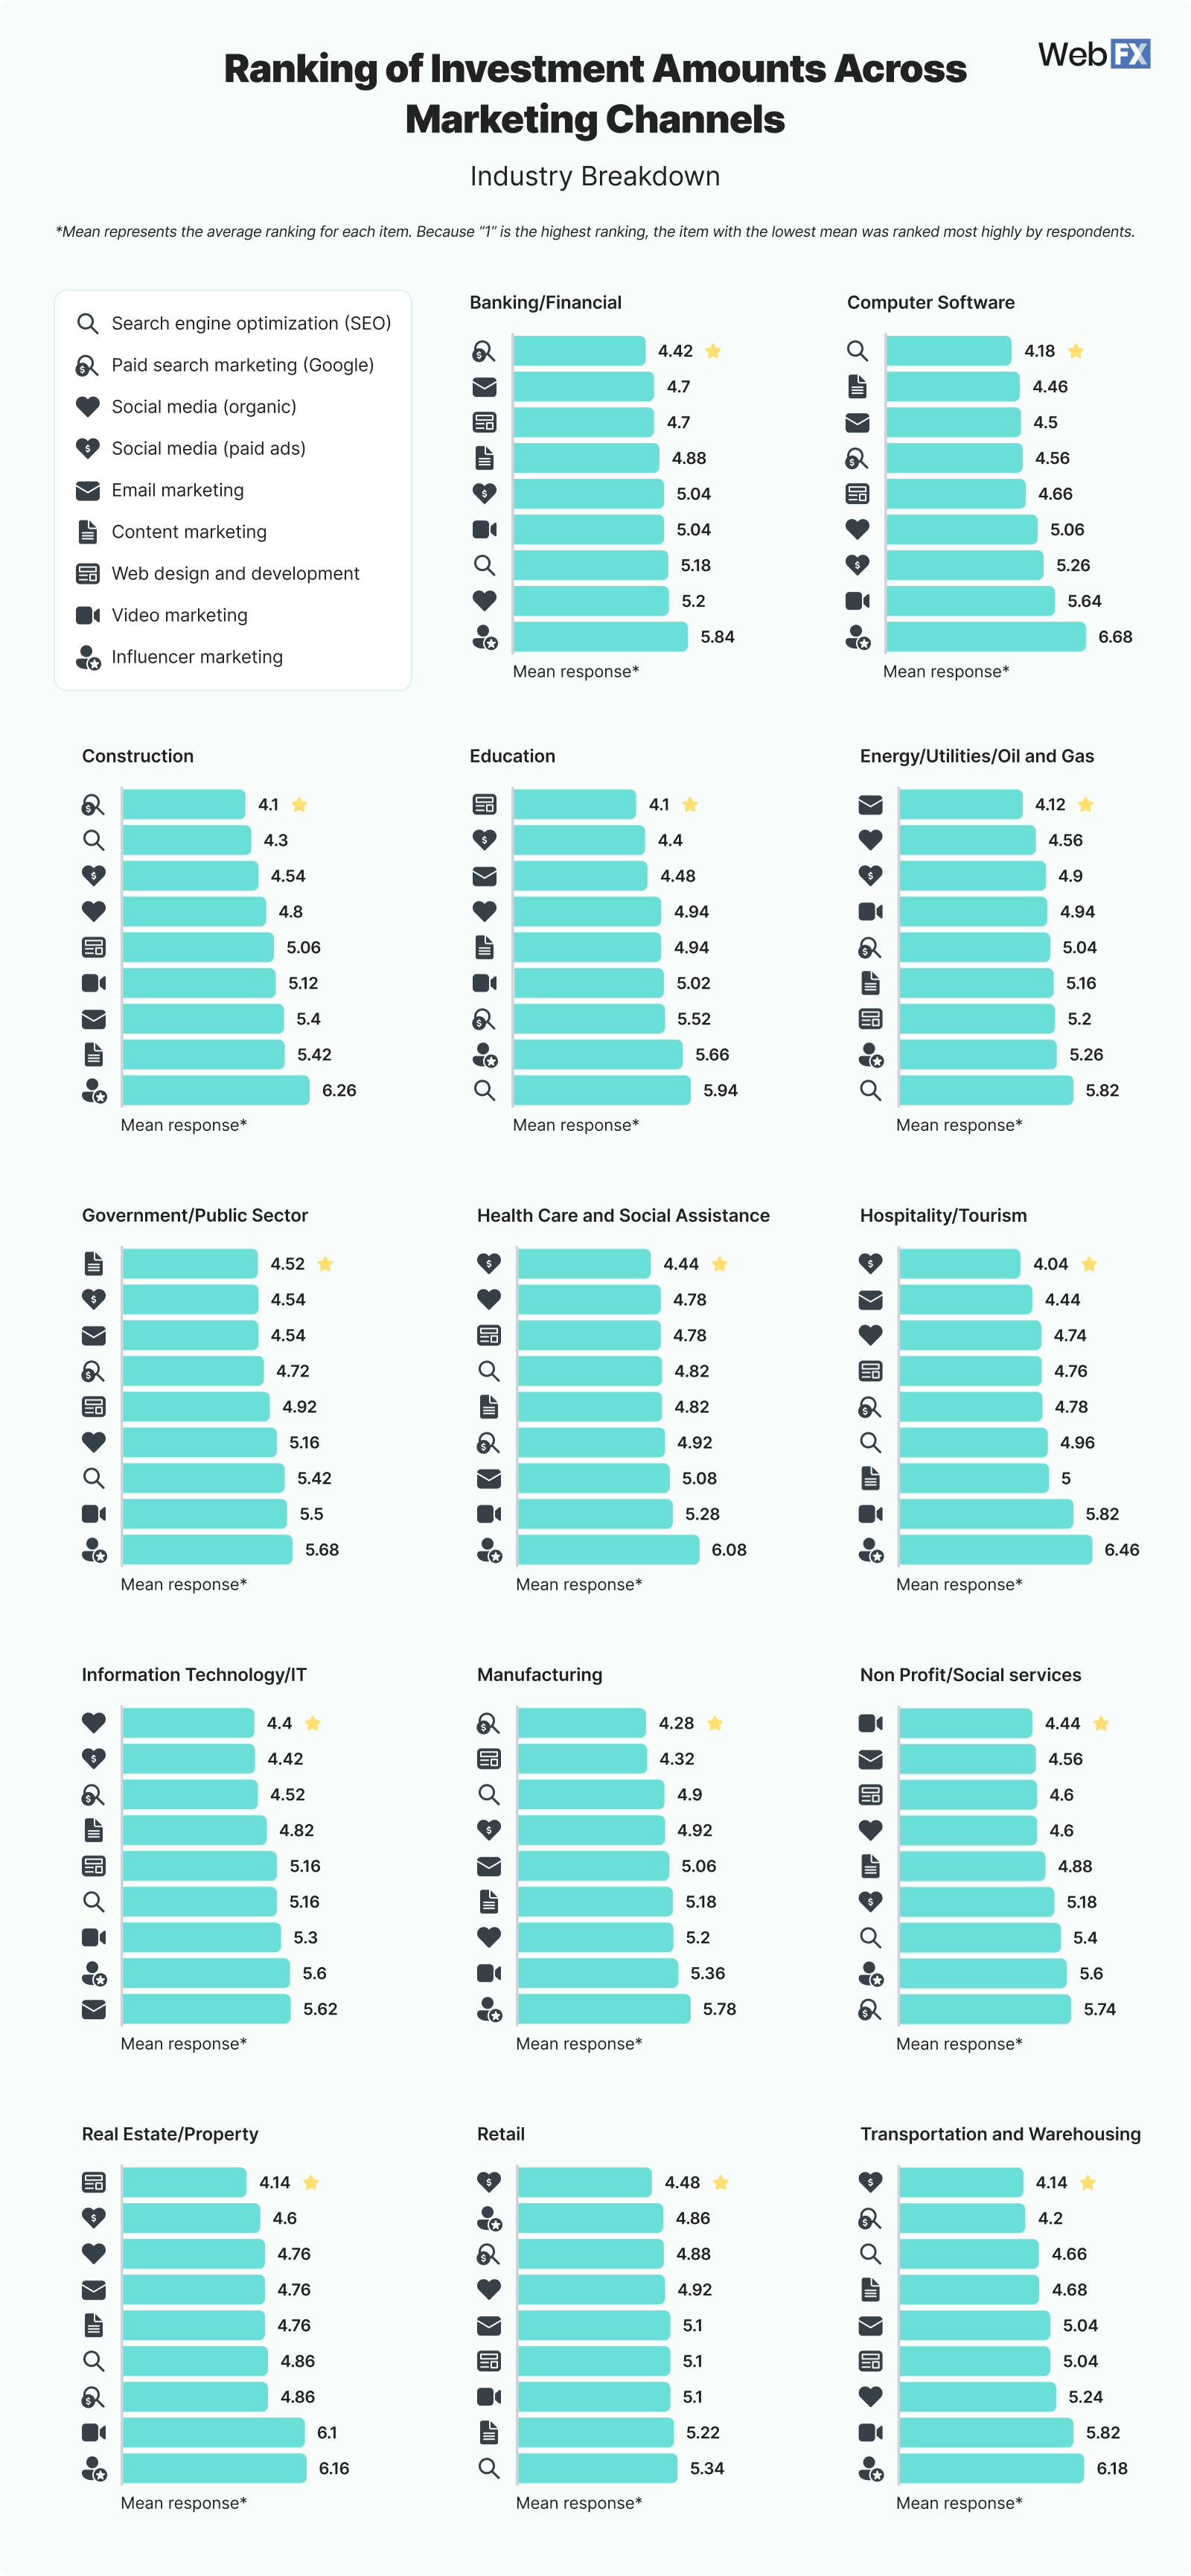
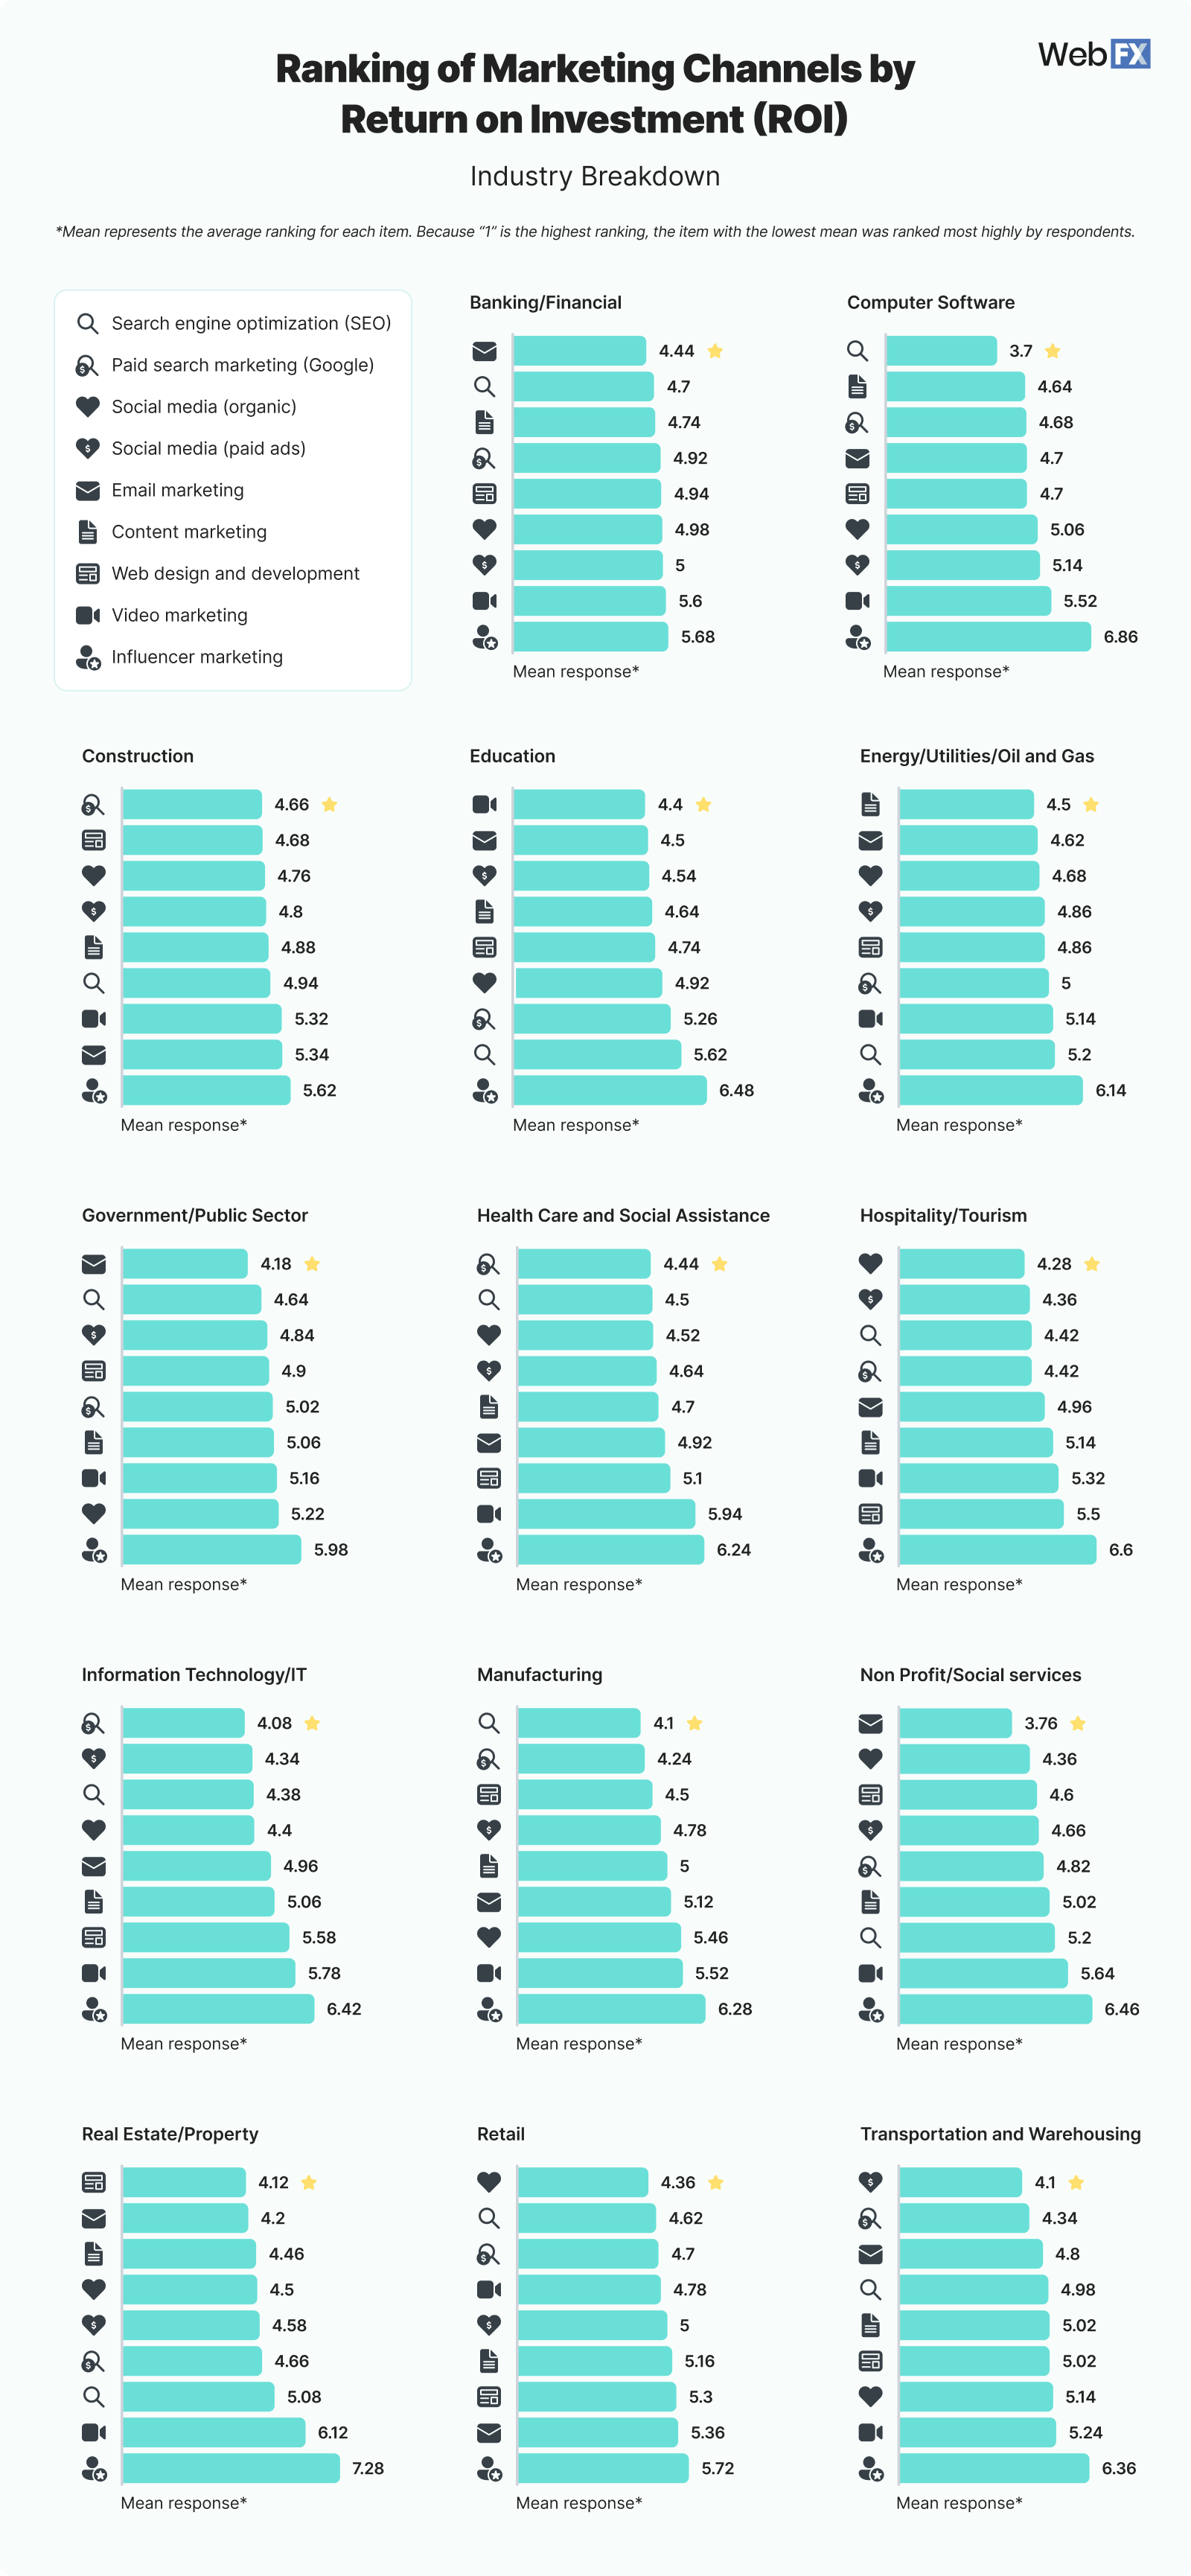
To further understand how people spend their marketing budget, we asked them to rank the strategies by how much they invested in them. This graph shows how people ranked the amount they spend, with the lowest number representing the highest amount invested: 

5 Investment Amounts Across Marketing Channels

What does this mean for me?

Paid social ads and paid search marketing are top-ranked, which means that businesses are investing more in short-term results and immediate ROI. This trend continues the idea from the previous question, but those long-term strategies are not completely removed. 

For example, while companies invest more in paid search, they are also investing in web design and dev, a more long-term strategy that impacts paid search directly. So, while short-term strategies claim the most budget, they aren’t the only consideration.

We can also look at the average prices of these services to understand why people are investing what they do. Social media ads, for example, can cost anywhere from $1000 to $25,000 per month, so it makes sense that this is the highest investment among our survey respondents. They have to invest more to stay competitive. 

Here are some other trends to note based on these rankings:

  • Focus on performance: The priority placed on paid channels (social and search) indicates a preference for strategies with measurable impact.
  • Push for long-term investments: High rankings for web design and email marketing suggest businesses are also focused on maintaining a strong digital foundation and nurturing relationships.
  • Integrated marketing approaches: Companies are combining paid and organic strategies in their top investments, pointing to well-rounded strategies and educated marketing goals. They aren’t just opting for immediate results – they’re building a brand.

With a push for long-term strategies, it’s also clear that companies are looking at market insecurity and budget constraints and finding ways to make change for long-term efficiency. They spend where they can, but should they face budget cuts, they have cost-effective strategies that will still help them grow slowly over time. 

View Source Data

Answer Mean response
Social media (paid ads) 4.64
Paid search marketing (Google) 4.75
Web design and development 4.75
Email marketing 4.81
Social media (organic) 4.88
Content marketing 4.91
Search engine optimization (SEO) 5.07
Video marketing 5.32
Influencer marketing 5.86

View Industry Data

5 Industry Investment Amounts Across Marketing Channels 1

Banking/Financial

Answer Mean Response
Paid search marketing (Google) 4.42
Email marketing 4.7
Web design and development 4.7
Content marketing 4.88
Social media (paid ads) 5.04
Video marketing 5.04
Search engine optimization (SEO) 5.18
Social media (organic) 5.2
Influencer marketing 5.84

Computer Software

Answer Mean Response
Search engine optimization (SEO) 4.18
Content marketing 4.46
Email marketing 4.5
Paid search marketing (Google) 4.56
Web design and development 4.66
Social media (organic) 5.06
Social media (paid ads) 5.26
Video marketing 5.64
Influencer marketing 6.68

Construction

Answer Mean Response
Paid search marketing (Google) 4.1
Search engine optimization (SEO) 4.3
Social media (paid ads) 4.54
Social media (organic) 4.8
Web design and development 5.06
Video marketing 5.12
Email marketing 5.4
Content marketing 5.42
Influencer marketing 6.26

Education

Answer Mean Response
Web design and development 4.1
Social media (paid ads) 4.4
Email marketing 4.48
Social media (organic) 4.94
Content marketing 4.94
Video marketing 5.02
Paid search marketing (Google) 5.52
Influencer marketing 5.66
Search engine optimization (SEO) 5.94

Energy/Utilities/Oil and Gas

Answer Mean Response
Email marketing 4.12
Social media (organic) 4.56
Social media (paid ads) 4.9
Video marketing 4.94
Paid search marketing (Google) 5.04
Content marketing 5.16
Web design and development 5.2
Influencer marketing 5.26
Search engine optimization (SEO) 5.82

Government/Public Sector

Answer Mean Response
Content marketing 4.52
Social media (paid ads) 4.54
Email marketing 4.54
Paid search marketing (Google) 4.72
Web design and development 4.92
Social media (organic) 5.16
Search engine optimization (SEO) 5.42
Video marketing 5.5
Influencer marketing 5.68

Health Care and Social Assistance

Answer Mean Response
Social media (paid ads) 4.44
Social media (organic) 4.78
Web design and development 4.78
Search engine optimization (SEO) 4.82
Content marketing 4.82
Paid search marketing (Google) 4.92
Email marketing 5.08
Video marketing 5.28
Influencer marketing 6.08

Hospitality/Tourism

Answer Mean Response
Social media (paid ads) 4.04
Email marketing 4.44
Social media (organic) 4.74
Web design and development 4.76
Paid search marketing (Google) 4.78
Search engine optimization (SEO) 4.96
Content marketing 5
Video marketing 5.82
Influencer marketing 6.46

Information Technology/IT

Answer Mean Response
Social media (organic) 4.4
Social media (paid ads) 4.42
Paid search marketing (Google) 4.52
Content marketing 4.82
Web design and development 5.16
Search engine optimization (SEO) 5.16
Video marketing 5.3
Influencer marketing 5.6
Email marketing 5.62

Manufacturing

Answer Mean Response
Paid search marketing (Google) 4.28
Web design and development 4.32
Search engine optimization (SEO) 4.9
Social media (paid ads) 4.92
Email marketing 5.06
Content marketing 5.18
Social media (organic) 5.2
Video marketing 5.36
Influencer marketing 5.78

Non Profit/Social services

Answer Mean Response
Video marketing 4.44
Email marketing 4.56
Web design and development 4.6
Social media (organic) 4.6
Content marketing 4.88
Social media (paid ads) 5.18
Search engine optimization (SEO) 5.4
Influencer marketing 5.6
Paid search marketing (Google) 5.74

Real Estate/Property

Answer Mean Response
Web design and development 4.14
Social media (paid ads) 4.6
Social media (organic) 4.76
Email marketing 4.76
Content marketing 4.76
Search engine optimization (SEO) 4.86
Paid search marketing (Google) 4.86
Video marketing 6.1
Influencer marketing 6.16

Retail

Answer Mean Response
Social media (paid ads) 4.48
Influencer marketing 4.86
Paid search marketing (Google) 4.88
Social media (organic) 4.92
Email marketing 5.1
Web design and development 5.1
Video marketing 5.1
Content marketing 5.22
Search engine optimization (SEO) 5.34

Transportation and Warehousing

Answer Mean Response
Social media (paid ads) 4.14
Paid search marketing (Google) 4.2
Search engine optimization (SEO) 4.66
Content marketing 4.68
Email marketing 5.04
Web design and development 5.04
Social media (organic) 5.24
Video marketing 5.82
Influencer marketing 6.18

notes icon

Industry Budget Trends

Industries who spend more on other channels:

6. Marketing channels by ROI

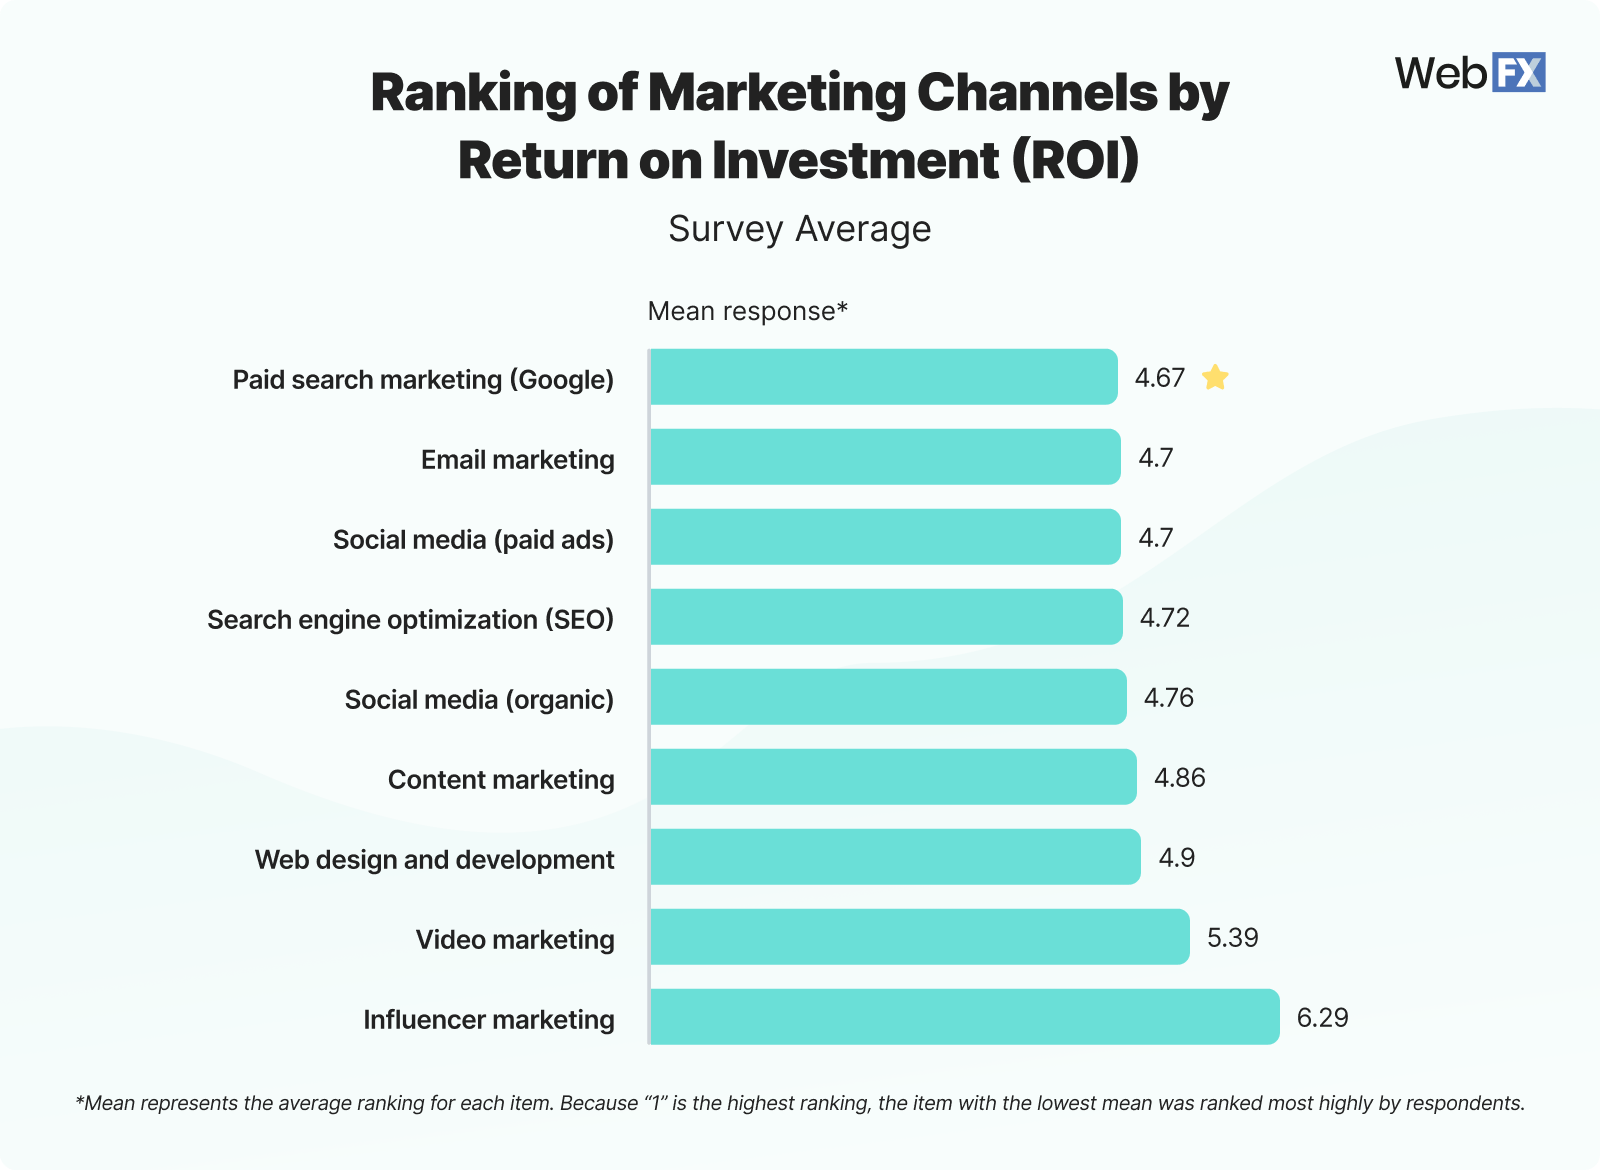
Once we established the channels respondents were investing in, we wanted to understand the ROI they were earning from those channels. 

6 Marketing Channels by ROI

What does this mean for me?

Interestingly, the amount invested does not equal the returns earned. While social media ads were a top investment and a top ROI earner, web design and development is near the bottom in terms of ROI. 

The major trend with this data is that people are either not investing in the right strategies, or they lack the right marketing technology and tools to close the loop on their marketing. If you feel like that’s where you struggle with your marketing strategy, tools like RevenueCloudFX bring your data together to help you centralize your results and inform your sales team. 

It’s also worth noting that SEO has higher ROI potential but lower budget priority. Companies might be investing less in SEO to use it as a long-term, slow-growth strategy, while focusing the bulk of their spend on paid search marketing. 

The lowest performing channels, video marketing and influencer marketing, are not low on the scale because these strategies are ineffective overall. Companies have to budget for the strategies that drive change, and if they have to make cuts, they will do it with strategies that cost more for external resources (like finding and contracting influencers or scripting, recording, and editing videos).

View Source Data


Answer Mean response
Paid search marketing (Google) 4.67
Email marketing 4.7
Social media (paid ads) 4.7
Search engine optimization (SEO) 4.72
Social media (organic) 4.76
Content marketing 4.86
Web design and development 4.9
Video marketing 5.39
Influencer marketing 6.29

View Industry Data

6 Industry Marketing Channels by ROI

Banking/Financial

Answer Mean Response
Email marketing 4.44
Search engine optimization (SEO) 4.7
Content marketing 4.74
Paid search marketing (Google) 4.92
Web design and development 4.94
Social media (organic) 4.98
Social media (paid ads) 5
Video marketing 5.6
Influencer marketing 5.68

Computer Software

Answer Mean Response
Search engine optimization (SEO) 3.7
Content marketing 4.64
Paid search marketing (Google) 4.68
Email marketing 4.7
Web design and development 4.7
Social media (organic) 5.06
Social media (paid ads) 5.14
Video marketing 5.52
Influencer marketing 6.86

Construction

Answer Mean Response
Paid search marketing (Google) 4.66
Web design and development 4.68
Social media (organic) 4.76
Social media (paid ads) 4.8
Content marketing 4.88
Search engine optimization (SEO) 4.94
Video marketing 5.32
Email marketing 5.34
Influencer marketing 5.62

Education

Answer Mean Response
Video marketing 4.4
Email marketing 4.5
Social media (paid ads) 4.54
Content marketing 4.64
Web design and development 4.74
Social media (organic) 4.92
Paid search marketing (Google) 5.16
Search engine optimization (SEO) 5.62
Influencer marketing 6.48

Energy/Utilities/Oil and Gas

Answer Mean Response
Content marketing 4.5
Email marketing 4.62
Social media (organic) 4.68
Social media (paid ads) 4.86
Web design and development 4.86
Paid search marketing (Google) 5
Video marketing 5.14
Search engine optimization (SEO) 5.2
Influencer marketing 6.14

Government/Public Sector

Answer Mean Response
Email marketing 4.18
Search engine optimization (SEO) 4.64
Social media (paid ads) 4.84
Web design and development 4.9
Paid search marketing (Google) 5.02
Content marketing 5.06
Video marketing 5.16
Social media (organic) 5.22
Influencer marketing 5.98

Health Care and Social Assistance

Answer Mean Response
Paid search marketing (Google) 4.44
Search engine optimization (SEO) 4.5
Social media (organic) 4.52
Social media (paid ads) 4.64
Content marketing 4.7
Email marketing 4.92
Web design and development 5.1
Video marketing 5.94
Influencer marketing 6.24

Hospitality/Tourism

Answer Mean Response
Social media (organic) 4.28
Social media (paid ads) 4.36
Search engine optimization (SEO) 4.42
Paid search marketing (Google) 4.42
Email marketing 4.96
Content marketing 5.14
Video marketing 5.32
Web design and development 5.5
Influencer marketing 6.6

Information Technology/IT

Answer Mean Response
Paid search marketing (Google) 4.08
Social media (paid ads) 4.34
Search engine optimization (SEO) 4.38
Social media (organic) 4.4
Email marketing 4.96
Content marketing 5.06
Web design and development 5.58
Video marketing 5.78
Influencer marketing 6.42

Manufacturing

Answer Mean Response
Search engine optimization (SEO) 4.1
Paid search marketing (Google) 4.24
Web design and development 4.5
Social media (paid ads) 4.78
Content marketing 5
Email marketing 5.12
Social media (organic) 5.46
Video marketing 5.52
Influencer marketing 6.28

Non Profit/Social services

Answer Mean Response
Email marketing 3.76
Social media (organic) 4.36
Web design and development 4.66
Social media (paid ads) 4.82
Paid search marketing (Google) 5.02
Content marketing 5.08
Search engine optimization (SEO) 5.2
Video marketing 5.64
Influencer marketing 6.46

Real Estate/Property

Answer Mean Response
Web design and development 4.12
Email marketing 4.2
Content marketing 4.46
Social media (organic) 4.5
Social media (paid ads) 4.58
Paid search marketing (Google) 4.66
Search engine optimization (SEO) 5.08
Video marketing 6.12
Influencer marketing 7.28

Retail

Answer Mean Response
Social media (organic) 4.36
Search engine optimization (SEO) 4.62
Paid search marketing (Google) 4.7
Video marketing 4.78
Social media (paid ads) 5
Content marketing 5.16
Web design and development 5.3
Email marketing 5.36
Influencer marketing 5.72

Transportation and Warehousing

Answer Mean Response
Social media (paid ads) 4.1
Paid search marketing (Google) 4.34
Email marketing 4.8
Search engine optimization (SEO) 4.98
Content marketing 5.02
Web design and development 5.02
Social media (organic) 5.14
Video marketing 5.24
Influencer marketing 6.36

notes icon

Industry Budget Trends

Industries that see high ROI outside the top-ranked channels:

  • Energy/utilities/oil and gas (content marketing)
  • Banking/financial (email marketing)
  • Education (video marketing)

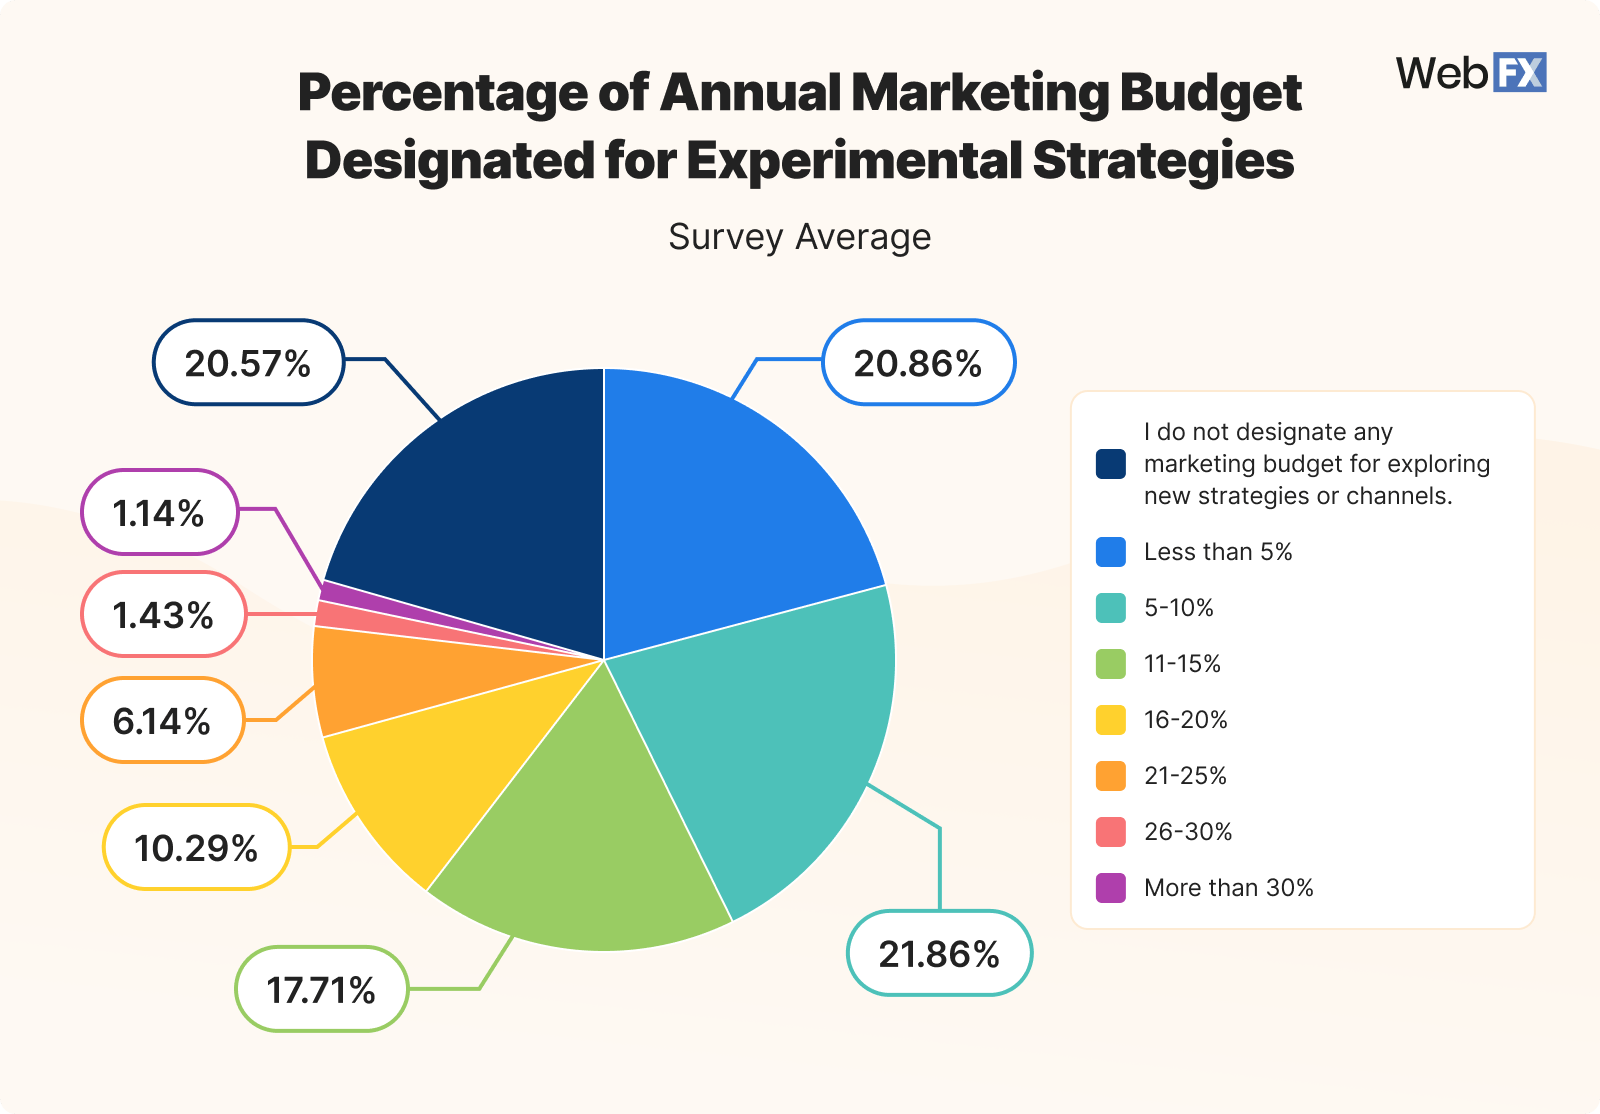
7. Percent of annual marketing budget designated for experimental strategies

Sometimes, you have to experiment with new strategies to see what will work best for your business. 

Here is the percentage of annual marketing budgets designated for experimental strategies: 

7 Percent of Annual Marketing Budget Designated for Experimental Strategies

What does this mean for me?

As we’ve seen throughout this page, many (but not all) companies are playing it safe with their marketing budgets. That trend comes to a head here — over 42% of companies have a budget of less than 10% for experimental strategies, and 20% aren’t investing anything. 

Why? 

Economic pressures and ROI concerns likely drive this behavior. Very few businesses invest heavily in experimental strategies, which shows that they are hesitant to try unproven strategies and risk losing their investment. These respondents want to see returns so they can continue their investments without overhead interference.

To find some middle ground, you can balance risk by testing your investments and tracking performance, then opting for incremental increases as they prove their success.

The marketing landscape is constantly changing. Between new technology and algorithms on sites like Google, the strategies of even three years ago aren’t as effective as the ones today. To stay on top of your marketing budget and plan, you should be investing in new strategies, even if you only dedicate a small percentage to doing so. 

View Source Data

Percent of Annual Marketing Budget Designated for Experimental Strategies % of Answers
Less than 5% 20.86%
5-10% 21.86%
11-15% 17.71%
16-20% 10.29%
21-25% 6.14%
26-30% 1.43%
More than 30% 1.14%
I do not designate any marketing budget for exploring new strategies or channels. 20.57%

View Industry Data

7 Industry Percent of Annual Marketing Budget Designated for Experimental Strategies

Banking/Financial

Percent of Annual Marketing Budget Designated for Experimental Strategies % of Answers
I do not designate any marketing budget for exploring new strategies or channels. 16.00%
Less than 5% 20.00%
5-10% 28.00%
11-15% 22.00%
16-20% 8.00%
21-25% 2.00%
26-30% 0.00%
More than 30% 4.00%

Computer Software

Percent of Annual Marketing Budget Designated for Experimental Strategies % of Answers
I do not designate any marketing budget for exploring new strategies or channels. 6.00%
Less than 5% 20.00%
5-10% 20.00%
11-15% 14.00%
16-20% 24.00%
21-25% 12.00%
26-30% 0.00%
More than 30% 4.00%

Construction

Percent of Annual Marketing Budget Designated for Experimental Strategies % of Answers
I do not designate any marketing budget for exploring new strategies or channels. 14.00%
Less than 5% 24.00%
5-10% 30.00%
11-15% 14.00%
16-20% 18.00%
21-25% 0.00%
26-30% 0.00%
More than 30% 0.00%

Education

Percent of Annual Marketing Budget Designated for Experimental Strategies % of Answers
I do not designate any marketing budget for exploring new strategies or channels. 22.00%
Less than 5% 24.00%
5-10% 18.00%
11-15% 26.00%
16-20% 10.00%
21-25% 0.00%
26-30% 0.00%
More than 30% 0.00%

Energy/Utilities/Oil and Gas

Percent of Annual Marketing Budget Designated for Experimental Strategies % of Answers
I do not designate any marketing budget for exploring new strategies or channels. 30.00%
Less than 5% 16.00%
5-10% 20.00%
11-15% 24.00%
16-20% 0.00%
21-25% 8.00%
26-30% 2.00%
More than 30% 0.00%

Government/Public Sector

Percent of Annual Marketing Budget Designated for Experimental Strategies % of Answers
I do not designate any marketing budget for exploring new strategies or channels. 46.00%
Less than 5% 16.00%
5-10% 16.00%
11-15% 12.00%
16-20% 4.00%
21-25% 6.00%
26-30% 0.00%
More than 30% 0.00%

Health Care and Social Assistance

Percent of Annual Marketing Budget Designated for Experimental Strategies % of Answers
I do not designate any marketing budget for exploring new strategies or channels. 14.00%
Less than 5% 14.00%
5-10% 26.00%
11-15% 18.00%
16-20% 14.00%
21-25% 10.00%
26-30% 2.00%
More than 30% 2.00%

Hospitality/Tourism

Percent of Annual Marketing Budget Designated for Experimental Strategies % of Answers
I do not designate any marketing budget for exploring new strategies or channels. 20.00%
Less than 5% 24.00%
5-10% 12.00%
11-15% 18.00%
16-20% 16.00%
21-25% 4.00%
26-30% 2.00%
More than 30% 4.00%

Information Technology/IT

Percent of Annual Marketing Budget Designated for Experimental Strategies % of Answers
I do not designate any marketing budget for exploring new strategies or channels. 10.00%
Less than 5% 16.00%
5-10% 22.00%
11-15% 18.00%
16-20% 18.00%
21-25% 8.00%
26-30% 8.00%
More than 30% 0.00%

Manufacturing

Percent of Annual Marketing Budget Designated for Experimental Strategies % of Answers
I do not designate any marketing budget for exploring new strategies or channels. 18.00%
Less than 5% 14.00%
5-10% 20.00%
11-15% 18.00%
16-20% 12.00%
21-25% 16.00%
26-30% 2.00%
More than 30% 0.00%

Non Profit/Social services

Percent of Annual Marketing Budget Designated for Experimental Strategies % of Answers
I do not designate any marketing budget for exploring new strategies or channels. 36.00%
Less than 5% 28.00%
5-10% 14.00%
11-15% 14.00%
16-20% 4.00%
21-25% 2.00%
26-30% 0.00%
More than 30% 2.00%

Real Estate/Property

Percent of Annual Marketing Budget Designated for Experimental Strategies % of Answers
I do not designate any marketing budget for exploring new strategies or channels. 18.00%
Less than 5% 30.00%
5-10% 26.00%
11-15% 14.00%
16-20% 10.00%
21-25% 2.00%
26-30% 0.00%
More than 30% 0.00%

Retail

Percent of Annual Marketing Budget Designated for Experimental Strategies % of Answers
I do not designate any marketing budget for exploring new strategies or channels. 24.00%
Less than 5% 22.00%
5-10% 24.00%
11-15% 18.00%
16-20% 0.00%
21-25% 8.00%
26-30% 4.00%
More than 30% 0.00%

Transportation and Warehousing

Percent of Annual Marketing Budget Designated for Experimental Strategies % of Answers
I do not designate any marketing budget for exploring new strategies or channels. 14.00%
Less than 5% 24.00%
5-10% 30.00%
11-15% 18.00%
16-20% 6.00%
21-25% 8.00%
26-30% 0.00%
More than 30% 0.00%
notes icon

Industry Budget Trends

Industries that spend over 30% of their marketing budget on experimental marketing strategies:

  • Banking/financial
  • Computer software
  • Healthcare and social assistance
  • Hospitality and tourism
  • Nonprofit and social services

8. Marketing spend compared to industry

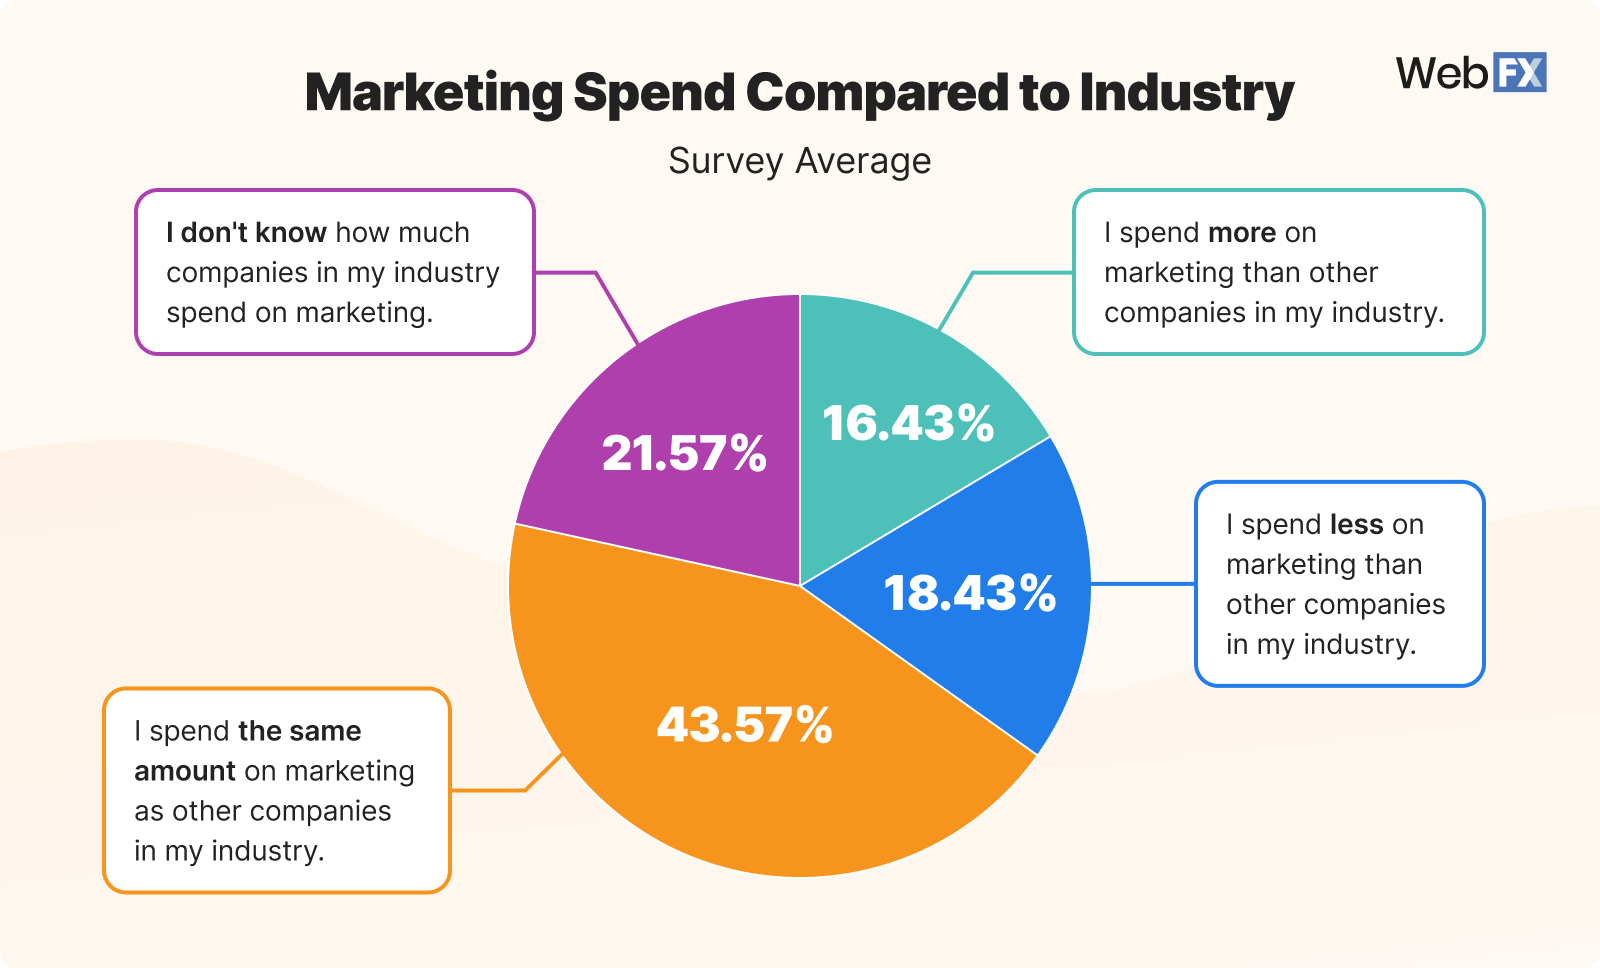
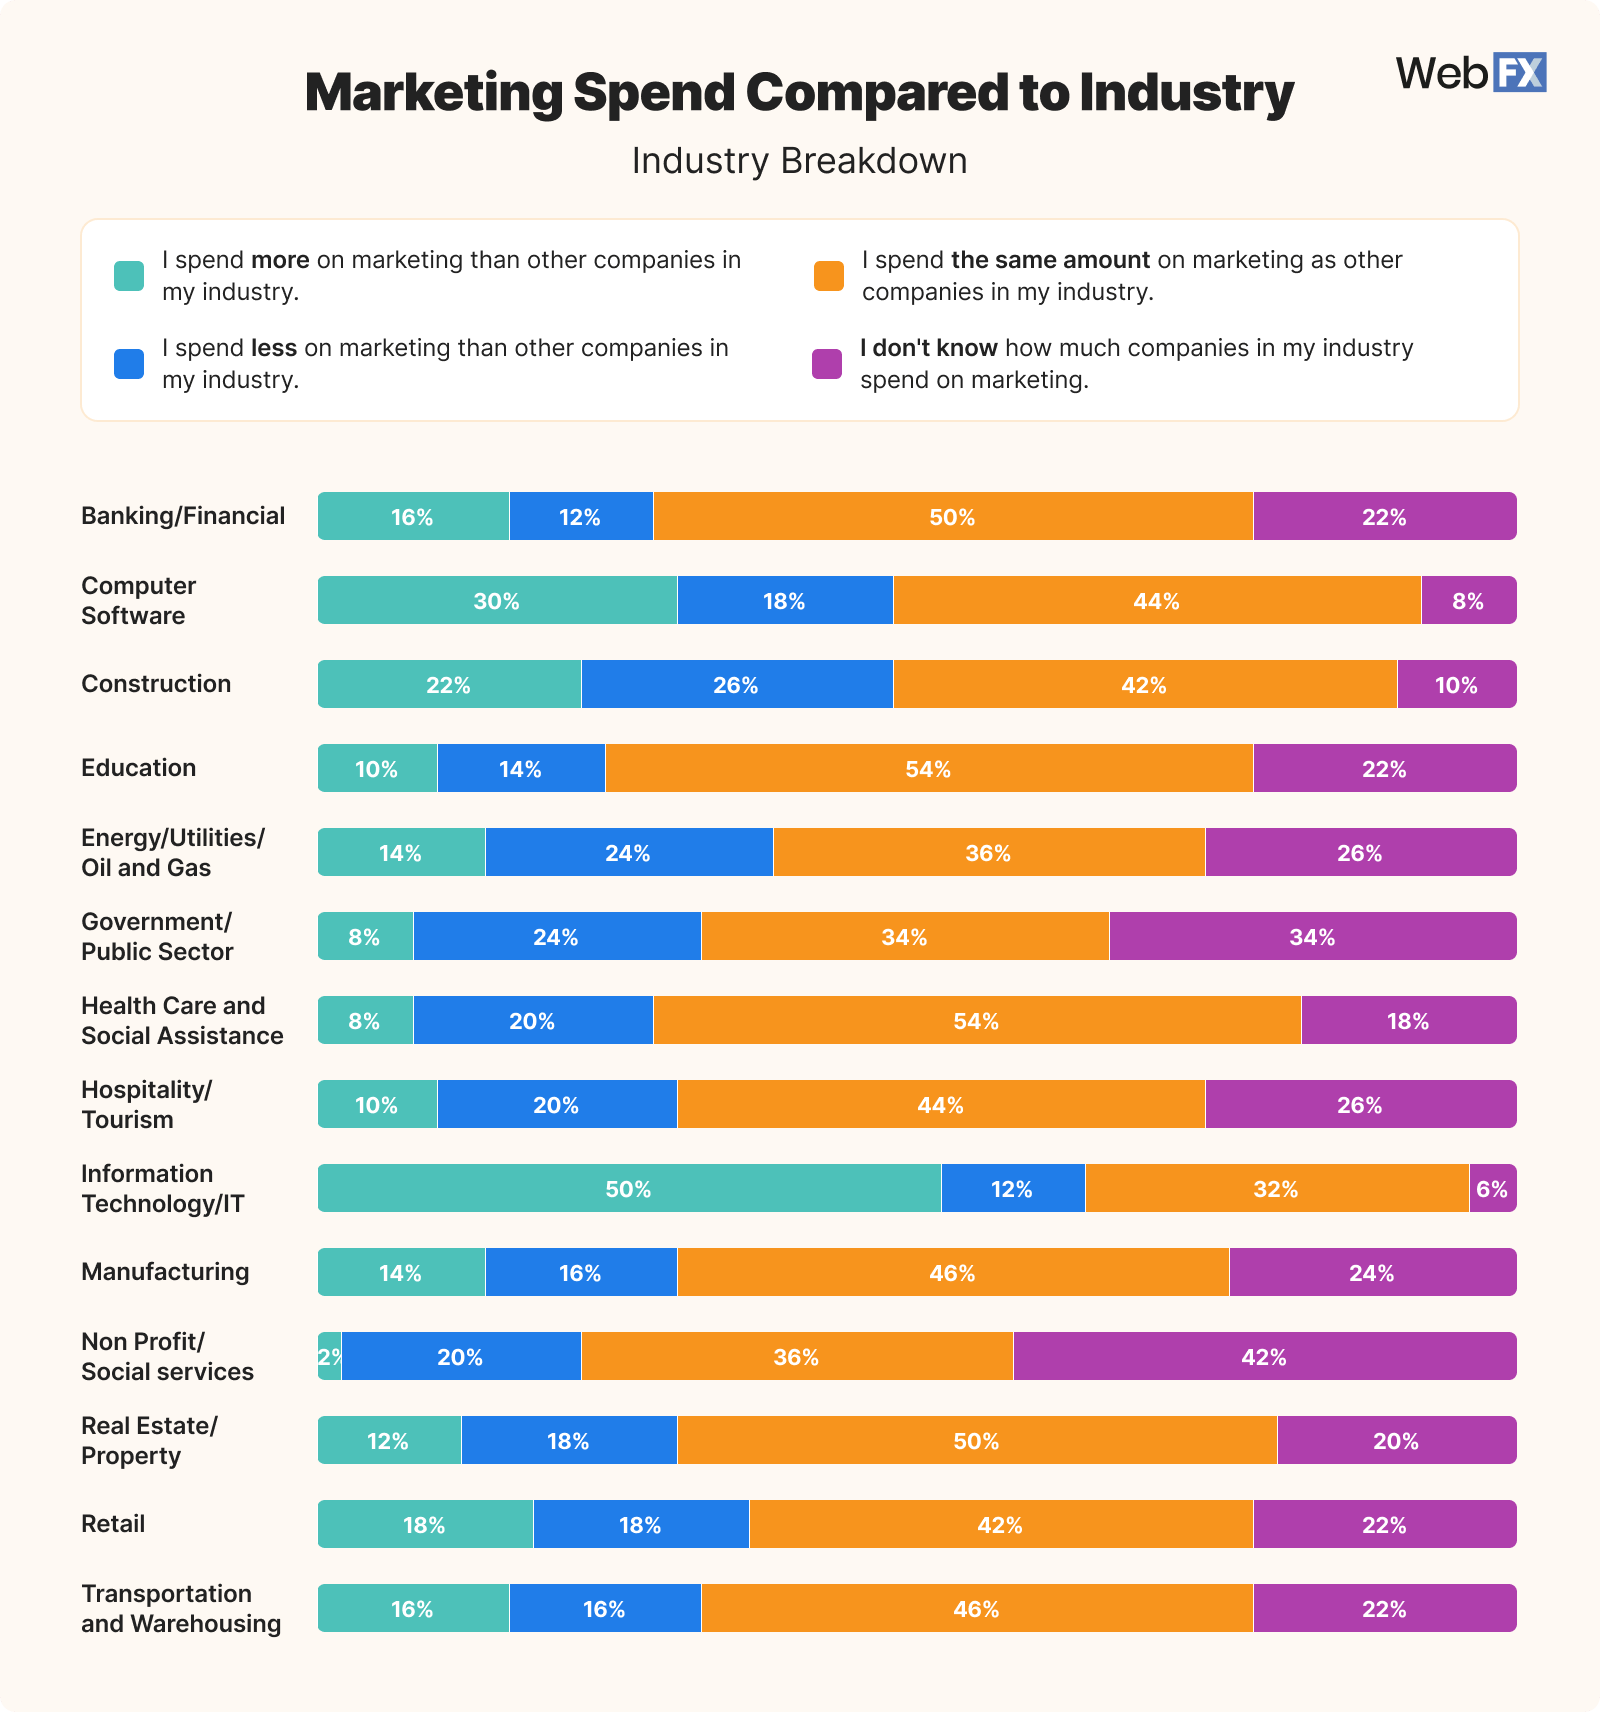
So, how much are companies spending in relation to their industry average? Let’s look at how they responded when we asked:

8 Marketing Spend Compared to Industry

What does this mean for me?

Most respondents (43.57%) feel they spend the same amount on marketing as other companies in their industry. Companies are analyzing their competition and paying attention to how much others are investing in digital marketing strategies. Their main goal is to keep pace with others in their industry to be competitive. 

There are also reasons why companies might choose to spend more or less than others in their market. You might have different business goals or budget constraints, making it more suitable for you to spend less. Companies who are spending more likely have aggressive growth goals, likely from being a new business or one in a challenging market.

Here are some overall tips and trends for finding a balance with what others in your industry are spending:

  • Flexible budgets: Allocating a small portion of your budget for flexible use allows for shifts toward high-performing channels or reoptimizations during the year.
  • Scalable strategies: Channels like SEO, content marketing, and email marketing scale well over time to provide long-term ROI. You can spend less or more depending on your available budget while still seeing results.
  • Short- and long-term goals: Combine immediate impact strategies with long-term efforts like brand-building and customer retention.

View Source Data

Marketing Spend Compared to Industry % of Answers
I spend more on marketing than other companies in my industry. 16.43%
I spend less on marketing than other companies in my industry. 18.43%
I spend the same amount on marketing as other companies in my industry. 43.57%
I don’t know how much companies in my industry spend on marketing. 21.57%

View Industry Data

8 Industry Marketing Spend Compared to Industry

Banking/Financial

Marketing Spend Compared to Industry % of Answers
I spend more on marketing than other companies in my industry. 16.00%
I spend less on marketing than other companies in my industry. 12.00%
I spend the same amount on marketing as other companies in my industry. 50.00%
I don’t know how much companies in my industry spend on marketing. 22.00%

Computer Software

Marketing Spend Compared to Industry % of Answers
I spend more on marketing than other companies in my industry. 30.00%
I spend less on marketing than other companies in my industry. 18.00%
I spend the same amount on marketing as other companies in my industry. 44.00%
I don’t know how much companies in my industry spend on marketing. 8.00%

Construction

Marketing Spend Compared to Industry % of Answers
I spend more on marketing than other companies in my industry. 22.00%
I spend less on marketing than other companies in my industry. 26.00%
I spend the same amount on marketing as other companies in my industry. 42.00%
I don’t know how much companies in my industry spend on marketing. 10.00%

Education

Marketing Spend Compared to Industry % of Answers
I spend more on marketing than other companies in my industry. 10.00%
I spend less on marketing than other companies in my industry. 14.00%
I spend the same amount on marketing as other companies in my industry. 54.00%
I don’t know how much companies in my industry spend on marketing. 22.00%

Energy/Utilities/Oil and Gas

Marketing Spend Compared to Industry % of Answers
I spend more on marketing than other companies in my industry. 14.00%
I spend less on marketing than other companies in my industry. 24.00%
I spend the same amount on marketing as other companies in my industry. 36.00%
I don’t know how much companies in my industry spend on marketing. 26.00%

Government/Public Sector

Marketing Spend Compared to Industry % of Answers
I spend more on marketing than other companies in my industry. 8.00%
I spend less on marketing than other companies in my industry. 24.00%
I spend the same amount on marketing as other companies in my industry. 34.00%
I don’t know how much companies in my industry spend on marketing. 34.00%

Health Care and Social Assistance

Marketing Spend Compared to Industry % of Answers
I spend more on marketing than other companies in my industry. 8.00%
I spend less on marketing than other companies in my industry. 20.00%
I spend the same amount on marketing as other companies in my industry. 54.00%
I don’t know how much companies in my industry spend on marketing. 18.00%

Hospitality/Tourism

Marketing Spend Compared to Industry % of Answers
I spend more on marketing than other companies in my industry. 10.00%
I spend less on marketing than other companies in my industry. 20.00%
I spend the same amount on marketing as other companies in my industry. 44.00%
I don’t know how much companies in my industry spend on marketing. 26.00%

Information Technology/IT

Marketing Spend Compared to Industry % of Answers
I spend more on marketing than other companies in my industry. 50.00%
I spend less on marketing than other companies in my industry. 12.00%
I spend the same amount on marketing as other companies in my industry. 32.00%
I don’t know how much companies in my industry spend on marketing. 6.00%

Manufacturing

Marketing Spend Compared to Industry % of Answers
I spend more on marketing than other companies in my industry. 14.00%
I spend less on marketing than other companies in my industry. 16.00%
I spend the same amount on marketing as other companies in my industry. 46.00%
I don’t know how much companies in my industry spend on marketing. 24.00%

Non Profit/Social services

Marketing Spend Compared to Industry % of Answers
I spend more on marketing than other companies in my industry. 2.00%
I spend less on marketing than other companies in my industry. 20.00%
I spend the same amount on marketing as other companies in my industry. 36.00%
I don’t know how much companies in my industry spend on marketing. 42.00%

Real Estate/Property

Marketing Spend Compared to Industry % of Answers
I spend more on marketing than other companies in my industry. 12.00%
I spend less on marketing than other companies in my industry. 18.00%
I spend the same amount on marketing as other companies in my industry. 50.00%
I don’t know how much companies in my industry spend on marketing. 20.00%

Retail

Marketing Spend Compared to Industry % of Answers
I spend more on marketing than other companies in my industry. 18.00%
I spend less on marketing than other companies in my industry. 18.00%
I spend the same amount on marketing as other companies in my industry. 42.00%
I don’t know how much companies in my industry spend on marketing. 22.00%

Transportation and Warehousing

Marketing Spend Compared to Industry % of Answers
I spend more on marketing than other companies in my industry. 16.00%
I spend less on marketing than other companies in my industry. 16.00%
I spend the same amount on marketing as other companies in my industry. 46.00%
I don’t know how much companies in my industry spend on marketing. 22.00%
notes icon

Industry Budget Trends

Industries that don’t know how much other companies spend:

  • Government/public sector
  • Nonprofit/social services

Industries that spend more on marketing than other companies:

  • Computer software
  • IT

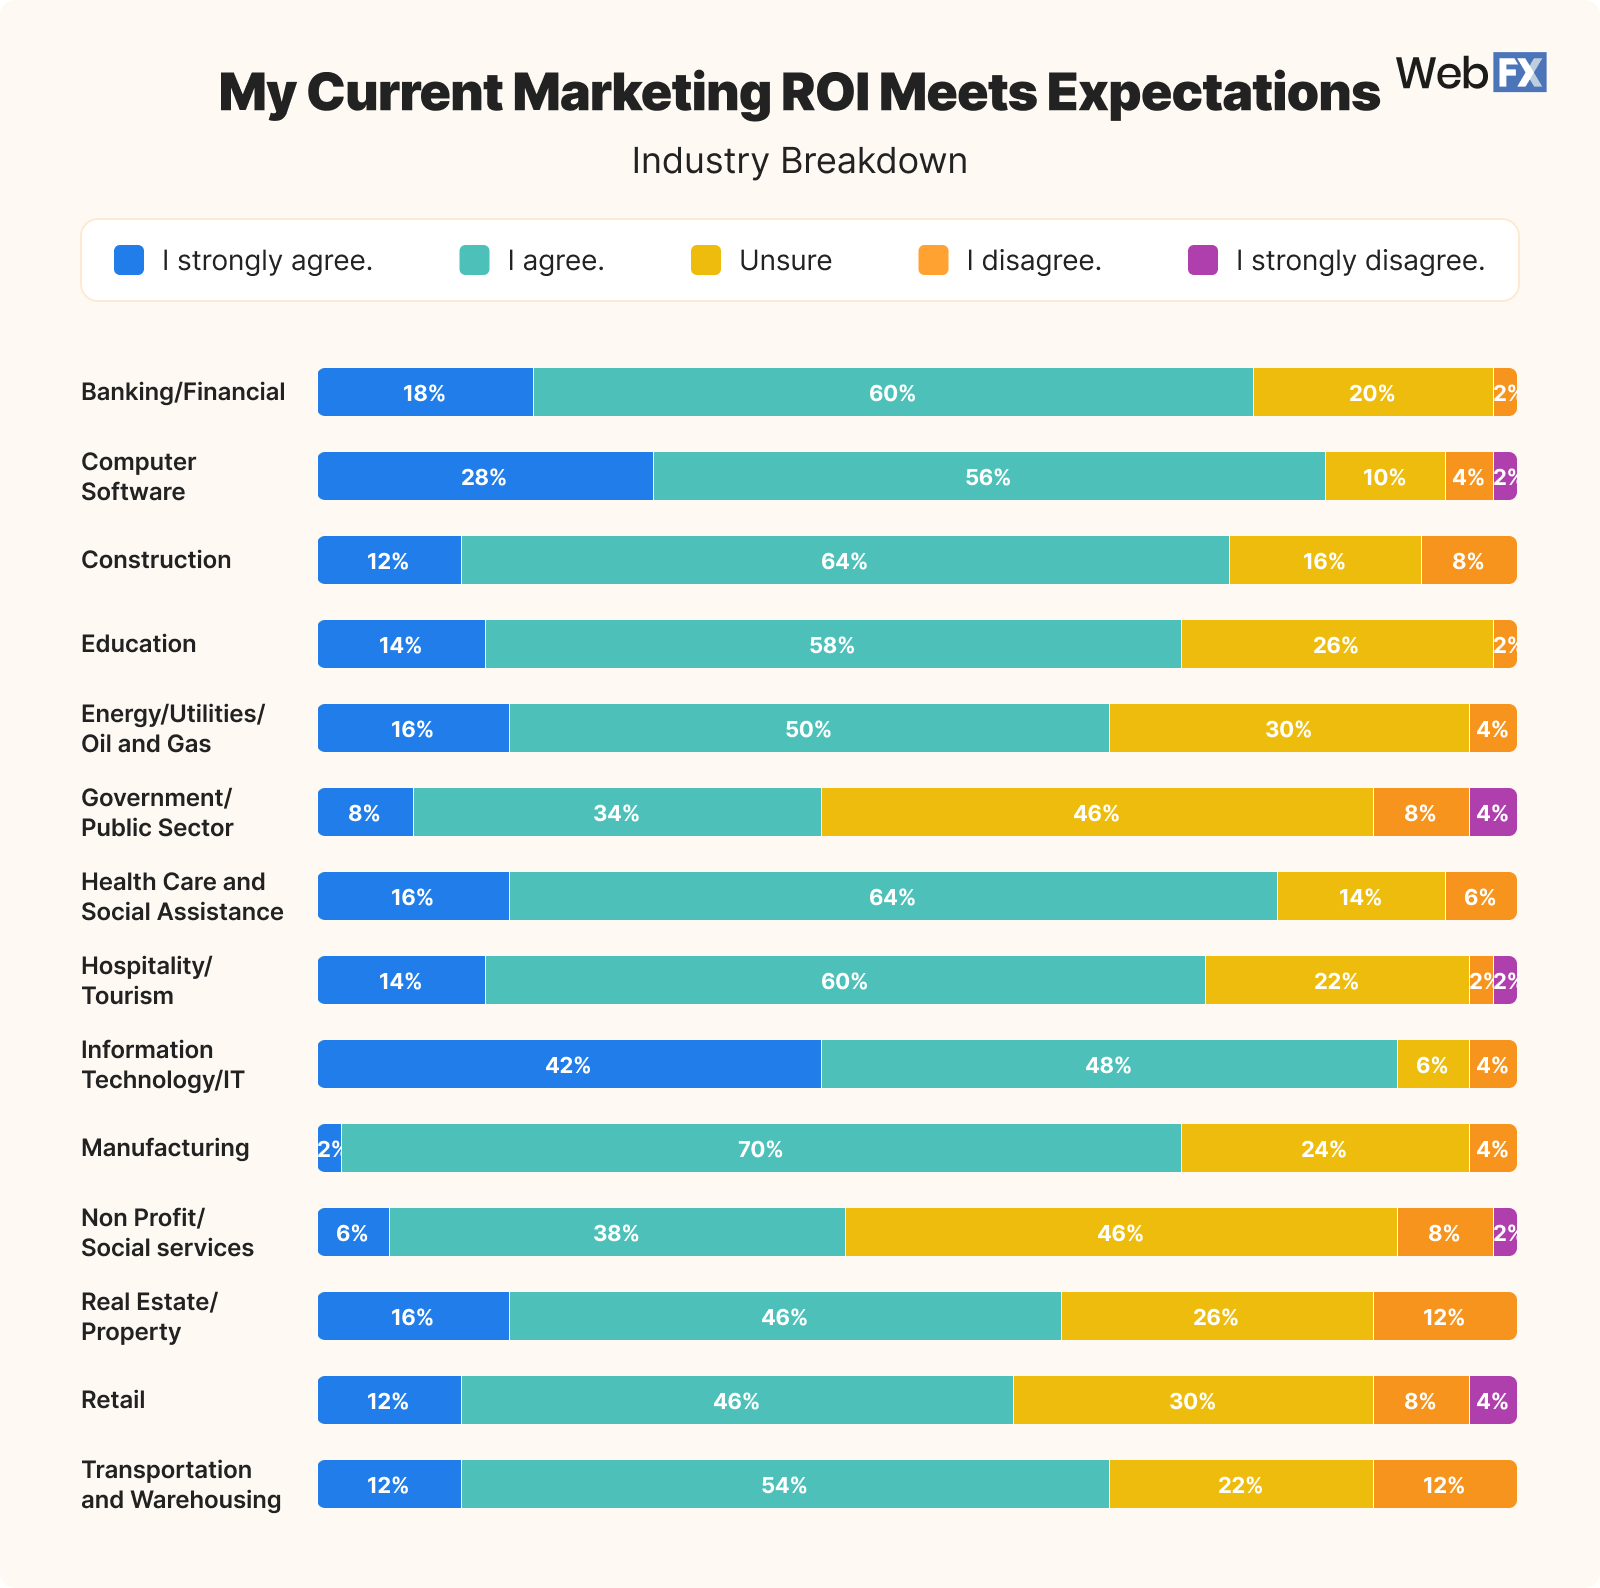
9. Expectations of current marketing ROI

For this part of the survey, we wanted to see how business leaders felt about their current marketing ROI:

9 My Current Marketing ROI Meets Expectations

What does this mean for me?

Overall, these answers reflect a positive impact from digital marketing strategies. Nearly 70% of companies agree that their marketing ROI meets expectations, pointing to the right strategies, investments, and tracking methods for these companies.

Those who are unsure (24.14%) might not be aware of their ROI or have the right tools to analyze digital marketing performance. These companies may not have robust analytics or clear benchmarks for evaluating performance. Though their ROI could be positive, they don’t have the right tracking tools in place to measure it, which can affect their investment decisions.

Only 7% of company respondents don’t agree that their ROI meets expectations. This selection signals a need for optimization, as these businesses may have issues with strategy and execution or unrealistic expectations for what their ROI should look like.

Again, tools like RevenueCloudFX make tracking your ROI easy. With campaign monitoring software, you can see what steps prospects take on the way to converting, and find the best strategies to invest in to grow your ROI.

View Source Data

My Current Marketing ROI Meets Expectations % of Answers
I strongly agree. 15.43%
I agree. 53.43%
Unsure 24.14%
I disagree. 6.00%
I strongly disagree. 1.00%

View Industry Data

9 Industry My Current Marketing ROI Meets Expectations

Banking/Financial

My Current Marketing ROI Meets Expectations % of Answers
I strongly agree. 18.00%
I agree. 60.00%
Unsure 20.00%
I disagree. 2.00%
I strongly disagree. 0.00%

Computer Software

My Current Marketing ROI Meets Expectations % of Answers
I strongly agree. 28.00%
I agree. 56.00%
Unsure 10.00%
I disagree. 4.00%
I strongly disagree. 2.00%

Construction

My Current Marketing ROI Meets Expectations % of Answers
I strongly agree. 12.00%
I agree. 64.00%
Unsure 16.00%
I disagree. 8.00%
I strongly disagree. 0.00%

Education

My Current Marketing ROI Meets Expectations % of Answers
I strongly agree. 14.00%
I agree. 58.00%
Unsure 26.00%
I disagree. 2.00%
I strongly disagree. 0.00%

Energy/Utilities/Oil and Gas

My Current Marketing ROI Meets Expectations % of Answers
I strongly agree. 16.00%
I agree. 50.00%
Unsure 30.00%
I disagree. 4.00%
I strongly disagree. 0.00%

Government/Public Sector

My Current Marketing ROI Meets Expectations % of Answers
I strongly agree. 8.00%
I agree. 34.00%
Unsure 46.00%
I disagree. 8.00%
I strongly disagree. 4.00%

Health Care and Social Assistance

My Current Marketing ROI Meets Expectations % of Answers
I strongly agree. 16.00%
I agree. 64.00%
Unsure 14.00%
I disagree. 6.00%
I strongly disagree. 0.00%

Hospitality/Tourism

My Current Marketing ROI Meets Expectations % of Answers
I strongly agree. 14.00%
I agree. 60.00%
Unsure 22.00%
I disagree. 2.00%
I strongly disagree. 2.00%

Information Technology/IT

My Current Marketing ROI Meets Expectations % of Answers
I strongly agree. 42.00%
I agree. 48.00%
Unsure 6.00%
I disagree. 4.00%
I strongly disagree. 0.00%

Manufacturing

My Current Marketing ROI Meets Expectations % of Answers
I strongly agree. 2.00%
I agree. 70.00%
Unsure 24.00%
I disagree. 4.00%
I strongly disagree. 0.00%

Non Profit/Social services

My Current Marketing ROI Meets Expectations % of Answers
I strongly agree. 6.00%
I agree. 38.00%
Unsure 46.00%
I disagree. 8.00%
I strongly disagree. 2.00%

Real Estate/Property

My Current Marketing ROI Meets Expectations % of Answers
I strongly agree. 16.00%
I agree. 46.00%
Unsure 26.00%
I disagree. 12.00%
I strongly disagree. 0.00%

Retail

My Current Marketing ROI Meets Expectations % of Answers
I strongly agree. 12.00%
I agree. 46.00%
Unsure 30.00%
I disagree. 8.00%
I strongly disagree. 4.00%

Transportation and Warehousing

My Current Marketing ROI Meets Expectations % of Answers
I strongly agree. 12.00%
I agree. 54.00%
Unsure 22.00%
I disagree. 12.00%
I strongly disagree. 0.00%

notes icon

Industry Budget Trends

Industries that are the most unsure of whether ROI meets expectations:

  • Energy/utilities/oil and gas
  • Government/ public sector
  • Nonprofit/ social services


Industries that strongly disagree that their ROI meets expectations:

  • Computer software
  • Government/ public sector
  • Hospitality/tourism
  • Nonprofit/ social services
  • Retail

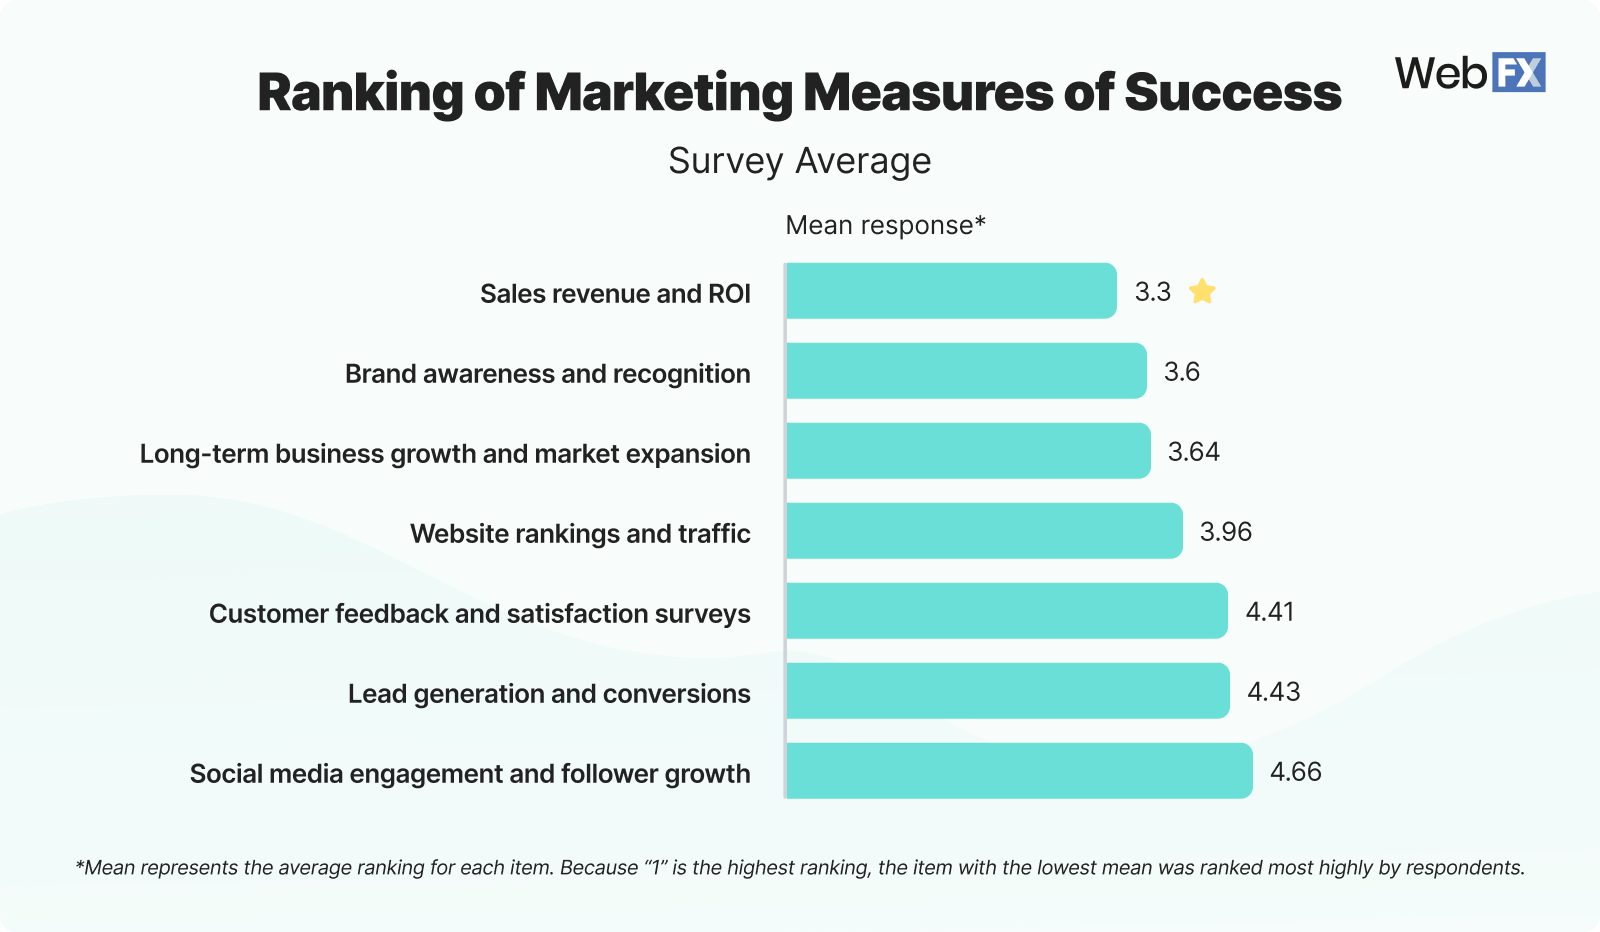
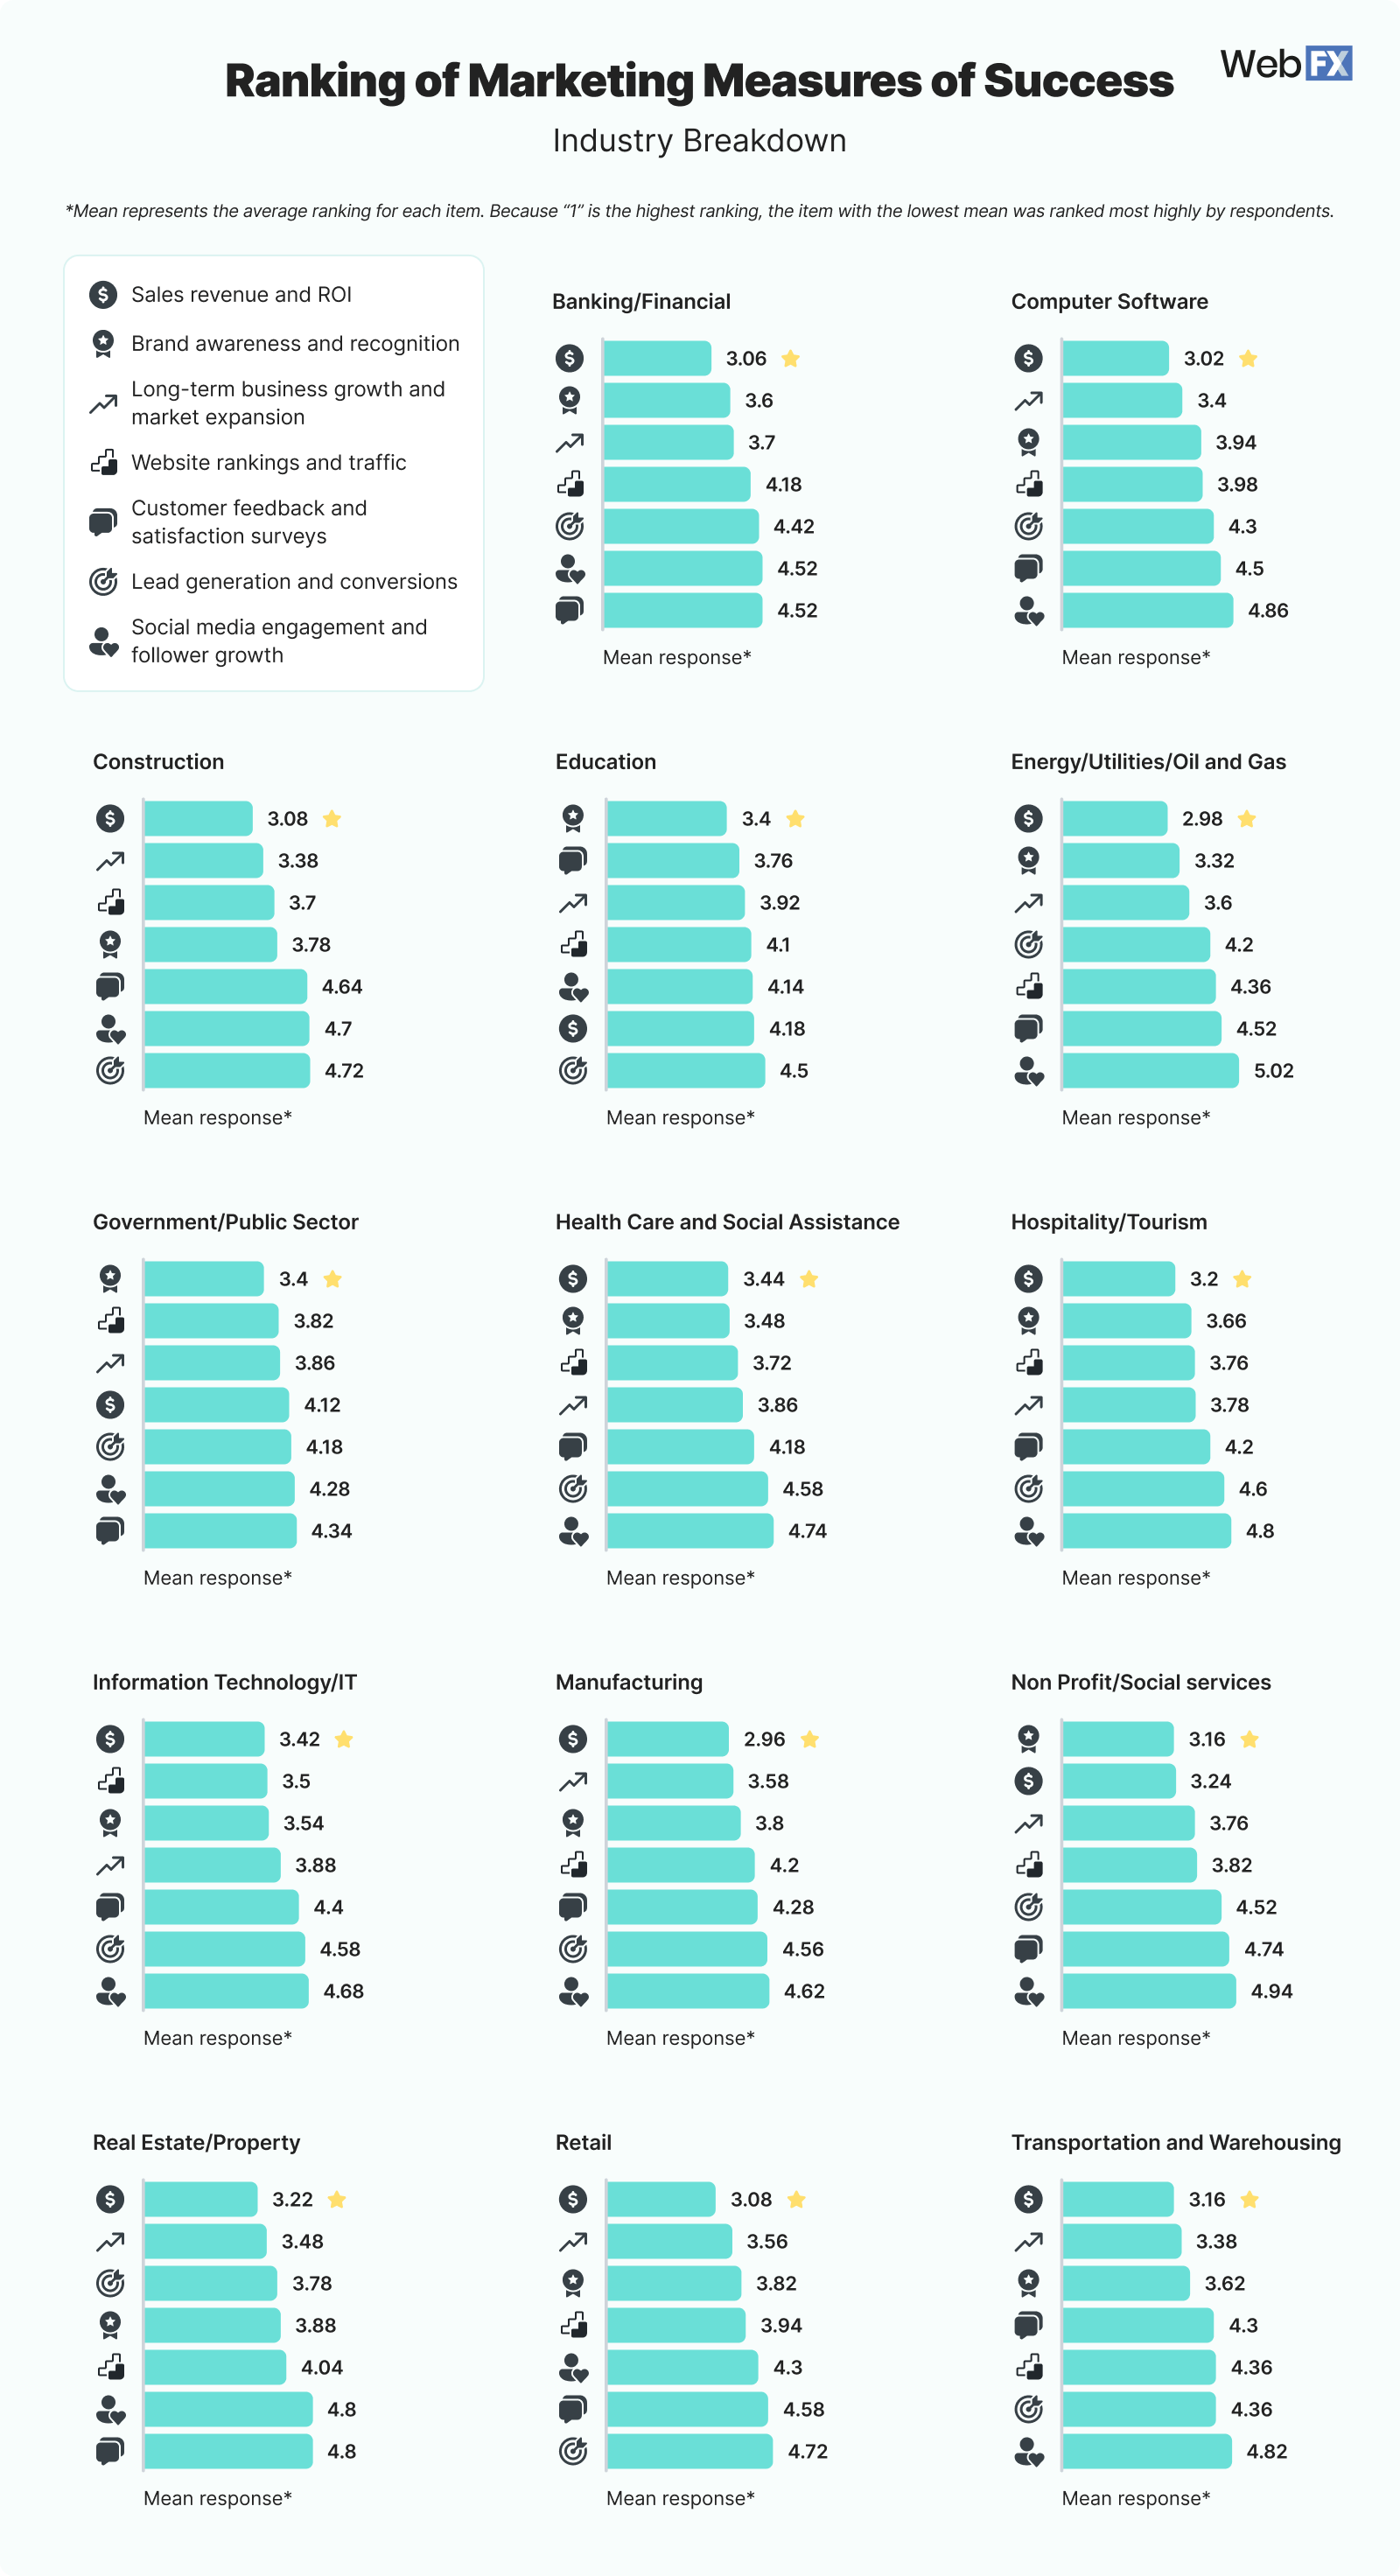
10. Marketing measures of success

Below, we can see what companies look for to determine whether their marketing campaigns are successful. 

10 Ranking of Marketing Measures of Success

What does this mean for me?

Sales revenue and ROI are the greatest indicators of success. While the other factors on the list can lead to business success, they all contribute to revenue in the end. 

Ultimately, if your budget is the most important factor when it comes to marketing, you need the sales to have revenue to put toward marketing. Sales and ROI are the most tangible indicators of marketing effectiveness, and they tie directly to your bottom line and growth. They’re also the easiest to track!

For example, say you have a large budget for email marketing, and you currently only look at your open rate to determine your marketing’s success. You can have a high open rate, but that doesn’t mean your email marketing is driving revenue. You should be tracking your open rate, click-through rate (CTR), and conversions of leads from emails to see how your investment is generating revenue. 

Companies prioritize metrics that align with their overarching business objectives, whether that’s growth, profitability, or market leadership. You can so consider industry and business stage (startups might emphasize brand awareness, while mature companies focus on ROI) when thinking about why companies value the metrics they do. 

And, just because a metric isn’t the top priority doesn’t mean it doesn’t matter. Lower-ranked metrics may still be valuable supporting indicators rather than primary measures of success.

View Source Data

Measure of success

Mean Response

Sales revenue and ROI

3.3

Brand awareness and recognition

3.6

Long-term business growth and market expansion

3.64

Website rankings and traffic

3.96

Customer feedback and satisfaction surveys

4.41

Lead generation and conversions

4.43

Social media engagement and follower growth

4.66

View Industry Data

10 Industry Ranking of Marketing Measures of Success

Banking/Financial

Measure of Success Mean Response
Sales revenue and ROI 3.06
Brand awareness and recognition 3.6
Long-term business growth and market expansion 3.7
Website rankings and traffic 4.18
Lead generation and conversions 4.42
Social media engagement and follower growth 4.52
Customer feedback and satisfaction surveys 4.52

Computer Software

Measure of Success Mean Response
Sales revenue and ROI 3.02
Long-term business growth and market expansion 3.4
Brand awareness and recognition 3.94
Website rankings and traffic 3.98
Lead generation and conversions 4.3
Customer feedback and satisfaction surveys 4.5
Social media engagement and follower growth 4.86

Construction

Measure of Success Mean Response
Sales revenue and ROI 3.08
Long-term business growth and market expansion 3.38
Website rankings and traffic 3.7
Brand awareness and recognition 3.78
Customer feedback and satisfaction surveys 4.64
Social media engagement and follower growth 4.7
Lead generation and conversions 4.72

Education

Measure of Success Mean Response
Brand awareness and recognition 3.4
Customer feedback and satisfaction surveys 3.76
Long-term business growth and market expansion 3.92
Website rankings and traffic 4.1
Social media engagement and follower growth 4.14
Sales revenue and ROI 4.18
Lead generation and conversions 4.5

Energy/Utilities/Oil and Gas

Measure of Success Mean Response
Sales revenue and ROI 2.98
Brand awareness and recognition 3.32
Long-term business growth and market expansion 3.6
Lead generation and conversions 4.2
Website rankings and traffic 4.36
Customer feedback and satisfaction surveys 4.52
Social media engagement and follower growth 5.02

Government/Public Sector

Measure of Success Mean Response
Brand awareness and recognition 3.4
Website rankings and traffic 3.82
Long-term business growth and market expansion 3.86
Sales revenue and ROI 4.12
Lead generation and conversions 4.18
Social media engagement and follower growth 4.28
Customer feedback and satisfaction surveys 4.34

Health Care and Social Assistance

Measure of Success Mean Response
Sales revenue and ROI 3.44
Brand awareness and recognition 3.48
Website rankings and traffic 3.72
Long-term business growth and market expansion 3.86
Customer feedback and satisfaction surveys 4.18
Lead generation and conversions 4.58
Social media engagement and follower growth 4.74

Hospitality/Tourism

Measure of Success Mean Response
Sales revenue and ROI 3.2
Brand awareness and recognition 3.66
Website rankings and traffic 3.76
Long-term business growth and market expansion 3.78
Customer feedback and satisfaction surveys 4.2
Lead generation and conversions 4.6
Social media engagement and follower growth 4.8

Information Technology/IT

Measure of Success Mean Response
Sales revenue and ROI 3.42
Website rankings and traffic 3.5
Brand awareness and recognition 3.54
Long-term business growth and market expansion 3.88
Customer feedback and satisfaction surveys 4.4
Lead generation and conversions 4.58
Social media engagement and follower growth 4.68

Manufacturing

Measure of Success Mean Response
Sales revenue and ROI 2.96
Long-term business growth and market expansion 3.58
Brand awareness and recognition 3.8
Website rankings and traffic 4.2
Customer feedback and satisfaction surveys 4.28
Lead generation and conversions 4.56
Social media engagement and follower growth 4.62

Non Profit/Social services

Measure of Success Mean Response
Brand awareness and recognition 3.16
Sales revenue and ROI 3.24
Long-term business growth and market expansion 3.58
Website rankings and traffic 3.82
Lead generation and conversions 4.52
Customer feedback and satisfaction surveys 4.74
Social media engagement and follower growth 4.94

Real Estate/Property

Measure of Success Mean Response
Sales revenue and ROI 3.22
Long-term business growth and market expansion 3.48
Lead generation and conversions 3.78
Brand awareness and recognition 3.88
Website rankings and traffic 4.04
Social media engagement and follower growth 4.8
Customer feedback and satisfaction surveys 4.8

Retail

Measure of Success Mean Response
Sales revenue and ROI 3.08
Long-term business growth and market expansion 3.56
Brand awareness and recognition 3.82
Website rankings and traffic 3.94
Social media engagement and follower growth 4.3
Customer feedback and satisfaction surveys 4.58
Lead generation and conversions 4.72

Transportation and Warehousing

Measure of Success Mean Response
Sales revenue and ROI 3.16
Long-term business growth and market expansion 3.38
Brand awareness and recognition 3.62
Customer feedback and satisfaction surveys 4.3
Website rankings and traffic 4.36
Lead generation and conversions 4.36
Social media engagement and follower growth 4.82

notes icon

Industry Budget Trends

Industries’ least important measures of success:

  • Social media engagement and follower growth (8/14)
  • Customer feedback and satisfaction surveys (3/14)
  • Lead generation (3/14)

Industries that ranked brand recognition as the #1 measure of success:

  • Education
  • Government/ public sector
  • Nonprofit/ social services

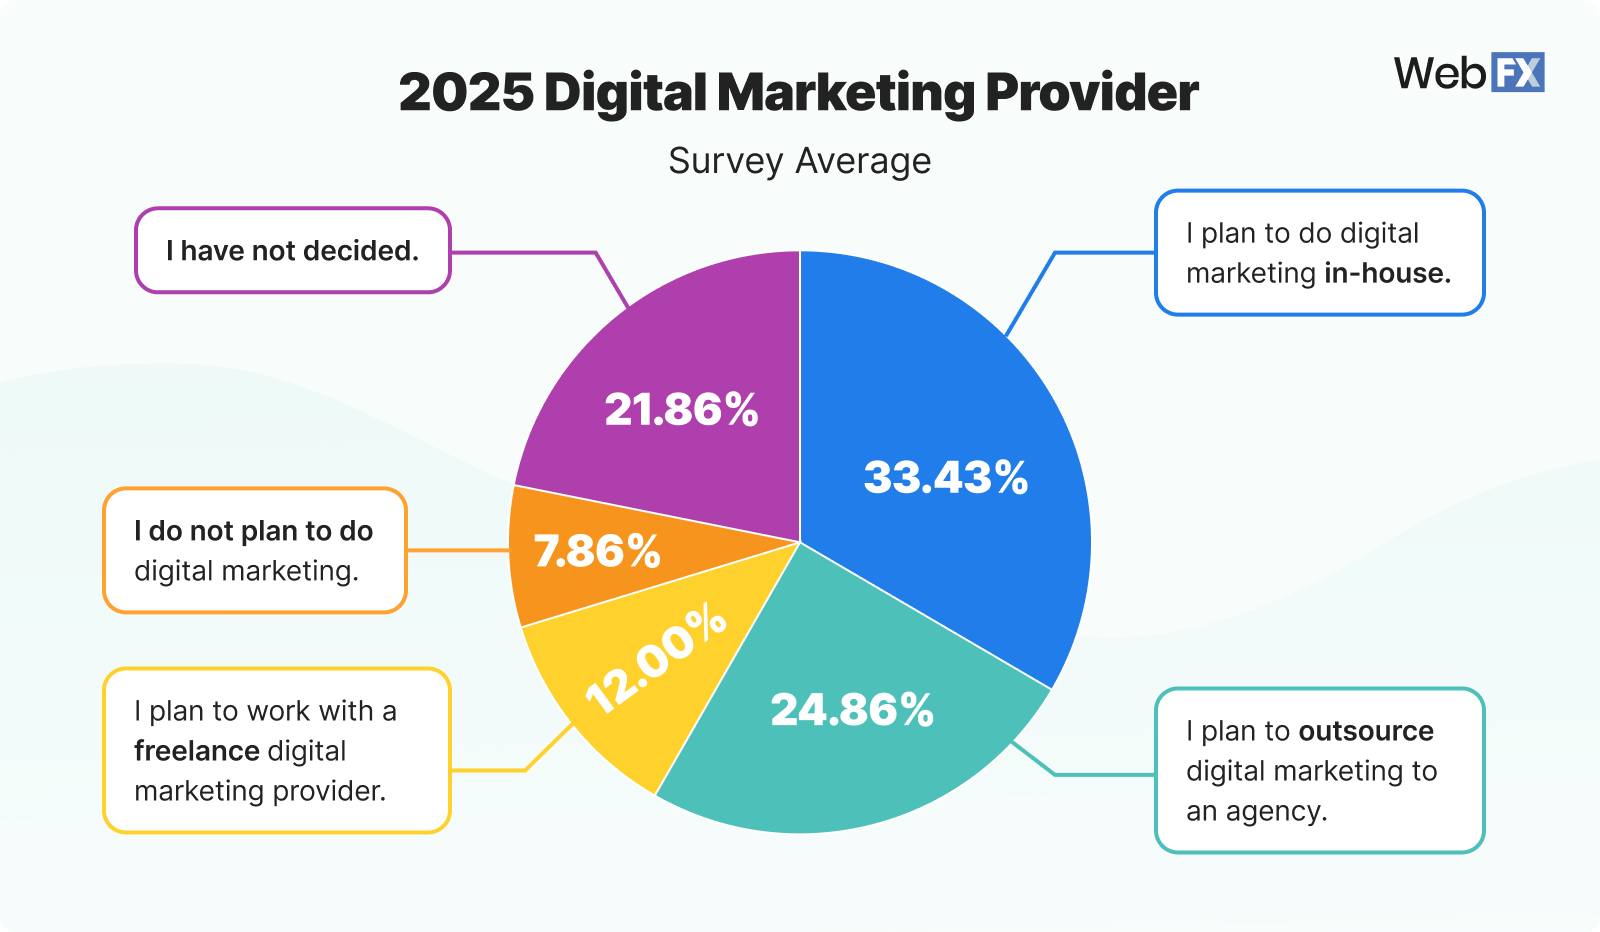
11. 2025 digital marketing provider

How are people planning to do digital marketing in the coming year? Here’s how they answered: 

11 2025 Digital Marketing Provider

What does this mean for me?

Nearly 34% of companies prefer to control their digital marketing in-house. Companies value control over their branding, campaigns, and customer interactions. And, in-house teams offer direct collaboration with other departments (e.g., product development, sales).

The challenges to this approach to digital marketing, of course, are building and maintaining in-house expertise through training, tools, and recruitment. You must also keep up with rapidly evolving digital trends. 

This focus on in-house marketing contributes to the overall push for bigger marketing budgets for [2025]. Many companies want to save and control their budget and marketing by operating in-house, but they then spend more money trying to maintain the same quality that an agency offers. 

We then have those companies that haven’t decided, which is the third-largest group. Companies in this group likely lack clarity about their needs, budget, or expected ROI. They may not have any internal expertise or confidence in external providers, like agencies and freelancers, for fear of brand misalignment. However, delaying decisions on digital marketing could result in missed growth opportunities and an ROI that does not meet expectations.

Companies who do not plan to do digital marketing are likely unaware of the benefits and reasons to invest. They risk losing out on valuable channels for customer acquisition, retention, and engagement. Even if they don’t jump into a strategy with an agency, understanding the benefits of digital marketing could change their approach for the following year. 

notes icon

Industry Budget Trends

Most undecided industries:

  • Manufacturing
  • Nonprofit/ social services
  • Energy/utilities/oil and gas

Industries most likely to not do digital marketing:

  • Government/public sector
  • Education
  • Energy/utilities/oil and gas
  • Nonprofit/social services
  • Real estate/property

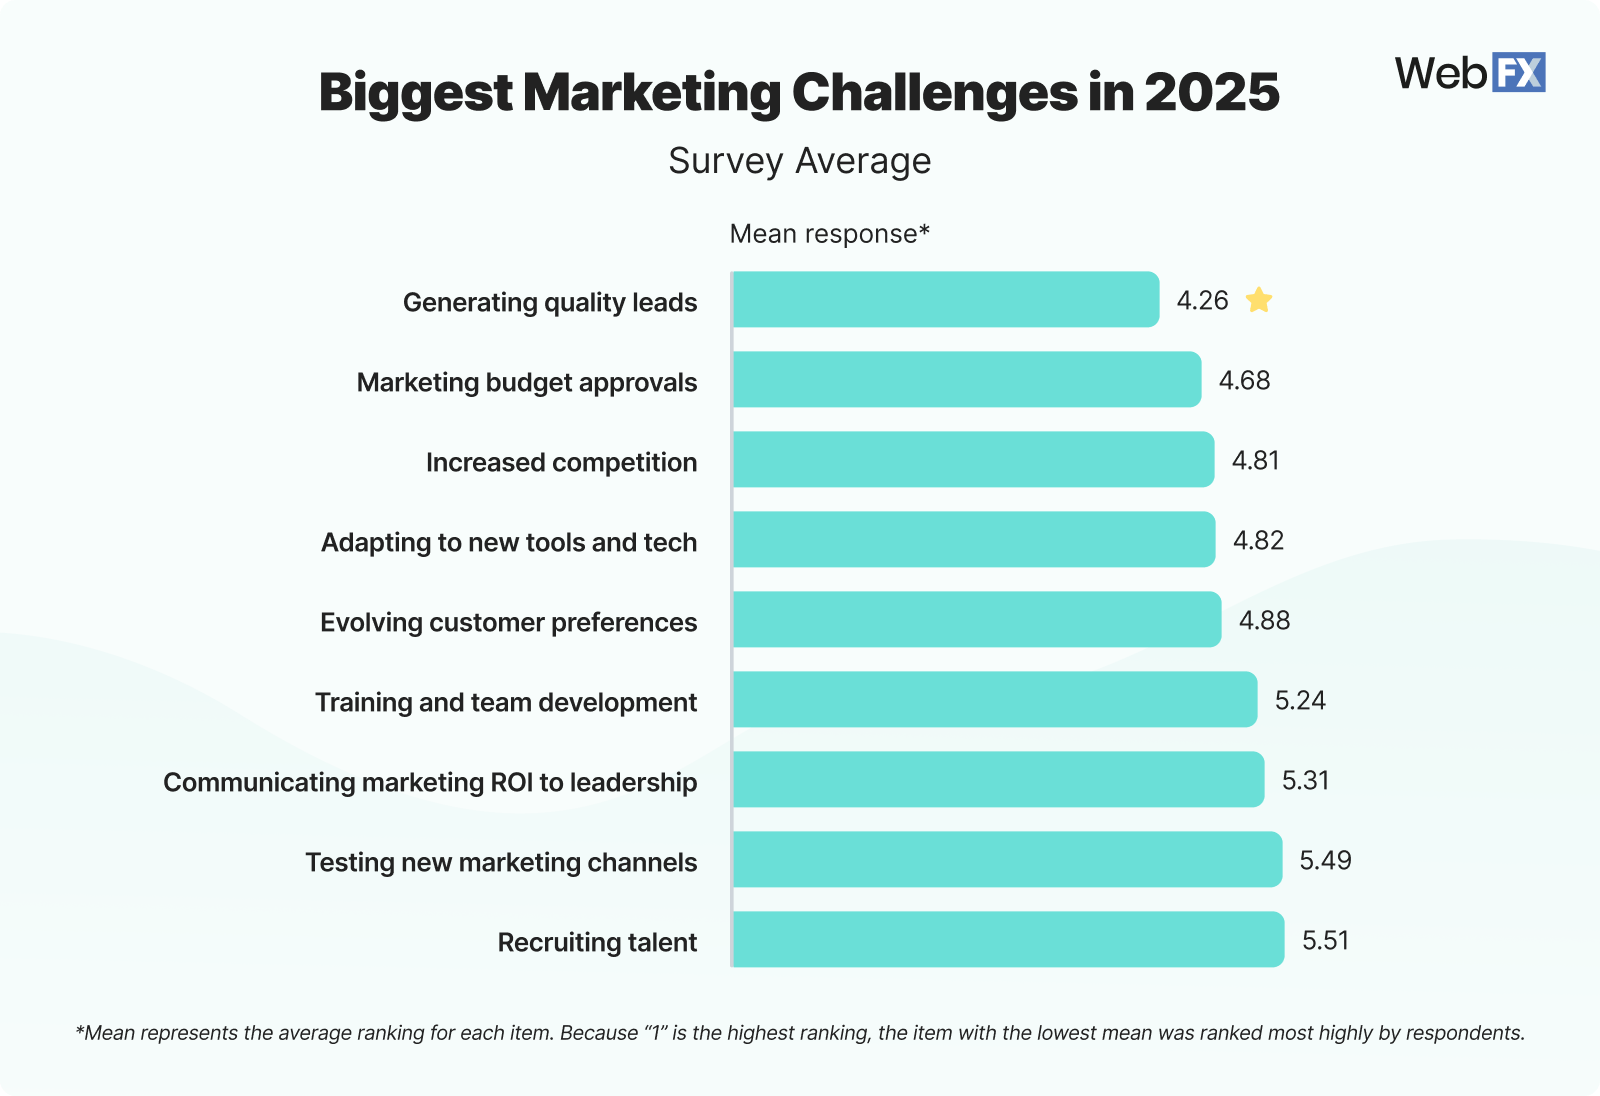
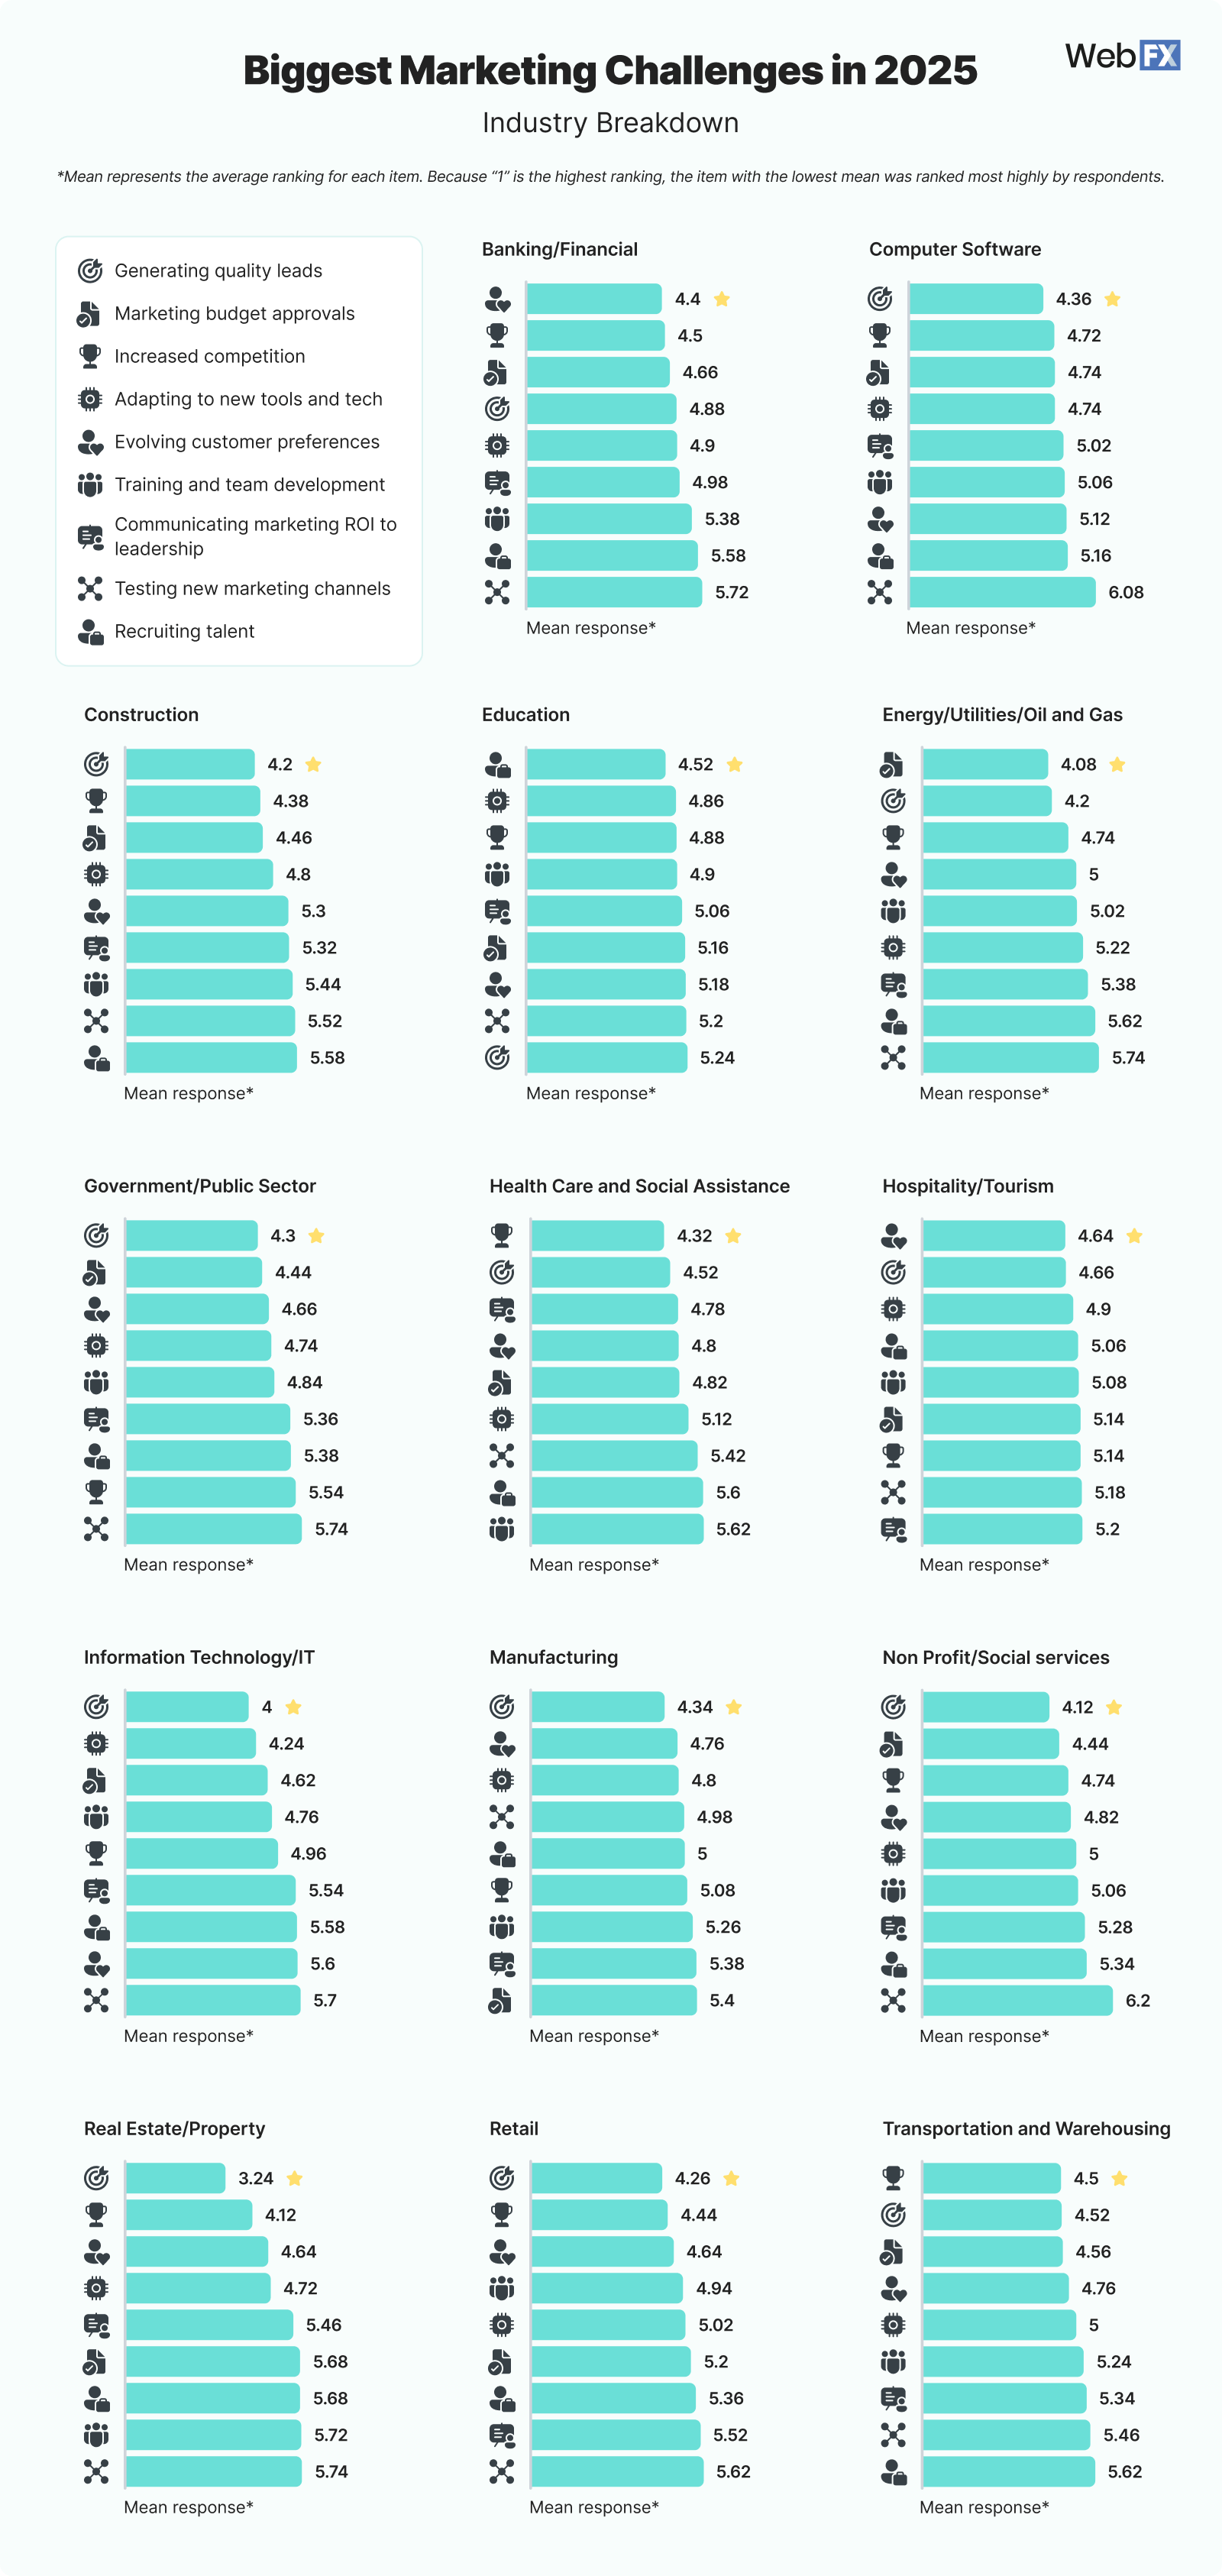
12. Biggest marketing challenges in 2025

Next, let’s take a look at the biggest marketing challenges for companies in 2025, as well as how those could impact their digital marketing budget:

12 biggest marketing challenge in 2025

What does this mean for me?

Above all, generating leads proves to be the biggest challenge companies are facing for 2025. Businesses need to invest more effort and resources to differentiate their messaging and offerings. Like we have discussed above, the problem with lead generation comes from a lack of resources, understanding of marketing strategies, and tracking capabilities.

While reaching a large audience is easy with digital marketing, identifying prospects likely to convert (high-quality leads) is much harder. If you rely on insufficient or outdated information, you will waste resources on low-quality leads. 

Generating high-quality leads often requires significant investment in tools and channels, so businesses with limited budgets may struggle to allocate sufficient resources to lead generation efforts. Those companies who are undecided on their marketing budget or unhappy with their ROI will feel the greatest stress from this trend in the coming year. 

Lead generation services and strategies that can help companies find and target those most likely to need their products and services. 

View Source Data

Marketing challenge for 2025 Mean response
Generating quality leads 4.26
Marketing budget approvals 4.68
Increased competition 4.81
Adapting to new tools and tech 4.82
Evolving customer preferences 4.88
Training and team development 5.24
Communicating marketing ROI to leadership 5.31
Testing new marketing channels 5.49
Recruiting talent 5.51

View Industry Data

12 Industry biggest marketing challenge in 2025

Banking/Financial

Answer Mean Response
Evolving customer preferences 4.4
Increased competition 4.5
Marketing budget approvals 4.66
Generating quality leads 4.88
Adapting to new tools and tech 4.9
Communicating marketing ROI to leadership 4.98
Training and team development 5.38
Recruiting talent 5.58
Testing new marketing channels 5.72

Computer Software

Answer Mean Response
Generating quality leads 4.36
Increased competition 4.72
Marketing budget approvals 4.74
Adapting to new tools and tech 4.74
Communicating marketing ROI to leadership 5.02
Training and team development 5.06
Evolving customer preferences 5.12
Recruiting talent 5.16
Testing new marketing channels 6.08

Construction

Answer Mean Response
Generating quality leads 4.2
Increased competition 4.38
Marketing budget approvals 4.46
Adapting to new tools and tech 4.8
Evolving customer preferences 5.3
Communicating marketing ROI to leadership 5.32
Training and team development 5.44
Testing new marketing channels 5.52
Recruiting talent 5.58

Education

Answer Mean Response
Recruiting talent 4.52
Adapting to new tools and tech 4.86
Increased competition 4.88
Training and team development 4.9
Communicating marketing ROI to leadership 5.06
Marketing budget approvals 5.16
Evolving customer preferences 5.18
Testing new marketing channels 5.2
Generating quality leads 5.24

Energy/Utilities/Oil and Gas

Answer Mean Response
Marketing budget approvals 4.08
Generating quality leads 4.2
Increased competition 4.74
Evolving customer preferences 5
Training and team development 5.02
Adapting to new tools and tech 5.22
Communicating marketing ROI to leadership 5.38
Recruiting talent 5.62
Testing new marketing channels 5.74

Government/Public Sector

Answer Mean Response
Generating quality leads 4.3
Marketing budget approvals 4.44
Evolving customer preferences 4.66
Adapting to new tools and tech 4.74
Training and team development 4.84
Communicating marketing ROI to leadership 5.36
Recruiting talent 5.38
Increased competition 5.54
Testing new marketing channels 5.74

Health Care and Social Assistance

Answer  Mean Response
Increased competition 4.32
Generating quality leads 4.52
Communicating marketing ROI to leadership 4.78
Evolving customer preferences 4.8
Marketing budget approvals 4.82
Adapting to new tools and tech 5.12
Testing new marketing channels 5.42
Recruiting talent 5.6
Training and team development 5.62

Hospitality/Tourism

Answer Mean Response
Evolving customer preferences 4.64
Generating quality leads 4.66
Adapting to new tools and tech 4.9
Recruiting talent 5.06
Training and team development 5.08
Marketing budget approvals 5.14
Increased competition 5.14
Testing new marketing channels 5.18
Communicating marketing ROI to leadership 5.2

Information Technology/IT

Answer Mean Response
Generating quality leads 4
Adapting to new tools and tech 4.24
Marketing budget approvals 4.62
Training and team development 4.76
Increased competition 4.96
Communicating marketing ROI to leadership 5.54
Recruiting talent 5.58
Evolving customer preferences 5.6
Testing new marketing channels 5.7

Manufacturing

Answer Mean Response
Generating quality leads 4.34
Evolving customer preferences 4.76
Adapting to new tools and tech 4.8
Testing new marketing channels 4.98
Recruiting talent 5
Increased competition 5.08
Training and team development 5.26
Communicating marketing ROI to leadership 5.38
Marketing budget approvals 5.4

Non Profit/Social services

Answer Mean Response
Generating quality leads 4.12
Marketing budget approvals 4.44
Increased competition 4.74
Evolving customer preferences 4.82
Adapting to new tools and tech 5
Training and team development 5.06
Communicating marketing ROI to leadership 5.28
Recruiting talent 5.34
Testing new marketing channels 6.2

Real Estate/Property

Answer Mean Response
Generating quality leads 3.24
Increased competition 4.12
Evolving customer preferences 4.64
Adapting to new tools and tech 4.72
Communicating marketing ROI to leadership 5.46
Marketing budget approvals 5.68
Recruiting talent 5.68
Training and team development 5.72
Testing new marketing channels 5.74

Retail

Answer Mean Response
Generating quality leads 4.26
Increased competition 4.44
Evolving customer preferences 4.64
Training and team development 4.94
Adapting to new tools and tech 5.02
Marketing budget approvals 5.2
Recruiting talent 5.36
Communicating marketing ROI to leadership 5.52
Testing new marketing channels 5.62

Transportation and Warehousing

Answer Mean Response
Increased competition 4.5
Generating quality leads 4.52
Marketing budget approvals 4.56
Evolving customer preferences 4.76
Adapting to new tools and tech 5
Training and team development 5.24
Communicating marketing ROI to leadership 5.34
Testing new marketing channels 5.46
Recruiting talent 5.62
notes icon

Industry Budget Trends

Industries that did not cite lead generation as their top challenge:

  • Banking/financial (evolving customer preferences)
  • Education (recruiting talent)
  • Energy/utilities/oil and gas (marketing budget approvals)
  • Health care and social assistance (increased competition)
  • Hospitality/tourism (evolving customer preferences)
  • Transportation and warehousing (increased competition)

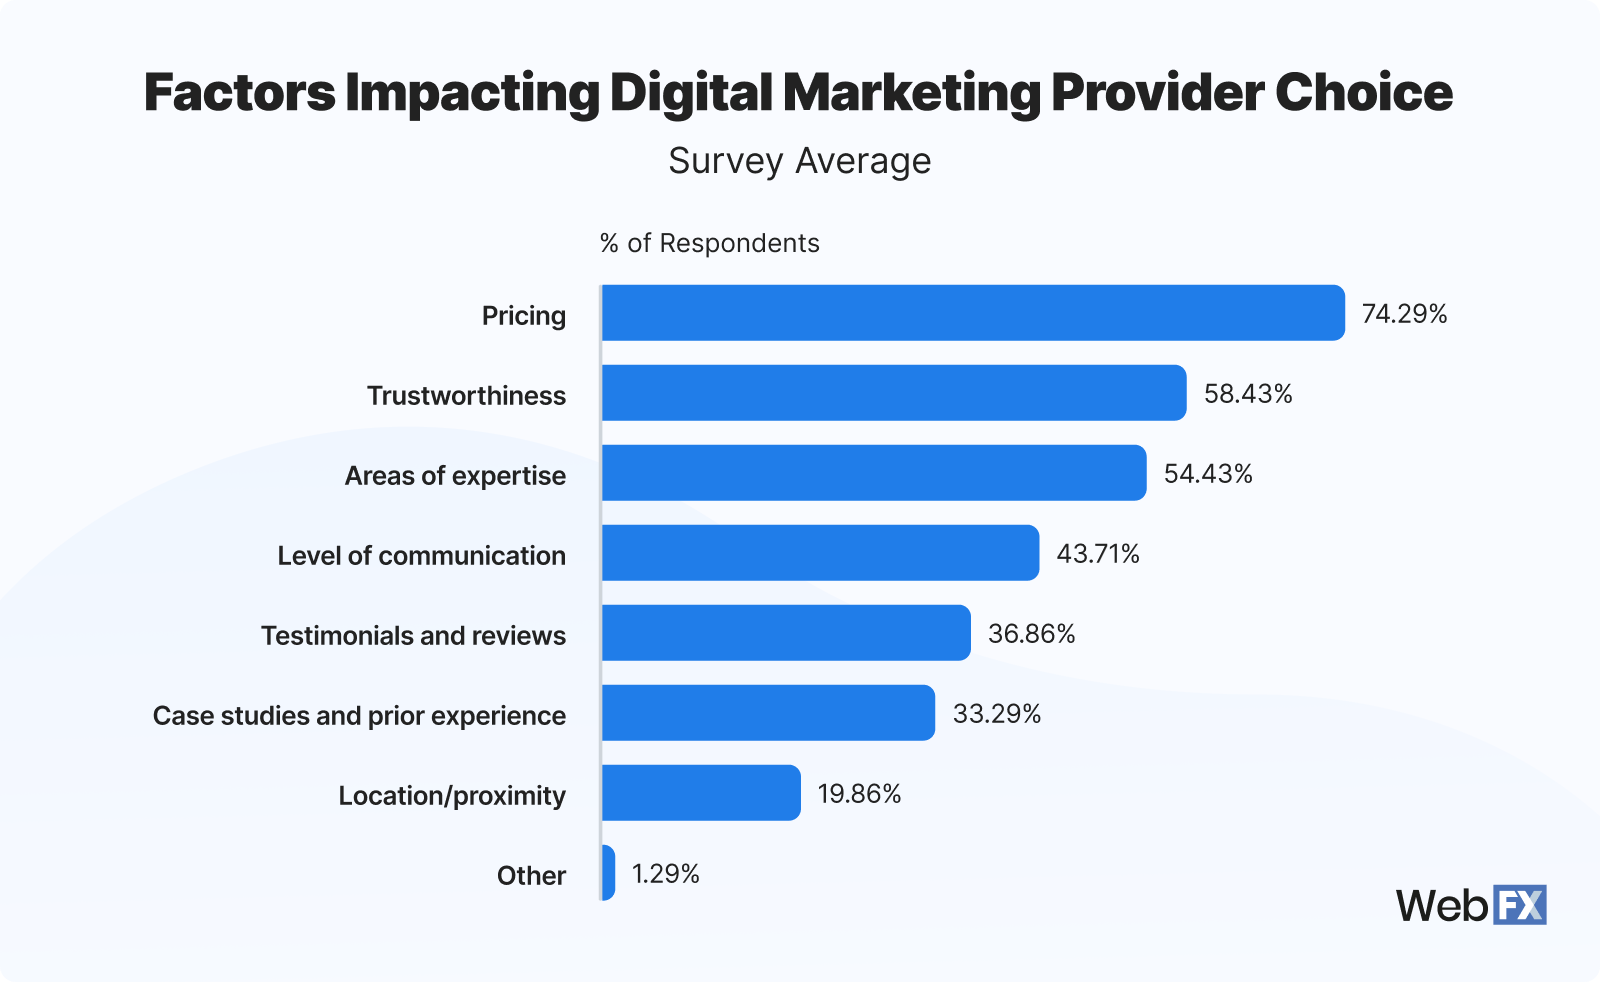
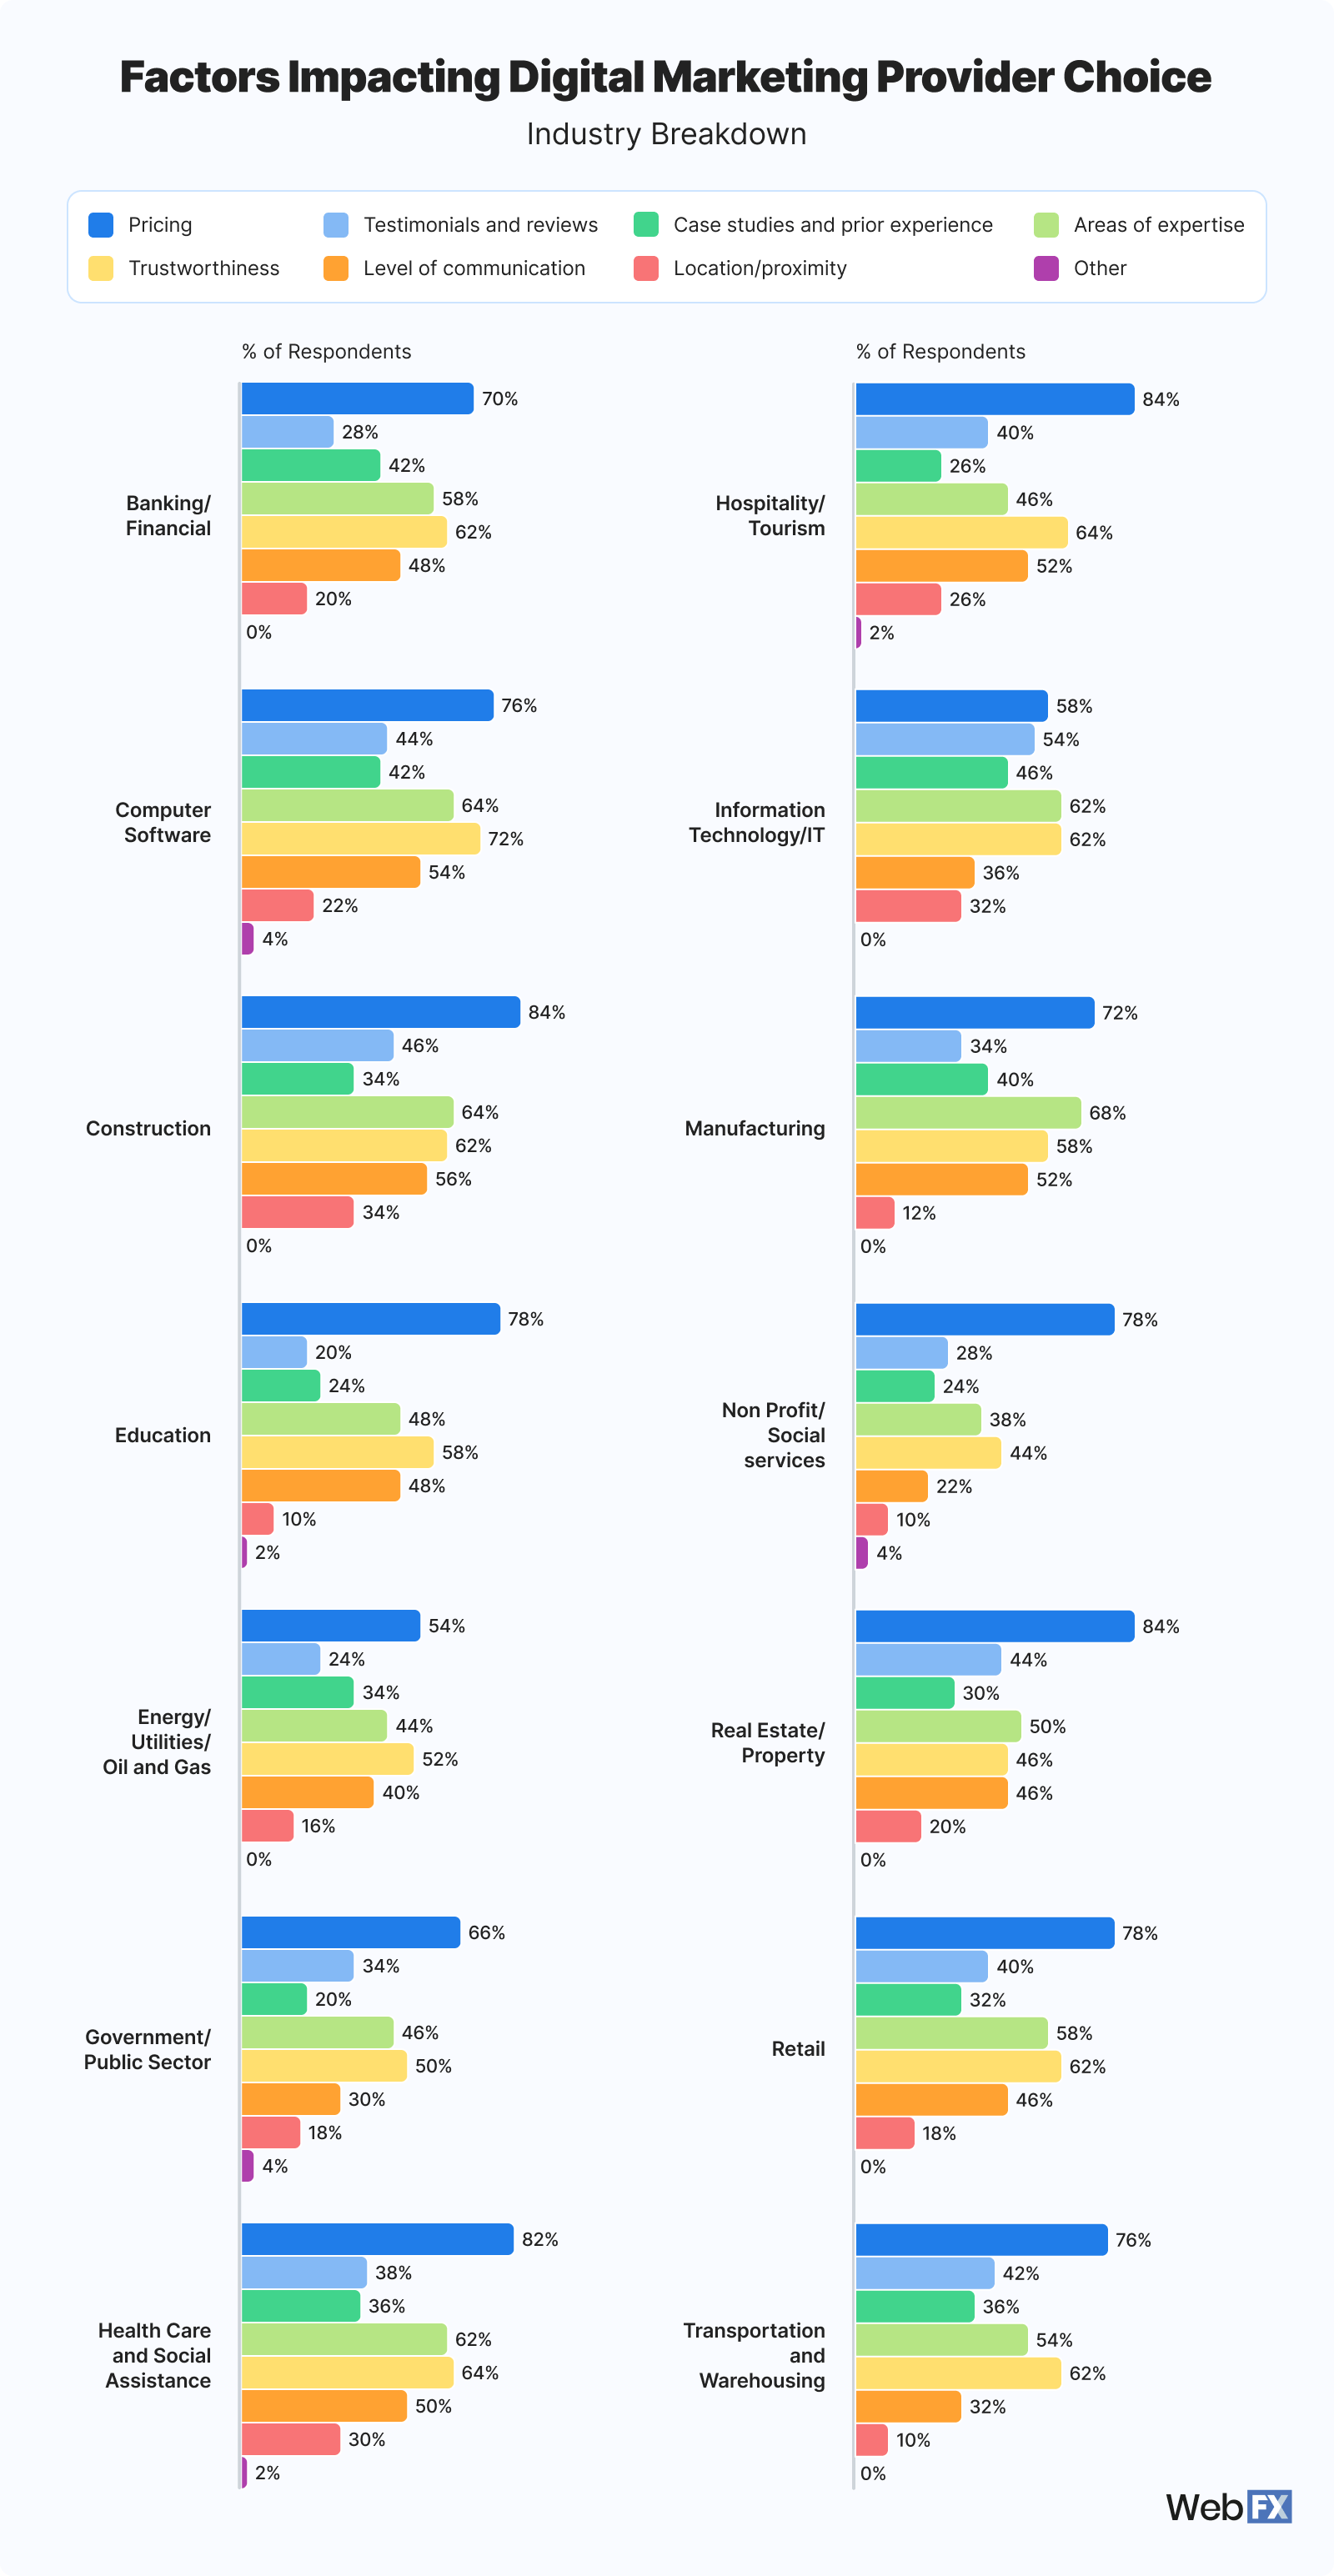
13. Factors impacting digital marketing provider choice

When asked about the factors that impact digital marketing provider choice, respondents gave the following answers:

13 Factors Impacting Digital Marketing Provider Choice

What does this mean for me?

Pricing is the number one factor impacting respondents’ digital marketing provider choice. The choice is practically unanimous, with 74.29% selecting this as a factor. 

As discussed, companies are looking to increase their budget for 2025. However, they are still concerned about pricing, as they want to make sure they are investing in a provider that will bring them greater returns than what they could do in-house.

Companies are budgeting for services and putting in effort to research their providers. As a business, you should be looking for agencies that give you the most bang for your buck and maximize the deliverables you get for the price you pay.

Also, you want to work with agencies that offer transparent, honest pricing for their services. You should know exactly what you’re getting for every dollar you invest. With that transparency, you can learn about an agency’s trustworthiness and expertise, all of which go into their pricing and your results!

View Source Data

Factors Impacting Digital Marketing Provider Choice % of Respondents
Pricing 74.29%
Trustworthiness 58.43%
Areas of expertise 54.43%
Level of communication 43.71%
Testimonials and reviews 36.86%
Case studies and prior experience 33.29%
Location/proximity 19.86%
Other 1.29%

View Industry Data

13 Industry Factors Impacting Digital Marketing Provider Choice

Banking/Financial

Factors Impacting Digital Marketing Provider Choice % of Respondents
Pricing 70.00%
Testimonials and reviews 28.00%
Case studies and prior experience 42.00%
Areas of expertise 58.00%
Trustworthiness 62.00%
Level of communication 48.00%
Location/Proximity 20.00%
Other 0.00%

Computer Software

Factors Impacting Digital Marketing Provider Choice % of Respondents
Pricing 76.00%
Testimonials and reviews 44.00%
Case studies and prior experience 42.00%
Areas of expertise 64.00%
Trustworthiness 72.00%
Level of communication 54.00%
Location/Proximity 22.00%
Other 4.00%

Construction

Factors Impacting Digital Marketing Provider Choice % of Respondents
Pricing 84.00%
Testimonials and reviews 46.00%
Case studies and prior experience 34.00%
Areas of expertise 64.00%
Trustworthiness 62.00%
Level of communication 56.00%
Location/Proximity 34.00%
Other 0.00%

Education

Factors Impacting Digital Marketing Provider Choice % of Respondents
Pricing 78.00%
Testimonials and reviews 20.00%
Case studies and prior experience 24.00%
Areas of expertise 48.00%
Trustworthiness 58.00%
Level of communication 48.00%
Location/Proximity 10.00%
Other 2.00%

Energy/Utilities/Oil and Gas

Factors Impacting Digital Marketing Provider Choice % of Respondents
Pricing 54.00%
Testimonials and reviews 24.00%
Case studies and prior experience 34.00%
Areas of expertise 44.00%
Trustworthiness 52.00%
Level of communication 40.00%
Location/Proximity 16.00%
Other 0.00%

Government/Public Sector

Factors Impacting Digital Marketing Provider Choice % of Respondents
Pricing 66.00%
Testimonials and reviews 34.00%
Case studies and prior experience 20.00%
Areas of expertise 46.00%
Trustworthiness 50.00%
Level of communication 30.00%
Location/Proximity 18.00%
Other 4.00%

Health Care and Social Assistance

Factors Impacting Digital Marketing Provider Choice % of Respondents
Pricing 82.00%
Testimonials and reviews 38.00%
Case studies and prior experience 36.00%
Areas of expertise 62.00%
Trustworthiness 64.00%
Level of communication 50.00%
Location/Proximity 30.00%
Other 2.00%

Hospitality/Tourism

Factors Impacting Digital Marketing Provider Choice % of Respondents
Pricing 84.00%
Testimonials and reviews 40.00%
Case studies and prior experience 26.00%
Areas of expertise 46.00%
Trustworthiness 64.00%
Level of communication 52.00%
Location/Proximity 26.00%
Other 2.00%

Information Technology/IT

Factors Impacting Digital Marketing Provider Choice % of Respondents
Pricing 58.00%
Testimonials and reviews 54.00%
Case studies and prior experience 46.00%
Areas of expertise 62.00%
Trustworthiness 62.00%
Level of communication 36.00%
Location/Proximity 32.00%
Other 0.00%

Manufacturing

Factors Impacting Digital Marketing Provider Choice % of Respondents
Pricing 72.00%
Testimonials and reviews 34.00%
Case studies and prior experience 40.00%
Areas of expertise 68.00%
Trustworthiness 58.00%
Level of communication 52.00%
Location/Proximity 12.00%
Other 0.00%

Non Profit/Social services

Factors Impacting Digital Marketing Provider Choice % of Respondents
Pricing 78.00%
Testimonials and reviews 28.00%
Case studies and prior experience 24.00%
Areas of expertise 38.00%
Trustworthiness 44.00%
Level of communication 22.00%
Location/Proximity 10.00%
Other 4.00%

Real Estate/Property

Factors Impacting Digital Marketing Provider Choice % of Respondents
Pricing 84.00%
Testimonials and reviews 44.00%
Case studies and prior experience 30.00%
Areas of expertise 50.00%
Trustworthiness 46.00%
Level of communication 46.00%
Location/Proximity 20.00%
Other 0.00%

Retail

Factors Impacting Digital Marketing Provider Choice % of Respondents
Pricing 78.00%
Testimonials and reviews 40.00%
Case studies and prior experience 32.00%
Areas of expertise 58.00%
Trustworthiness 62.00%
Level of communication 46.00%
Location/Proximity 18.00%
Other 0.00%

Transportation and Warehousing

Factors Impacting Digital Marketing Provider Choice % of Respondents
Pricing 76.00%
Testimonials and reviews 42.00%
Case studies and prior experience 36.00%
Areas of expertise 54.00%
Trustworthiness 62.00%
Level of communication 32.00%
Location/Proximity 10.00%
Other 0.00%

View Source Data

Marketing trend for 2025 Mean response
Data privacy 4.08
Sustainability and social responsibility 4.67
Short-form videos 4.72
Rise in AI 4.82
Social commerce 5.01
User-generated content 5.14
Omnichannel marketing 5.45
Connected TV (CTV) advertising 5.53
Voice search optimization 5.59

View Industry Data

14 Industry marketing trends importance in 2025

Banking/Financial

Answer Mean Response
Data privacy 3.86
Rise in AI 3.9
Sustainability and social responsibility 4.8
Social commerce 4.98
User-generated content 5.12
Omnichannel marketing 5.3
Voice search optimization 5.48
Short-form videos 5.58
Connected TV (CTV) advertising 5.98

Computer Software

Answer Mean Response
Data privacy 3.88
Rise in AI 4.32
Short-form videos 4.34
Omnichannel marketing 4.62
Sustainability and social responsibility 5.36
Voice search optimization 5.36
Social commerce 5.54
Connected TV (CTV) advertising 5.66
User-generated content 5.92

Construction

Answer Mean Response
Short-form videos 4.14
Rise in AI 4.16
Data privacy 4.64
Connected TV (CTV) advertising 4.96
Sustainability and social responsibility 5.06
User-generated content 5.12
Social commerce 5.34
Voice search optimization 5.68
Omnichannel marketing 5.9

Education

Answer Mean Response
Short-form videos 4.08
Data privacy 4.52
Sustainability and social responsibility 4.62
User-generated content 4.82
Social commerce 4.92
Voice search optimization 5.22
Rise in AI 5.5
Connected TV (CTV) advertising 5.5
Omnichannel marketing 5.82

Energy/Utilities/Oil and Gas

Answer Mean Response
Data privacy 4.08
Sustainability and social responsibility 4.28
Social commerce 4.66
User-generated content 4.72
Rise in AI 4.9
Short-form videos 5.42
Omnichannel marketing 5.48
Voice search optimization 5.68
Connected TV (CTV) advertising 5.78

Government/Public Sector

Answer Mean Response
Data privacy 3.68
Short-form videos 4.48
Sustainability and social responsibility 4.58
Rise in AI 4.66
Connected TV (CTV) advertising 5.46
Social commerce 5.48
Voice search optimization 5.5
User-generated content 5.52
Omnichannel marketing 5.64

Health Care and Social Assistance

Answer Mean Response
Data privacy 4.24
Sustainability and social responsibility 4.62
Short-form videos 4.7
Rise in AI 4.98
Connected TV (CTV) advertising 5.16
Social commerce 5.16
User-generated content 5.3
Omnichannel marketing 5.42
Voice search optimization 5.42

Hospitality/Tourism

Answer Mean Response
Data privacy 4.04
Connected TV (CTV) advertising 4.6
Rise in AI 4.62
Sustainability and social responsibility 4.76
Social commerce 4.9
Short-form videos 5.34
Voice search optimization 5.56
Omnichannel marketing 5.58
User-generated content 5.6

Information Technology/IT

Answer Mean Response
Short-form videos 4.48
Data privacy 4.64
Sustainability and social responsibility 4.92
Voice search optimization 4.92
Connected TV (CTV) advertising 4.96
Rise in AI 5
User-generated content 5.2
Omnichannel marketing 5.42
Social commerce 5.46

Manufacturing

Answer Mean Response
Data privacy 3.94
Social commerce 4.54
Rise in AI 4.6
Sustainability and social responsibility 5.04
Voice search optimization 5.06
User-generated content 5.32
Omnichannel marketing 5.42
Short-form videos 5.44
Connected TV (CTV) advertising 5.64

Non Profit/Social services

Answer Mean Response
Data privacy 3.64
Sustainability and social responsibility 4.36
Short-form videos 4.62
User-generated content 4.86
Social commerce 4.9
Omnichannel marketing 5.2
Rise in AI 5.3
Voice search optimization 5.88
Connected TV (CTV) advertising 6.24

Real Estate/Property

Answer Mean Response
Data privacy 3.58
Social commerce 4.24
Omnichannel marketing 4.88
User-generated content 4.96
Short-form videos 5
Sustainability and social responsibility 5.26
Rise in AI 5.38
Voice search optimization 5.5
Connected TV (CTV) advertising 6.2

Retail

Answer Mean Response
Short-form videos 4.62
Data privacy 4.62
User-generated content 4.64
Social commerce 4.72
Sustainability and social responsibility 4.78
Omnichannel marketing 4.92
Voice search optimization 5.3
Connected TV (CTV) advertising 5.54
Rise in AI 5.86

Transportation and Warehousing

Answer Mean Response
Short-form videos 4.2
Data privacy 4.44
Rise in AI 4.54
Sustainability and social responsibility 4.6
Connected TV (CTV) advertising 5.16
Social commerce 5.4
Omnichannel marketing 5.54
Voice search optimization 5.54
User-generated content 5.58

14. Marketing trends ranked by importance

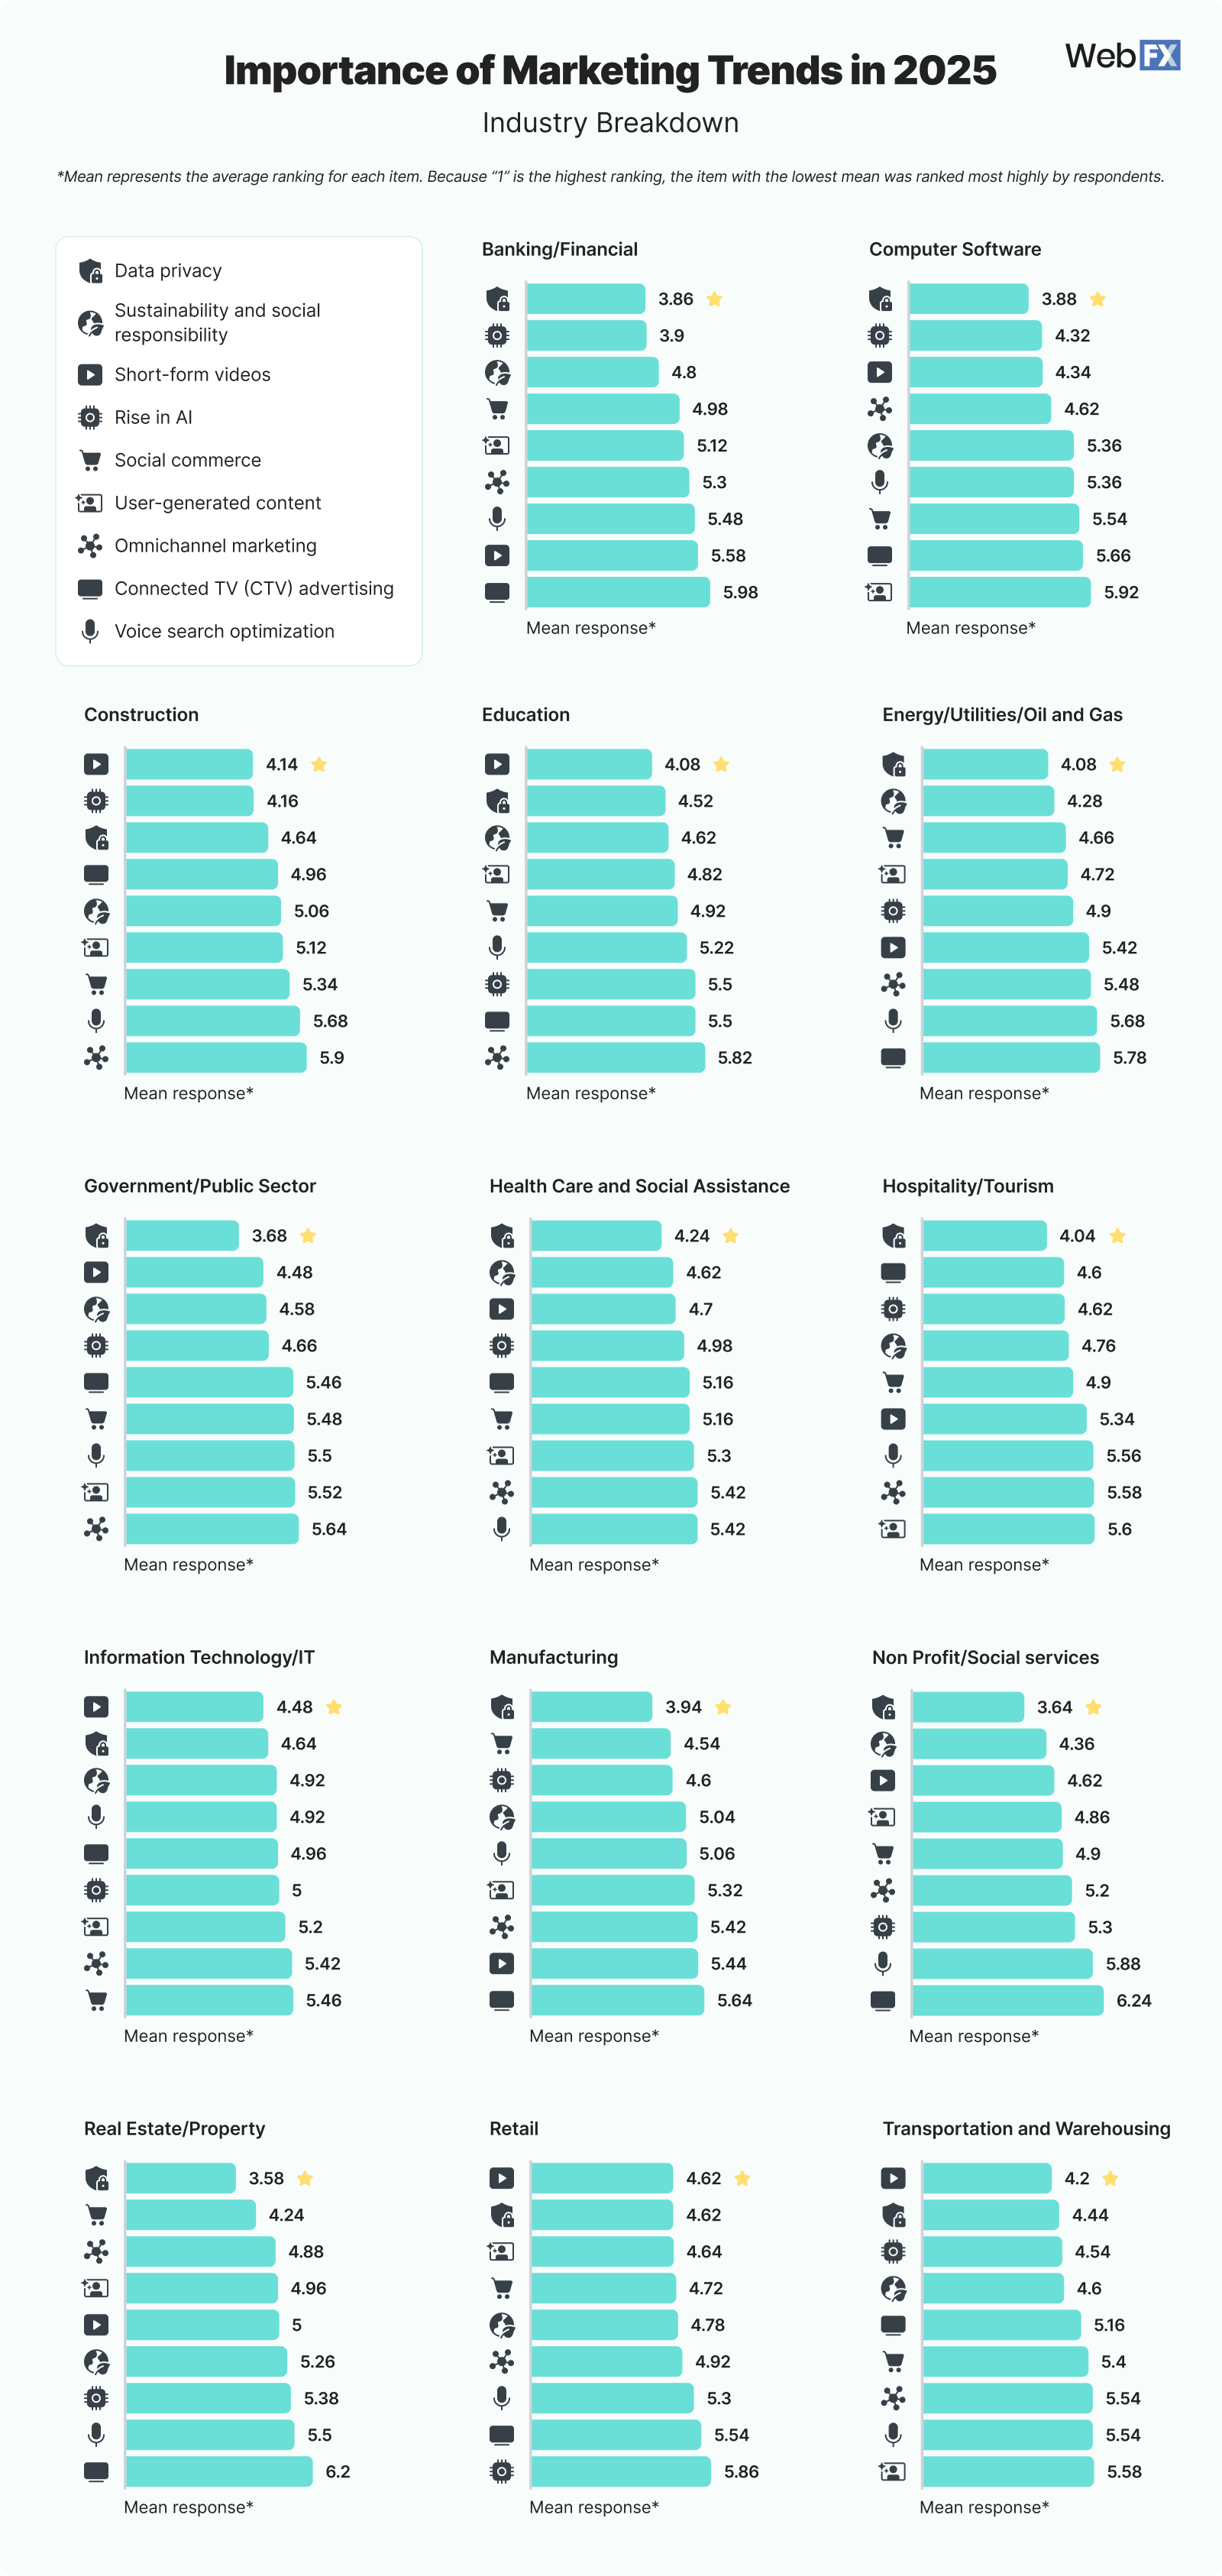
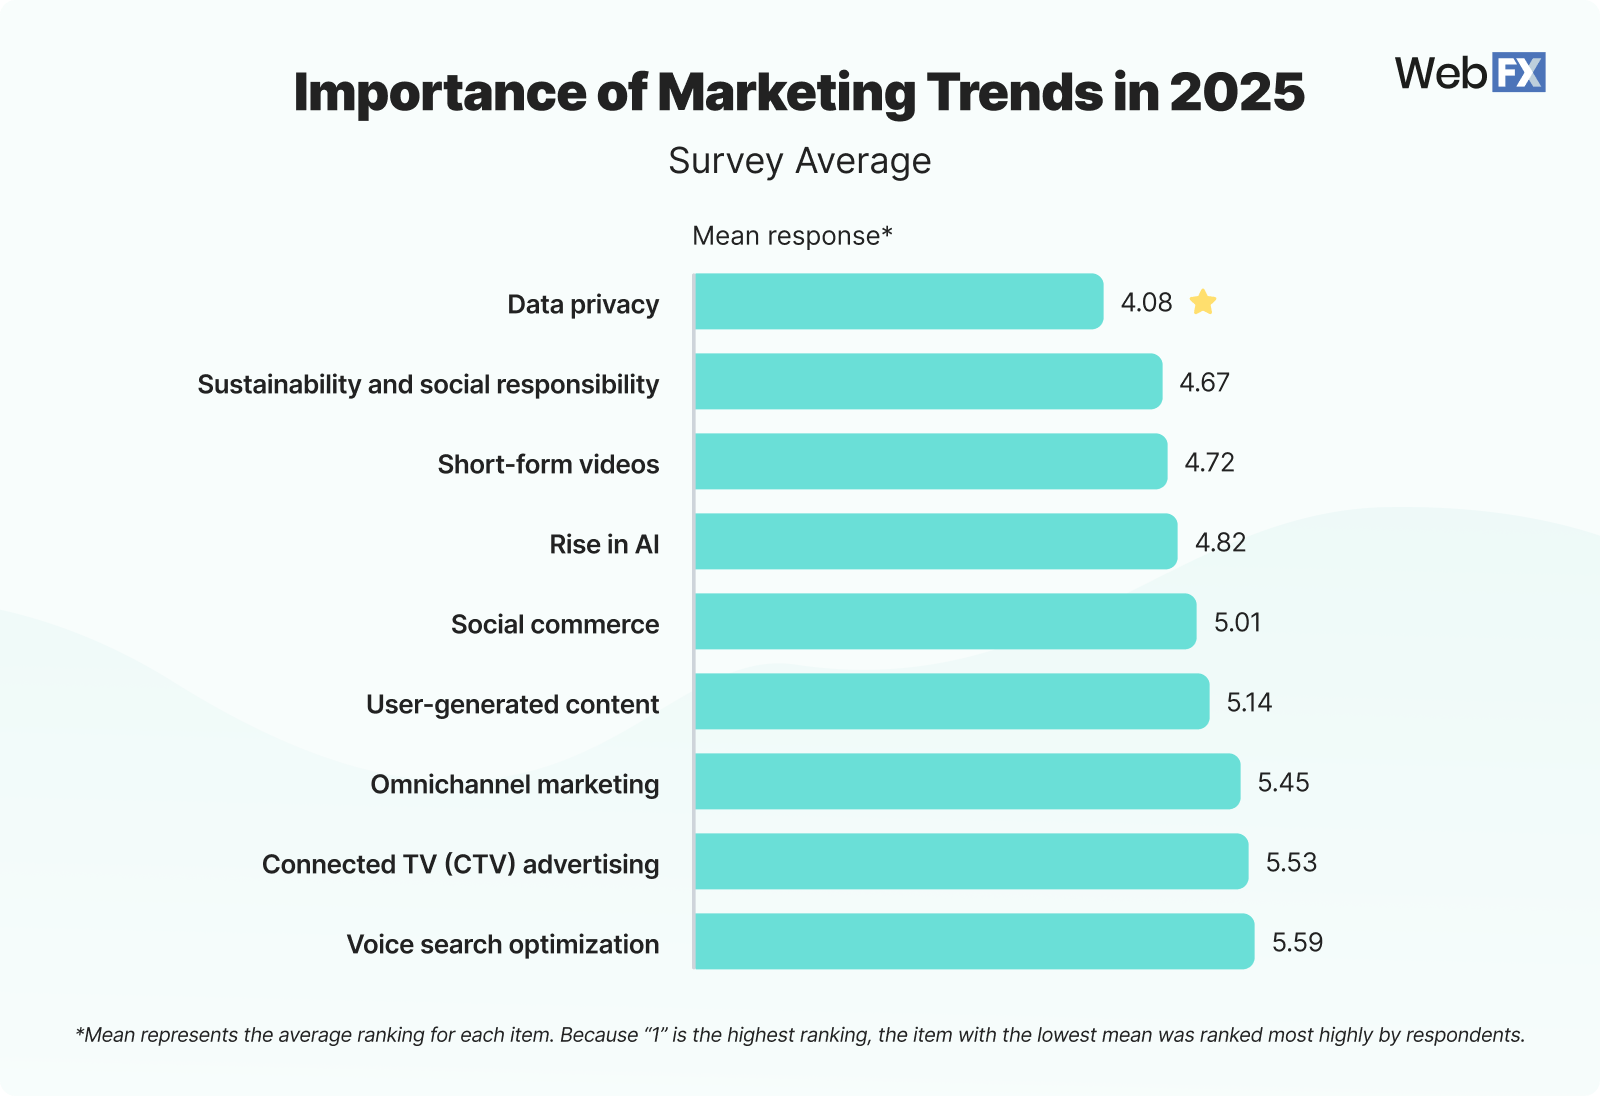
Finally, our last question aimed to understand the importance of different marketing trends to business representatives. Here is how they ranked them overall: 

14 marketing trends importance in 2025 1

What does this mean for me?

Data privacy is a leading consumer trend for 2025, and that is not lost on companies. The consumer demand for privacy has made data protection critical. Businesses need to adapt to privacy-first marketing strategies, such as relying on first-party data and consent-based targeting.

Companies must also allocate funds for privacy-compliant tools (cookieless tracking, consent management platforms, etc.). If you haven’t already, you should prioritize your marketing security to protect personal data to avoid losing sales and trust with your prospects. 

Outside of data privacy, the other core areas of focus should be sustainability, short-form videos, and AI. These trends speak to a push for experimental, new strategies in the marketing world, which you should be budgeting to explore safely before jumping into a new campaign or investment.

Social commerce, user-generated content, and CTV advertising are promising, but require strategic experimentation. These trends demand greater spending on high-quality, frequent content creation, which might not be sustainable for all businesses. That is why they are further down in terms of perceived important — while data issues can cause legal battles, you don’t need to invest in every single one of these trends.

Finally, omnichannel marketing and voice search will grow in importance as consumer habits evolve. Companies are already leaning into multifaceted marketing campaigns, likely because they know it’s best to target customers where they are online. These strategies should be part of your long-term marketing plan.

View Source Data

Marketing trend for 2025 Mean response
Data privacy 4.08
Sustainability and social responsibility 4.67
Short-form videos 4.72
Rise in AI 4.82
Social commerce 5.01
User-generated content 5.14
Omnichannel marketing 5.45
Connected TV (CTV) advertising 5.53
Voice search optimization 5.59

View Industry Data

14 Industry marketing trends importance in 2025

Banking/Financial

Answer Mean Response
Data privacy 3.86
Rise in AI 3.9
Sustainability and social responsibility 4.8
Social commerce 4.98
User-generated content 5.12
Omnichannel marketing 5.3
Voice search optimization 5.48
Short-form videos 5.58
Connected TV (CTV) advertising 5.98

Computer Software

Answer Mean Response
Data privacy 3.88
Rise in AI 4.32
Short-form videos 4.34
Omnichannel marketing 4.62
Sustainability and social responsibility 5.36
Voice search optimization 5.36
Social commerce 5.54
Connected TV (CTV) advertising 5.66
User-generated content 5.92

Construction

Answer Mean Response
Short-form videos 4.14
Rise in AI 4.16
Data privacy 4.64
Connected TV (CTV) advertising 4.96
Sustainability and social responsibility 5.06
User-generated content 5.12
Social commerce 5.34
Voice search optimization 5.68
Omnichannel marketing 5.9

Education

Answer Mean Response
Short-form videos 4.08
Data privacy 4.52
Sustainability and social responsibility 4.62
User-generated content 4.82
Social commerce 4.92
Voice search optimization 5.22
Rise in AI 5.5
Connected TV (CTV) advertising 5.5
Omnichannel marketing 5.82

Energy/Utilities/Oil and Gas

Answer Mean Response
Data privacy 4.08
Sustainability and social responsibility 4.28
Social commerce 4.66
User-generated content 4.72
Rise in AI 4.9
Short-form videos 5.42
Omnichannel marketing 5.48
Voice search optimization 5.68
Connected TV (CTV) advertising 5.78

Government/Public Sector

Answer Mean Response
Data privacy 3.68
Short-form videos 4.48
Sustainability and social responsibility 4.58
Rise in AI 4.66
Connected TV (CTV) advertising 5.46
Social commerce 5.48
Voice search optimization 5.5
User-generated content 5.52
Omnichannel marketing 5.64

Health Care and Social Assistance

Answer Mean Response
Data privacy 4.24
Sustainability and social responsibility 4.62
Short-form videos 4.7
Rise in AI 4.98
Connected TV (CTV) advertising 5.16
Social commerce 5.16
User-generated content 5.3
Omnichannel marketing 5.42
Voice search optimization 5.42

Hospitality/Tourism

Answer Mean Response
Data privacy 4.04
Connected TV (CTV) advertising 4.6
Rise in AI 4.62
Sustainability and social responsibility 4.76
Social commerce 4.9
Short-form videos 5.34
Voice search optimization 5.56
Omnichannel marketing 5.58
User-generated content 5.6

Information Technology/IT

Answer Mean Response
Short-form videos 4.48
Data privacy 4.64
Sustainability and social responsibility 4.92
Voice search optimization 4.92
Connected TV (CTV) advertising 4.96
Rise in AI 5
User-generated content 5.2
Omnichannel marketing 5.42
Social commerce 5.46

Manufacturing

Answer Mean Response
Data privacy 3.94
Social commerce 4.54
Rise in AI 4.6
Sustainability and social responsibility 5.04
Voice search optimization 5.06
User-generated content 5.32
Omnichannel marketing 5.42
Short-form videos 5.44
Connected TV (CTV) advertising 5.64

Non Profit/Social services

Answer Mean Response
Data privacy 3.64
Sustainability and social responsibility 4.36
Short-form videos 4.62
User-generated content 4.86
Social commerce 4.9
Omnichannel marketing 5.2
Rise in AI 5.3
Voice search optimization 5.88
Connected TV (CTV) advertising 6.24

Real Estate/Property

Answer Mean Response
Data privacy 3.58
Social commerce 4.24
Omnichannel marketing 4.88
User-generated content 4.96
Short-form videos 5
Sustainability and social responsibility 5.26
Rise in AI 5.38
Voice search optimization 5.5
Connected TV (CTV) advertising 6.2

Retail

Answer Mean Response
Short-form videos 4.62
Data privacy 4.62
User-generated content 4.64
Social commerce 4.72
Sustainability and social responsibility 4.78
Omnichannel marketing 4.92
Voice search optimization 5.3
Connected TV (CTV) advertising 5.54
Rise in AI 5.86

Transportation and Warehousing

Answer Mean Response
Short-form videos 4.2
Data privacy 4.44
Rise in AI 4.54
Sustainability and social responsibility 4.6
Connected TV (CTV) advertising 5.16
Social commerce 5.4
Omnichannel marketing 5.54
Voice search optimization 5.54
User-generated content 5.58
notes icon

Industry Budget Trends

Industries that ranked short-form video as the most significant marketing trend

  • Retail
  • Transportation and warehousing
  • Construction
  • Education
  • IT

Marketing budget FAQ

Get your burning budget questions answered! 

How do I create a marketing budget?

Now it’s time to start drafting your digital marketing budget for 2025. Follow these steps to guide your budget-planning efforts:

  1. Calculate your available marketing budget
  2. Review your business performance
  3. Set your digital marketing goals
  4. Choose your digital marketing strategies
  5. Consider additional expenses
  6. Finalize your budget

And, if you want even more help creating a marketing budget, check out our free digital marketing budget template below!

marketing budget planner

Download Now: Our Free Budget Planner

1. Calculate your available marketing budget

First, you’ll want to calculate your available marketing spend so you can get a better idea of how large your digital marketing budget will be. There are a few different ways you can determine your available marketing spend:

  • Reserve a percentage of your revenue
  • Allocate money based on objectives
  • Determine your expected return on investment (ROI)
  • Budget based on seasonal fluctuations in business and consumer interest

2. Review your business performance

When planning your digital marketing budget, you’ll want to consider your business performance. Where do you want to improve, and how much are you looking to do so? To get the answers to these questions, look at your business performance to get a better idea of metrics like:

  • Sales or inquiries
  • Customer engagement
  • Reviews
  • Revenue generated
  • Competitor growth
  • And more

Looking at these metrics gives you a better understanding of your business’s current state, which can help you set better goals.

3. Set your digital marketing goals

Once you’ve reviewed your recent business performance and gotten a better idea of your capabilities, set SMART goals and objectives for your campaign. SMART objectives are goals that are:

  • Specific
  • Measurable
  • Achievable
  • Relevant
  • Time-bound

By thinking about your campaign goals as you plan your digital marketing budget, you can better understand what you want to accomplish with your budget and better allocate funds to ensure you’re giving yourself the resources necessary to achieve those goals.

4. Choose your digital marketing strategies

As you start to set up your digital marketing budget for 2025, you must consider what marketing strategies you’ll use and the channels you’ll market yourself on. Knowing how to allocate your marketing budget in 2025 involves understanding the technology needed, time, effort, and more.

Expert insights from webfx logo

Trevin
Trevin Shirey VP of WebFX Marketing

“If you are prioritizing new revenue in [2025], look to your channels that have delivered revenue in the past. Looking to grab market share and not worrying as much about revenue? Same principle applies. You want to lean on your dependable marketing channels with proven track records so you can build some goals and forecasts you have confidence in.”

Below are some common digital marketing strategies businesses factor into their digital marketing budget:

  • Search engine optimization (SEO): SEO is a digital marketing process in which you make optimizations to your site to improve its visibility on search engines, making it easier for your audience to find you. This includes tactics like keyword research, content creation, web design, and more.
  • Pay-per-click (PPC) advertising: PPC advertising is a form of paid advertising where you pay a small fee each time someone clicks on your ad. PPC ads appear at the top of search results in highly visible areas, making them a worthy investment if you’re looking to attract more qualified leads.
  • Email marketing: Email marketing is a great way to nurture leads and move them along the sales funnel by regularly sending promotional marketing material to their inboxes. Whether you use your email marketing strategy to encourage more sales, remind them of events, or to conduct customer service, email marketing can be a great tool for converting more leads.
  • Content marketing: Content marketing is the process of developing informative, relevant content that educates your audience. It’s a double-edged sword when it comes to digital marketing because it works on its own to help you attract leads while also improving other strategies. For example, your content marketing efforts can improve your SEO by helping you rank for keywords!
  • Social media marketing: Is your target audience active on social media? If so, social media marketing is the perfect digital marketing strategy to invest in. Advertising on social media helps you build a community around your brand while increasing its online visibility through posts, ads, user engagement, and more.

5. Consider additional expenses

When planning your digital marketing budget, you’ll also need to consider the additional expenses that come with running a campaign, like marketing technology needed, hiring an in-house marketing team, partnering with an agency, and more.

To get a better idea of the additional costs you could face when planning your budget, ask yourself questions:

  • Do I want to do marketing in-house or partner with an agency?
  • Will I need additional technology to complete marketing tasks?
  • Do I have the time to do marketing myself?
  • Can I afford to hire more employees to do marketing in-house?

Expert insights from webfx logo

Trevin
Trevin Shirey VP of WebFX Marketing

“I always recommend investing 10-15% of your marketing budget into new channels. Many companies overly focus on the channels that have worked well for them in the past and don’t develop enough new marketing channels that might work even better.

Be bold with 10-15% of your budget and try some new things so you’re able to find and develop more long-term channels that are valuable for your business.”

6. Finalize your budget

Once you’ve reviewed your business performance, set goals, identified what strategies you want to use, and considered additional expenses, you’re ready to start finalizing your budget.

But here’s a pro tip to leave you with: Finalizing your budget doesn’t mean you can’t change it in the future. Your budget should be like your business — fluid and adaptable. As your business goes through changes, so too will your budget.

Remember to regularly evaluate your digital marketing budget to ensure you’re allocating the right funds to fuel your business growth and ensure you’re not hindering it or causing it to stall.

What is the 70-20-10 marketing budget rule?

When setting up your digital marketing budget for 2025, the 70-20-10 rule is extremely helpful for helping you allocate funds effectively so you can run a successful campaign. Here’s how the 70-20-10 rule works:

  • Spend 70% of time and money on “now”
  • Spend 20% of time and money on “next”
  • Spend 10% of time and money on “new”

Spend 70% of time and money on “now”

With the 70-20-10 rule, 70% of your time and digital marketing budget is spent on the “now,” or strategies you know work well for your business.

Whether you want to keep pushing SEO or promote a product or service that drives revenue, focus on spending your money to optimize your performance and drive valuable results.

This is a safe place to allocate your budget because you already know that these strategies, products, and services work for your business.

Spend 20% of time and money on “next”

Next, 20% of your budget should go toward things that are on the horizon, like new strategies.

For instance, you might market a new product, or expand your market share by targeting new audience segments. By putting money toward the “next,” you’re investing in your future so you can reach new leads, earn more conversions, and ultimately help your business grow.

Spend 10% of time and money on “new”

Finally, approximately 10% of your digital marketing budget should go toward the “new.” According to our survey, people spend 5-10% on new strategies, so other companies in your industry are likely planning on implementing experimental methods. 

There are the unknowns of the digital marketing world, like emerging technology or experimental strategies, that you can take time to learn. Strategically investing some of your budget into new ideas is crucial to giving your business the opportunity to stay ahead of your competition. 

And remember — the 70-20-10 rule isn’t set in stone. It’s a good starting point, but you don’t need to follow it precisely. You can always adjust the ratio to fit your business, goals, and capabilities.

What is a good digital marketing budget?

Across all industries, a good marketing budget should range from $1,000–$10,000 per month on average, based on our research.

A good marketing budget will look different for every company. That is why it is best to think of your marketing in terms of a percentage as well as a dollar amount. You want your spend to be proportionate to your earned revenue, so you might set aside 2-5% of your revenue for marketing.

How much should I allocate for digital marketing services?

Here is a breakdown of how much to allocate for each marketing strategy, based on the average price of marketing services:

  • Digital marketing: $50–$6,000 per month
  • SEO: $500–$7,500 per month
  • PPC advertising: $100–$10,000 per month
  • Email marketing: $51–$1,000 per month
  • Social media marketing: $100–$5,000 per month

What factors influence digital marketing budget?

To estimate your marketing budget, you should consider the following factors: 

  • Business goals: Aggressive marketing goals might require more spending than a long-term strategy.
  • Strategies: The strategies you choose will all have different price tags. Looking at how much digital marketing costs is a great starting point for building your campaigns.
  • Industry: Your industry will influence how much you should spend on marketing. For example, you don’t want to spend less on marketing than your competitors if you can help it. That could cost you leads and sales!
  • Marketing provider: Marketing in-house will have different costs than working with a provider. With in-house teams, you’ll be paying for salaries, benefits, and other employee costs. An agency can give you a fixed rate while offering a team of experts.
  • Revenue: The amount of revenue you earn will determine how much you can set aside for marketing. Your marketing budget will be a percentage of your total revenue.

Looking at these factors can help you estimate what you will need to spend on marketing each month or year.

How much money do you need for digital marketing?

You need anywhere from $51–$10,000 per month on average for marketing.

There is no minimum to how much money you need for digital marketing. Some marketing tactics you can do for free in-house, while others might require more professional assistance.

Plan your marketing budget for 2025 with WebFX!

Planning a digital marketing strategy should be a top priority as you move into a new year. Whether you need to create a fresh budget plan or reallocate your marketing budget, the right agency can help.

Partner with WebFX, a full-service digital marketing agency with over 29 years of experience in helping businesses implement data-driven digital marketing strategies! We offer a wide range of digital marketing services to help with your every marketing need, from SEO services to PPC services to web design services and much more!

WebFX can help craft a personalized solution that fits your unique marketing needs. With our services, you can get the most out of your marketing budget and earn more revenue to grow your bottom line. 

Don’t miss out on higher ROIs and leads from a mismanaged budget. Get ahead of your marketing goals by contacting us online!

Try our free Marketing Calculator

Craft a tailored online marketing strategy! Utilize our free Internet marketing calculator for a custom plan based on your location, reach, timeframe, and budget.

Plan Your Marketing Budget
Marketing Budget Calculator
TO TOP