

In the age of AI Overviews appearing for nearly half of searches and core updates rolling out frequently, leveraging the right tool to diagnose SEO results is essential.
Diving into Google Search Console (GSC) is not just a recommendation, but a necessary tool that needs to be analyzed in the ever-changing search landscape to diagnose trends, review lost traffic, and monitor the impact of ongoing strategies.
Similar keyword ranking platforms like Semrush or Ahrefs can provide you with great information, but the metrics provided for your site will all be from a third party. With Google Search Console, you leverage your website’s first-party data (including the actual keywords and pages that are driving results for your business) to increase what matters — revenue.
In this guide, I will talk through my top recommendations to utilize GSC to effectively drive results for your business, no matter if you have 10 or 10,000 pages.
What is Google Search Console?
Google Search Console is Google’s free tool for monitoring and improving how your website appears in the search results. It helps you spot shifts in organic search visibility, identify impacts from algorithm updates, and pinpoint technical problems.
What can you do with Google Search Console’s core functions?
Google Search Console allows you to do the following:
- Track keyword and page performance in the search results
- Diagnose technical issues, such as page indexability, schema markup, crawl bloat, and more.
- Identify mobile usability problems
- Monitor your website for security issues, such as hacks, manual penalties, etc.
Although you can properly diagnose total site traffic by channel and decreases in results with Google Analytics (GA4), GA4 does not give you the ability to see the true reason why traffic, conversions or revenue is down.
That’s why Google Search Console is so valuable for finding opportunities to improve your SEO.
How do I use Google Search Console to set up data comparisons?
If you spot a decline in performance, like contact form submissions, calls, or revenue, Google Analytics 4 (GA4) can only tell you so much. Google Search Console becomes the key tool we need to uncover the story behind the data.
To properly analyze your organic performance, it’s critical to set up your comparison periods in GSC with precision. Rather than defaulting to “this year vs last year” or arbitrary recent periods, you should compare the current underperforming period against your previous high-performing period.
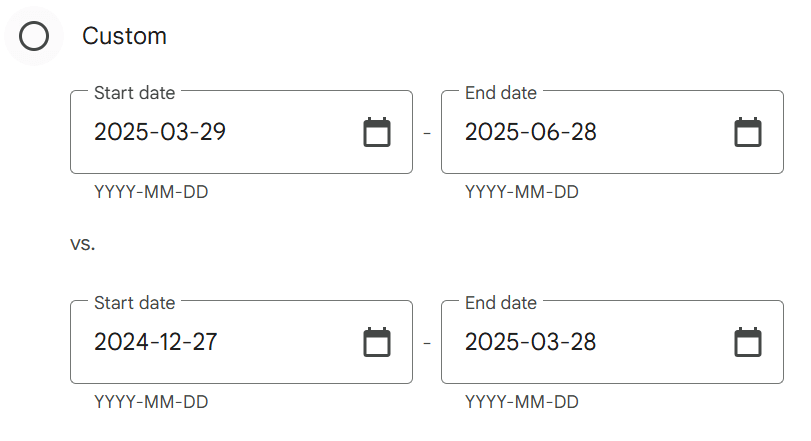
This approach will provide you with direct visibility into the queries and pages that were driving better results historically before, so you can compare to the current year.
For example, if we are analyzing a revenue decline in Q2 of 2025 compared to Q2 of 2024, you would set your date range as follows:
April 1, 2024–June 30, 2024
vs.
April 1, 2025–June 30, 2025
When selecting date ranges, it is vital to consider any external factors that could skew results such as major site changes, business seasonality, or core updates. The goal is to isolate true performance shifts from outside noise so that we can take meaningful action.
How to diagnose decline in SEO performance using Google Search Console
To help explain how this works, let’s pretend we’re looking to diagnose revenue decline between Q2 2025 and Q2 2024.
With the proper date range enabled, there are four key areas where we can immediately glean insight:
- Total clicks: The total number of users who came to your website directly from the search results (SERPs).
- Total impressions: How many users have seen a link to your website in the SERPs.
- Average click-through rate (CTR): How often users clicked on your website when seeing the link to your site within the SERPs.
- Average position: The average ranking of the total keywords across your entire site
With meaningful data now at our fingertips, we can dig in to identify why revenue is down.
Here’s what you need to do:
1. Analyze clicks and impressions
With AI Overviews, it is becoming increasingly common to see a rise in total impressions and a decrease in clicks, which then leads to drops in click-through rates.
As of 2024, nearly 60% of Google searches end without a click. AI Overviews allow users to get top-of-the-funnel information directly in the search results, which in some cases eliminates the need for a visit to your site.
It’s vital to understand the context of how AI Overviews are affecting results, because although clicks to your website are decreasing, it does not necessarily mean that it is the reason for revenue declines.
Here’s an example: Imagine a business is seeing SEO traffic decreasing by 14% YoY while organic impressions are increasing by 71%. This is a clear sign of the impact of the AI Overviews, where users see content placed at the top of the SERPs, but are getting the key information directly from the search results, which eliminates the need for a click to the website.
AI Overviews continue to appear for long-tail information queries, but have not yet rolled out to transaction-driving terms to the extent we’ve seen with top of the funnel searches. So, although traffic may be down at first glance, we need to dive in further to diagnose where revenue declines come from:
- Are we losing clicks from low-converting information queries?
- Are clicks decreasing for product or transactional queries?
- Are impressions increasing, despite clicks decreasing?
Once you answer these questions, you can dive into Google Search Console to investigate further.
2. Segment SEO traffic and impressions in Google Search Console
To diagnose why revenue for your website is down, you need to go a step further and begin filtering the Google Search Console data. Use the Add Filter button to segment your YoY analysis for queries or pages that are transaction-focused and are a core driver of revenue.
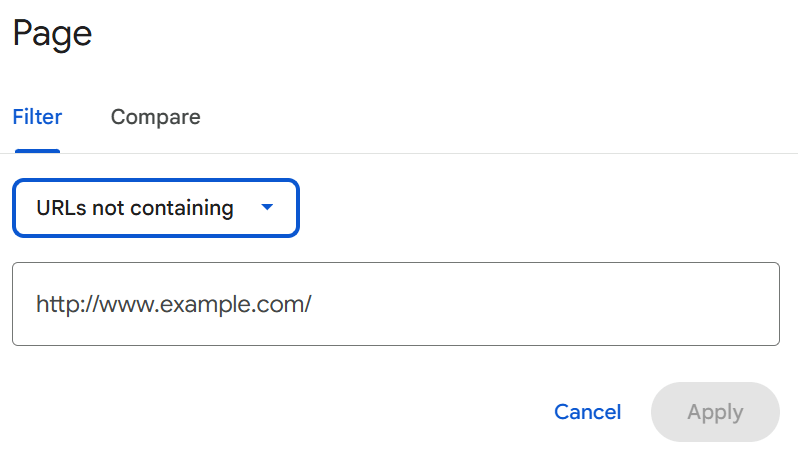
This can be done by:
- Filter your top pages to exclude blog or resource articles: If you use a subfolder to house your top-of-funnel content, exclude these pages and the queries that these pages show for by adding your blog subfolder (/blog/, /resources/, etc.) to the “URLs not containing” drop-down.
- Filter by the bottom of the funnel, revenue-driving pages: Removing blog pages will give you a broader scope of total keywords for all pages on your site, but to dive even deeper into transaction query trends, use your product or service page subfolder (/product/, /product-category/, /services/ etc.) to see exactly what keywords are driving clicks and impressions that will turn into revenue.
- Add a brand name query exclusion on top of the page filter to find all non-branded transactional keywords: To fully uncover revenue trends, take the page filter a step further by excluding all branded keywords and traffic through an additional query filter that removes branded searches from the data.
With these filters in place, we now have data to use as our guiding light in analyzing why revenue is down, and take actionable steps to recover lost conversion-driving keyword rankings.
How to recover lost revenue and keyword rankings with Google Search Console
Following the steps outlined above, we now know exactly which non-branded, transactional keywords were driving traffic to the site when revenue was higher in Q2 last year.
So, what do we do now? Here are my recommendations:
1. Identify non-branded keywords with down rankings and clicks
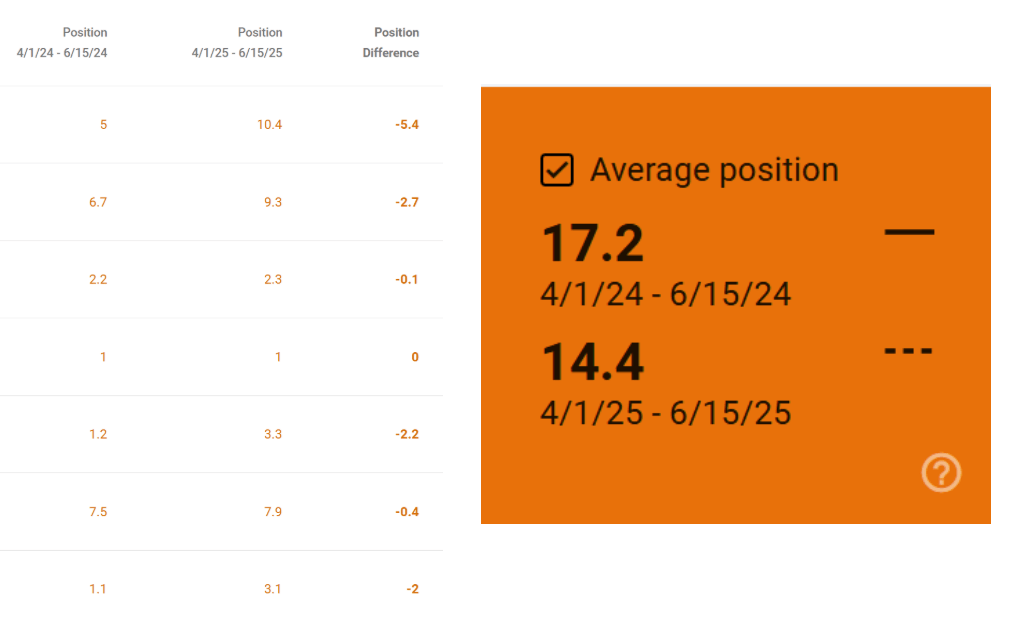
The first step is to turn on the Average Keyword Position feature in GSC to diagnose what keywords are decreasing in rank, which is where you are losing revenue.
Ensure Average Position is clicked in the Google Search Console interface. Scrolling down to the query report, you will find what terms are decreasing in ranking position year over year and take necessary action.
2. Analyze the search results for downward-trending keywords
Taking a keyword that is down in rankings year over year, you first need to identify factors from an algorithm standpoint that could be causing these declines. You can dive in by entering the keyword that’s declining in performance in the search results and analyzing the SERPs for that specific query.
Specifically, you are looking for anything that is appearing over your organic placement. As questions like:
- Is Google increasing SERP features for this term, such as People Also Ask, local map packs, or ecommerce product listings?
- Are there ads appearing for this search term that were not present last year?
- Have new competitors entered the landscape and outranking you?
- Are competitor sites increasing in ranking position?
💡 Pro Tip
You can review what the search results looked like for the previous year on Google by updating the date range directly in the SERPs. This will allow you to easily identify any algorithmic or competitive trends that would be difficult to diagnose otherwise.
3. Review competitor pages for key differences
Once you review the search results for any algorithmic trends, you need to dive into competitor trends and identify why search engines may be ranking competitors above you.
For the keyword you are losing positions for (and ultimately revenue), open up all the competitor pages that are now ranking above your site.
Google could be ranking competitor sites for a variety of reasons, but the key items you want to break down are backlinks, content, and user experience features, which make up the majority of Google’s ranking algorithm.
Here’s a breakdown of each:
- Backlinks: Backlinks are external links to a website provide search engines with trust and authority signals, which could allow competitor sites to rank higher than your site for key terms. Pairing your initial Google Search Console analysis with a tool like Ahrefs will allow you to see if competitors are expanding on their backlink efforts, which is leading to higher rankings.
- Content: Keyword-rich copy on product and service pages directly provides the context needed for search engines to accurately rank a page for target queries. Identify key features of the competitor content — Are they using more optimized headings? Do they have the keyword inserted on the page content more frequently? Take note if so.
- Page and user experience features: The length of time a user spends on your page is a key ranking factor for search engines, as a longer time on page shows the page provided in the search result was what the user wants. Identify page features competitors could be using to increase dwell time, such as testimonials, pricing comparisons, product reviews, or videos.
Repeat this process to further understand and diagnose revenue decrease for other top keywords that are declining.
Based on the competitor review and SERP review, you will now be able to understand why competitors are outranking your site, and prioritize an action plan to recover lost keyword rankings and revenue.
💡 Pro Tip
Outside of backlinks, content, and page experience, you need to have an internal linking strategy in place to pass authority from page to page, which will drive improved rankings. Prioritize internal links from blogs, articles, or other category pages, that are linked from the target keyword which is seeing ranking declines.
Improve your SEO performance with help from WebFX
Are you looking for a partner that can confidently analyze your data and uncover insights that drive revenue? With our proprietary software, RevenueCloudFX, WebFX is a leader in the industry when it comes to tracking search data and using those insights to power your campaigns.
Contact us today or call us at 888-601-5359 to discover how our SEO services can help you continue driving revenue, no matter how search shifts.
-

WebFX is a full-service marketing agency with 1,100+ client reviews and a 4.9-star rating on Clutch! Find out how our expert team and revenue-accelerating tech can drive results for you! Learn more
Try our free Marketing Calculator
Craft a tailored online marketing strategy! Utilize our free Internet marketing calculator for a custom plan based on your location, reach, timeframe, and budget.
Plan Your Marketing Budget
Share this article

SEO Success with KOA

Try our free Marketing Calculator
Craft a tailored online marketing strategy! Utilize our free Internet marketing calculator for a custom plan based on your location, reach, timeframe, and budget.
Plan Your Marketing Budget