

-
What are GA4 events?
GA4 events are tracked user interactions—like clicks, form submissions, video views, and purchases—using GA4’s event-based data model. -
What are the four main GA4 benchmark categories?
Acquisition (60–85%), engagement (55%+), retention (25–35%), and monetization (2–4%) measure user attraction, interaction, return visits, and conversions. -
How do you enable benchmarking in GA4?
From the GA4 Home overview card, select a metric and toggle benchmarking to compare your performance with industry and peer data. -
Why should businesses use GA4 event benchmarks?
They show how you compare to industry standards, reveal weak spots, guide testing, and help set realistic goals.
Want to see how your performance compares to others in your industry? Google Analytics 4 (GA4) event benchmarks let you measure your website and app data against aggregated metrics from thousands of properties.
This guide covers 30+ GA4 event benchmarks across acquisition, engagement, retention, and monetization.
- What are GA4 events?
- Overview of Key GA4 benchmark metrics
- How to enable benchmarking in GA4
- Why benchmark GA4 events?
You’ll find the data in clear tables, charts, and downloadable resources to make benchmarking easy to apply to your strategy.
What are GA4 events?
GA4 events are user interactions with your website or app that GA4 tracks and measures. These events capture specific actions visitors take — like clicking a button, submitting a form, watching a video, or making a purchase.
Unlike Universal Analytics (GA4’s older version), GA4 uses an event-based data model for all tracking. This means everything you measure in GA4 is an event, from page views to conversions.
GA4 automatically tracks and collects some events like session starts and first visits, but you can also implement some custom events most relevant to your business. Google also recommends events with predefined names and parameters based on your industry, ensuring you capture rich user behavior.
You can also enable measurement events, which track optional user interactions, like site search, video engagement, and outbound clicks.
Key GA4 benchmark metrics
GA4 events can be categorized into four main categories with set benchmark ranges from aggregated industry data. These key benchmark insights provide directional insight, with the exact targets varying based on industry, audience behavior, and business goals.
| Category | Key Benchmark Metrics | What They Indicate | Target Benchmark Ranges |
| Acquisition |
|
Measures how effectively you attract new users |
|
| Engagement |
|
Shows how users interact with your site or app |
|
| Retention |
|
Indicates how often users return to your site or app |
|
| Monetization |
|
Tracks how well your site or app generates revenue |
|
GA4 acquisition benchmarks
Acquisition benchmark metrics help you understand how to attract new users more effectively than competitors. The key metric in this category is new user rate, and, which measures the percentage of new visitors coming to your app or site in a given period.
Acquisition benchmark metrics help you determine whether your competitors are attracting more first-time visitors than you, allowing you to find ways to improve new user growth.
The following table highlights overall GA4 acquisition benchmarks:
| Metric | What It Indicates | Target Benchmark Ranges |
| New user rate (28-day) | Share of first-time visitors in your audience |
|
| User growth rate (MoM) | Pace of audience growth vs. peers |
|
| Channel mix — Organic traffic share | Reliance on SEO to acquire users | 45–60% of total traffic (overall average) |
| Channel mix — Paid traffic share | Reliance on paid ads for acquisition | 15–25% of total traffic (overall average) |
| Channel mix — Social traffic share | Reliance on social platforms for acquisition | 8–15% of total traffic (overall average) |
GA4 engagement benchmarks
Engagement benchmarks provide insights into how users interact with your content. GA4 records engagement metrics when a user stays on a site or app for more than 10 seconds, views at least two pages, or triggers a conversion event.
A good engagement rate in GA4 is often above 55%, and sites with rates of 75% or higher typically exhibit a positive user experience (UX) with fast load speeds, mobile friendliness, and engaging calls to action (CTAs).
Here’s a table that breaks down engagement metrics by industry.
| Industry | Average Engagement Rate | Average Session Duration | Average Sessions/User | Average Bounce Rate |
| Overall Average | 62% | 2m 38s | 1.8–2.2 | 44.82% |
| Automotive | 68-72% | 2m 30s – 3m | 1.6 – 2.1 | 28-32% |
| Health & Wellness | 65-70% | 2m 15s – 2m 45s | 1.7 – 2.2 | 30-35% |
| Travel & Leisure | 58-65% | 3m 15s – 3m 45s | 2.0 – 2.5 | 35-42% |
| Ecommerce/Retail | 55-65% | 1m 30s – 2m | 2.2 – 2.8 | 20-45% |
| Apparel & Footwear | 55-60% | 1m – 1m 30s | — | 27.92% |
| Real Estate | 50-58% | 2m 45s – 3m 15s | 1.8 – 2.3 | 41.14% |
| Finance/Banking | 48-55% | 1m 45s – 2m 15s | 1.5 – 2.0 | 45-52% |
| Education | 45-52% | 1m 15s – 1m 45s | 1.4 – 1.9 | 48-55% |
| Information Technology | 45-50% | 2m – 2m 30s | 1.3 – 1.8 | 48.22% |
| Consulting & Professional | 40-48% | — | — | 52-60% |
| SaaS/B2B Software | 38-45% | 45s – 1m 15s | 1.2 – 1.7 | 55-62% |
GA4 retention benchmarks
Retention benchmarks show you how often users return to your app or site. Good retention rates signal product-market fit, content quality, and customer loyalty. You can calculate customer retention rates by dividing the number of Daily Active Users by Monthly Active Users.
Here’s a table that highlights GA4 retention benchmarks:
| Returning User Rate (28-day) | DAU/MAU (Stickiness) | WAU/MAU | Repeat Session Rate (2+ sessions/28d) | Average Bounce Rate | Attribution by business size | |
| Overall Average | 25–35% | 12–20% (20%+ top) | 35–50% (50%+ top) | 40–55% (55%+ top) | 44.82% |
|
GA4 monetization benchmarks
Monetization benchmarks help you understand your business’s revenue-generating potential. They are tied to specific events to track the user’s purchasing journey.
GA4 monetization benchmarks — Ecommerce (by industry)
| Industry | User Conversion Rates | Session Conversion Rates | Add-to-Cart Rate | Checkout Abandonment |
| Overall Ecommerce | 2.5–3.5% | 1.8–2.8% | 8–15% | 60–70% |
| Health & Wellness | 3.5–5.0% | 2.5–3.8% | 8–15% | 60–70% |
| Food & Beverage | 3.0–4.2% | 2.2–3.2% | 8–15% | 60–70% |
| Home & Garden | 2.8–4.0% | 2.0–3.0% | 8–15% | 60–70% |
| Electronics | 2.5–3.5% | 1.8–2.8% | 8–15% | 60–70% |
| Fashion/Apparel | 2.2–3.2% | 1.6–2.4% | 8–15% | 60–70% |
| Sports & Recreation | 2.0–3.0% | 1.5–2.3% | 8–15% | 60–70% |
| Automotive Parts | 1.8–2.8% | 1.3–2.1% | 8–15% | 60–70% |
| Books & Media | 1.5–2.5% | 1.1–1.9% | 8–15% | 60–70% |
GA4 monetization benchmarks — Lead generation
| Industry | User Conversion Rate | Session Conversion Rate |
| Healthcare/Medical | 7.0% | 5.2–6.5% |
| Banking/Financial Services | 4.5–6.2% | 3.4–4.7% |
| Real Estate & Construction | 3.7–4.5% | 2.8–3.4% |
| Education & Training | 4.2–5.5% | 3.2–4.2% |
| Legal Services | 4.2–5.5% | 3.2–4.2% |
| Manufacturing & Industrial | 1.2–2.4% | 0.9–1.8% |
| Automotive | 2.5–8.0% | 1.9–6.0% |
| B2B Services | 2.5–6% | 1.8–4.5% |
| Technology/Software | 2.0–4.2% | 1.5–3.2% |
How to enable benchmarking in GA4
Obtaining benchmarking data in GA4 is pretty straightforward. Here’s a step-by-step guide on how to enable event benchmarking to help you find and interpret relevant GA4 reports you can use to make data-driven decisions.
Step 1: Turn on benchmarking in your GA4 account
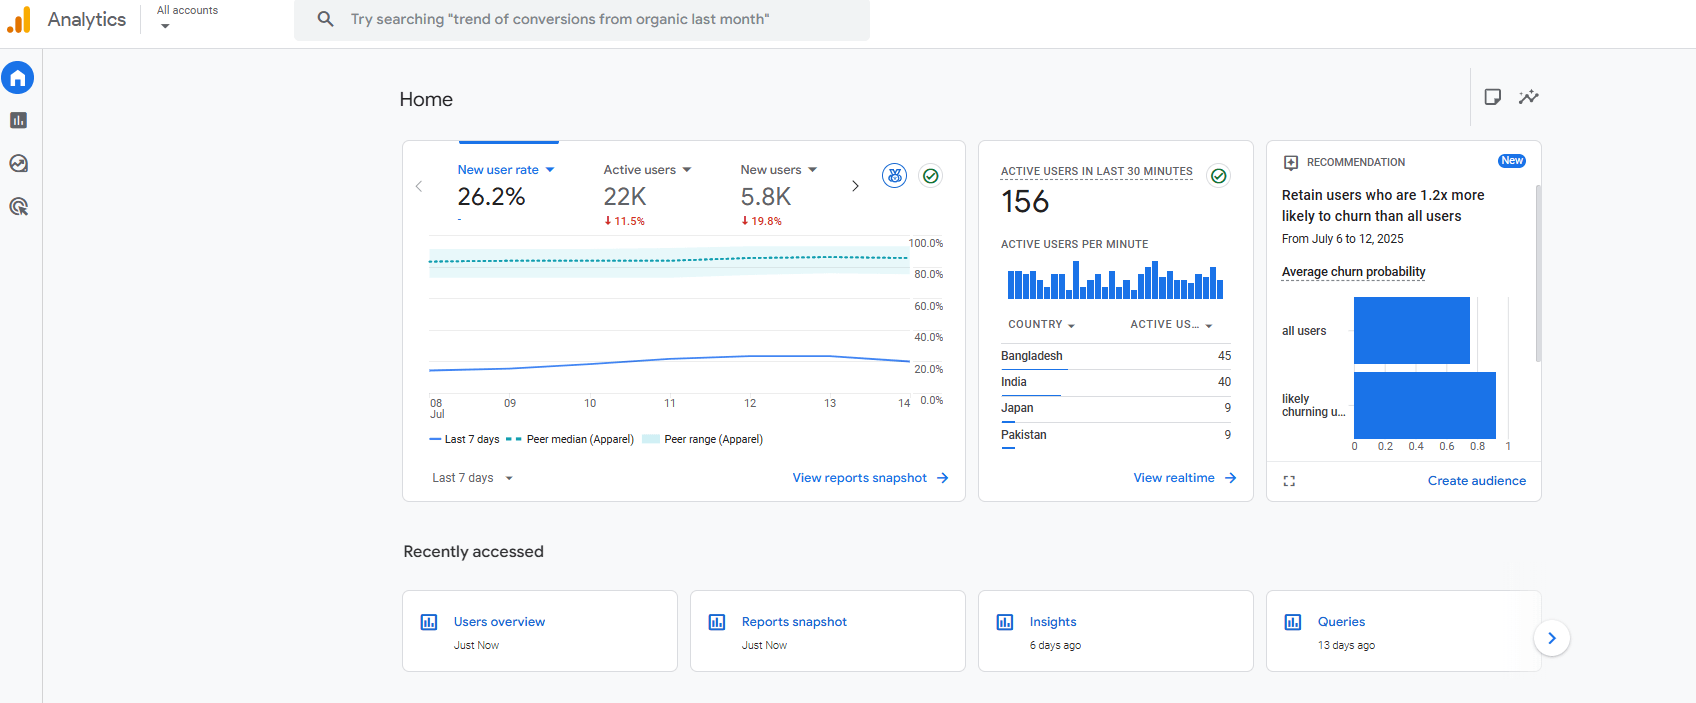
Benchmarking data is not a dedicated report; rather, it’s integrated into the overview card of the GA4 Home Page. If it’s not already on, here’s how to switch on benchmarking to get a view of different event benchmarks:
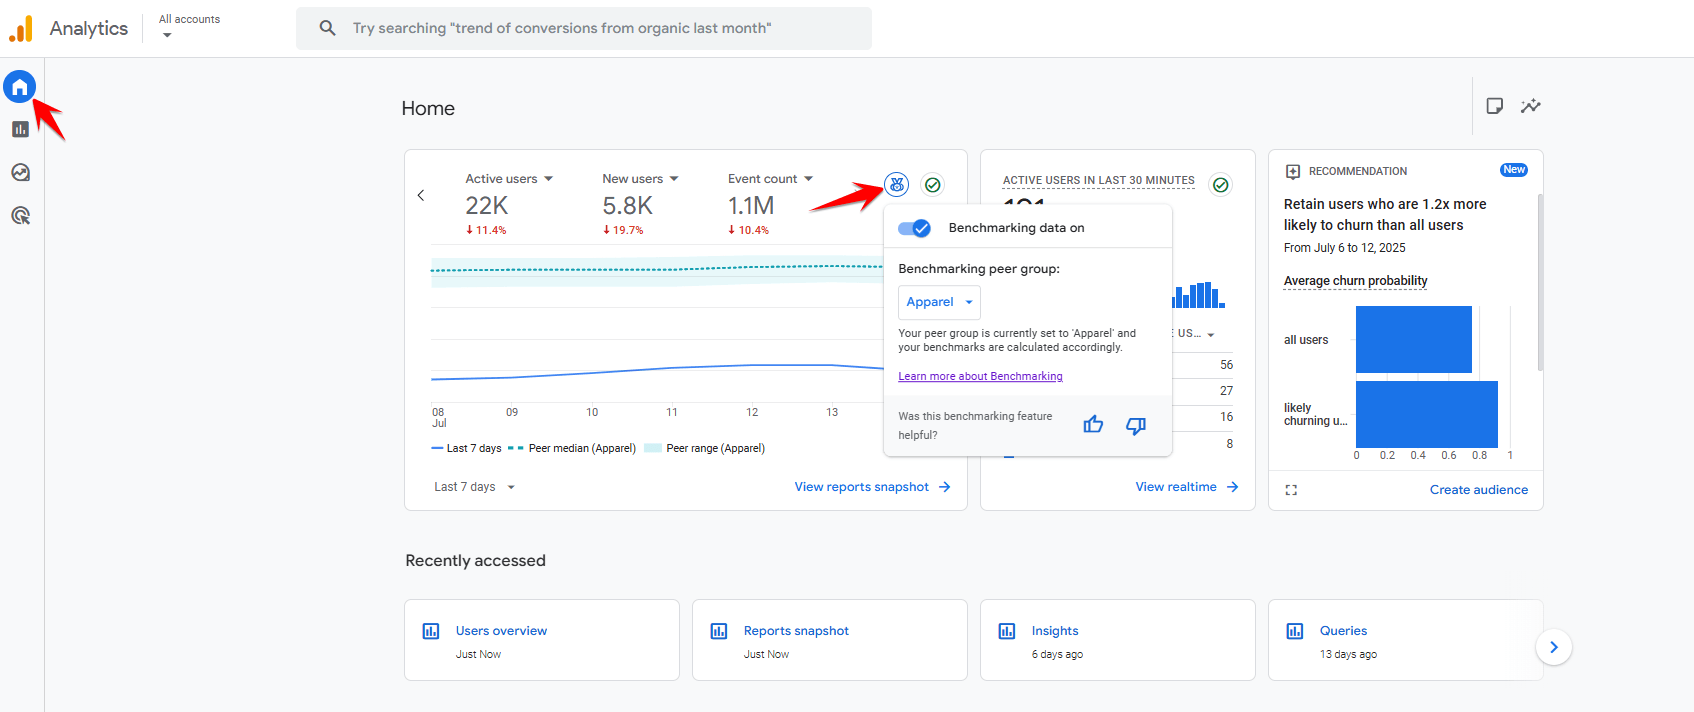
- At the top of the “Home Page,” you’ll find the benchmarking badge at the top right of the overview card.
- On the main overview card, choose the metric to analyze different metrics, such as users, new users, and engagement.
- Select the right metric, whether engagement, acquisition, retention, or monetization, the toggle button is on, and benchmarks appear in the overview card.
Step 2: Analyze benchmarking reports
When benchmarking is on, the overview card presents the following GA4 data:
- A solid line: It’s your property’s trend line that shows website performance for selected metrics over time.
- A dotted line: It’s the median for the peer group, which represents the 50th percentile and the average performance for businesses in your industry.
- A shaded area: The peer range group represents the 25th and 75th percentiles to represent your industry’s performance standard.
You can see specific data points over time by hovering over the trend line. Please note that benchmarking events data is not available before May 30, 2024.
Step 3: Adjust your peer group
A peer group refers to a cohort of businesses in the same industry. It provides access to more meaningful and accurate comparisons. For example, if you sell running shoes, start by selecting a broad category, “Shopping,” then a sub-industry like “Retail,” followed by “Sports Apparel & Footwear,” and finally “Running Apparel & Shoes.”
Adjusting your peer group ensures GA4 provides benchmarks that compare you with businesses selling the same product and at the same scale.
Why benchmark GA4 events?
GA4 events benchmarks are performance standard metrics based on aggregated and anonymized data obtained from multiple sites, apps, industries, and historical performance metrics. Benchmarks will help you understand whether your 10% form submission rate is industry standard or whether the five-minute average watch time on your videos is good or bad compared to competitors.
Benchmarking GA4 events empowers you to compare your digital property’s performance against industry standards and competitors. These benchmarks reveal your strengths, weaknesses, and opportunities, allowing you to make necessary optimizations to improve app or website performance.
Benchmarking GA4 events has numerous benefits for your business, which include:
- Highlights underperforming metrics, allowing you to spot gaps and opportunities
- Helps you set realistic, competitive targets and data-backed goals
- Guides testing and strategy by acting as a baseline for A/B and CRO strategies
- Helps to contextualize your results, making them more digestible to stakeholders
- Provides easy access to historical month-over-month comparisons by default
- See how you stack up against competitors using aggregated industry benchmarks
- Encrypts and protects your data
- Safely compare your business’s performance against industry standards
In simple terms, benchmarks help you see how your website or app is really performing. For example, if your average engagement rate is 52% that’s just a number that may not inspire any action. But GA4 event benchmarks will go an extra mile to state that the industry average is 70 – 85%, meaning you’re way below the average and may need to make some optimizations.
Learn more about GA4 event benchmarks from WebFX
If you still have questions about GA4 event benchmarks, or if you’re wondering how to leverage these to improve your website or app performance. We are a full-service digital marketing agency with expertise and experience in Google Analytics 4.
We can help you navigate the platforms, reports, and benchmarks on GA4 to keep up with your website and app performance. Contact us today online or call us at 888-601-5359 to talk to one of our GA4 experts.
Sources & Methodology
This benchmark sheet is compiled from:
- Multiple industry reports from 2024-2025
- GA4 official documentation and best practices
- Cross-industry performance studies
- Real-world implementation data
- Community insights from analytics professionals
Last Updated: July 2025 Recommended Review Frequency: Quarterly
-
 Lornah Ngugi is a seasoned digital marketing writer with 6+ years of experience translating complex marketing strategies into engaging, results-driven content. She holds a B.S. in Business Information Technology and is certified in HubSpot Academy, Google Analytics, LinkedIn Marketing, and Google Digital Academy. Lornah regularly contributes to the WebFX blog and SEO.com, where she’s authored hundreds of marketing guides that help readers turn their goals into measurable results through practical, data-informed insights. When she’s not writing, you’ll find her enjoying a quiet walk in the park, sipping black coffee, or finding creative inspiration in a good chocolate bar.
 -

WebFX is a full-service marketing agency with 1,100+ client reviews and a 4.9-star rating on Clutch! Find out how our expert team and revenue-accelerating tech can drive results for you! Learn more
Try our free Marketing Calculator
Craft a tailored online marketing strategy! Utilize our free Internet marketing calculator for a custom plan based on your location, reach, timeframe, and budget.
Plan Your Marketing Budget
Share this article

Proven Marketing Strategies
Try our free Marketing Calculator
Craft a tailored online marketing strategy! Utilize our free Internet marketing calculator for a custom plan based on your location, reach, timeframe, and budget.
Plan Your Marketing Budget
What to read next