What is the average cost per click for Google Ads in 2025? The average CPC across industries is $4.51, but costs vary dramatically by sector—with legal services reaching $137.55 for personal injury keywords and insurance averaging $67.73, while some businesses pay as little as $0.11–$0.50 per click.
How does location affect Google Ads pricing? Geographic targeting creates massive CPC variations for identical services—for example, plumbers in Denver pay $59.81 per click (137% above the national average of $25.27), while Birmingham advertisers pay only $15.53 (39% below average).
What do businesses actually spend monthly on Google Ads? Survey data from 350 businesses shows 26% spend under $5,000 monthly, 27% spend $5,001–$10,000, 18% spend $10,001–$50,000, and 29% spend over $50,000—with satisfied advertisers typically allocating 15–35% of their total marketing budget to PPC.
How are AI features changing Google Ads costs and performance? Performance Max campaigns and AI-powered bidding are reshaping the landscape, with success dependent on proper implementation and sufficient conversion data—advertisers using AI optimization report varying results but can find efficiency gains through automated real-time adjustments.
Are businesses satisfied with their Google Ads ROI in 2025? Despite rising CPCs, 54% of businesses report satisfaction with their PPC ROI, 26% plan to increase spending in the next six months, and only 13% plan to decrease spending—indicating that advertisers are finding profitable strategies despite higher costs.
Let’s start here: The average cost per click (CPC) on Google Ads in 2025 is $4.51 based on our analysis of over 10,000 real, commercial-intent keywords. But the real question isn’t just what you’re paying…it’s what you’re getting for it.
In this guide, we’ll help you answer the burning questions every marketing manager, advertiser, and CMO is asking in 2025:
Are my Google Ads costs in line with industry benchmarks?
How much do keywords actually cost in my space … and why do some hit $185 per click?
What’s the average cost per lead (CPL) I should expect?
How much should I budget per month to stay competitive in 2025?
What impact are AI Overviews and Performance Max having on ad performance and CPC?
Is my ad spend really converting into revenue…or just clicks?
We analyzed CPC and volume data from thousands of commercial keywords and surveyed 350 businesses about their actual Google Ads spend. Our research shows where the Google ad market is heading, and how to win within it.
Whether you’re spending $2,000 or $200,000 a month, this breakdown will show you what’s normal, what’s not, and what to do next.
The Current State of Google Ads Costs in 2025: What’s Changed?
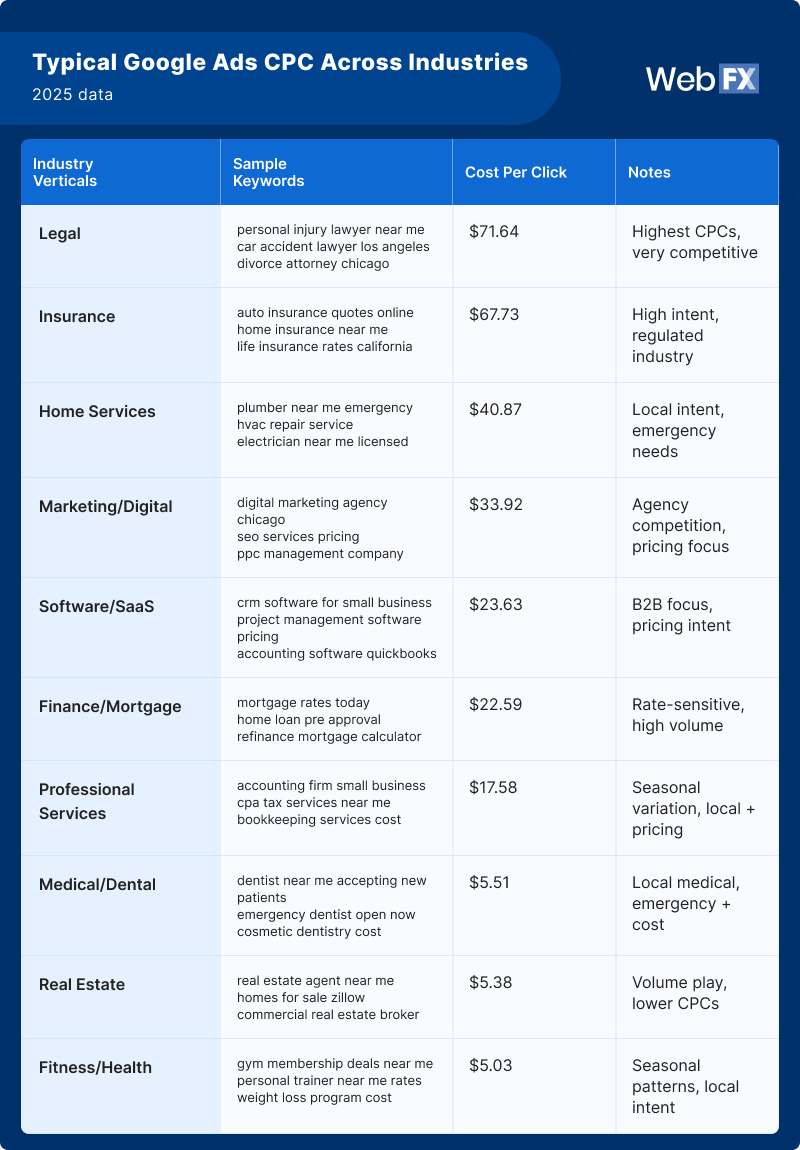
In 2025, the average CPC is $4.51, with the legal and insurance sector seeing some of the highest CPCs at $71.64 and $67.73, respectively.
Google Ads pricing in 2025 tells a story of dramatic shifts and emerging opportunities. After analyzing historical CPC data across major industries, we’re witnessing fundamental changes in how the auction dynamics work.
Industry CPC Benchmarks: 2025 vs Historical Trends
Based on comprehensive keyword data analysis across major industries, here’s what CPCs look like in 2025 compared to historical trends:
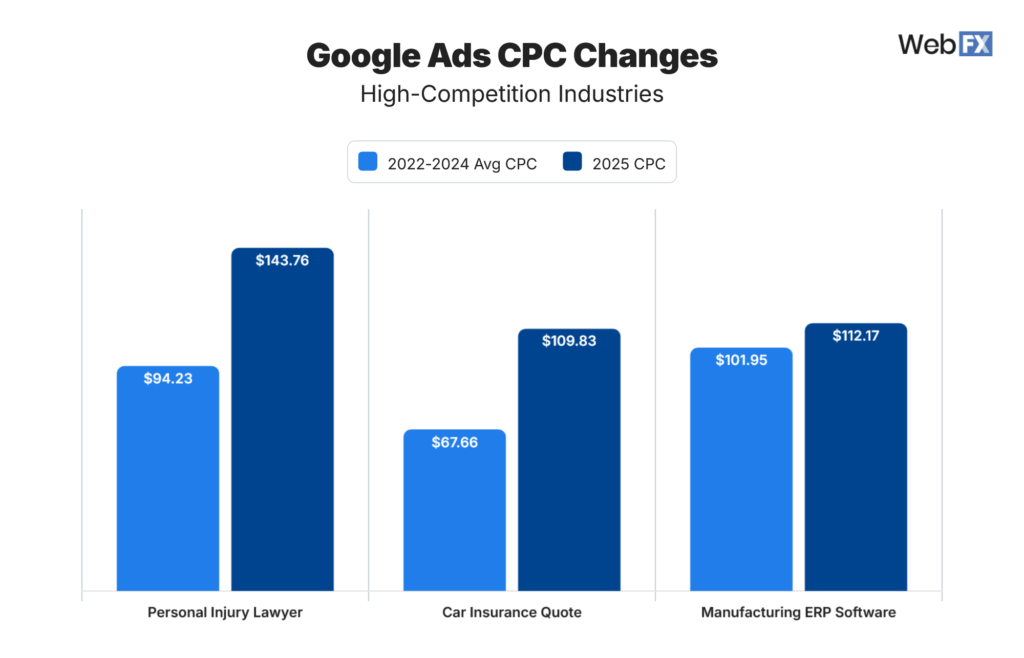
High-Competition Industries ($60+ CPC)
CPCs rose in 2025 across high-competition industries, like legal and insurance, where high lifetime customer value and intense competition drive costs upward.
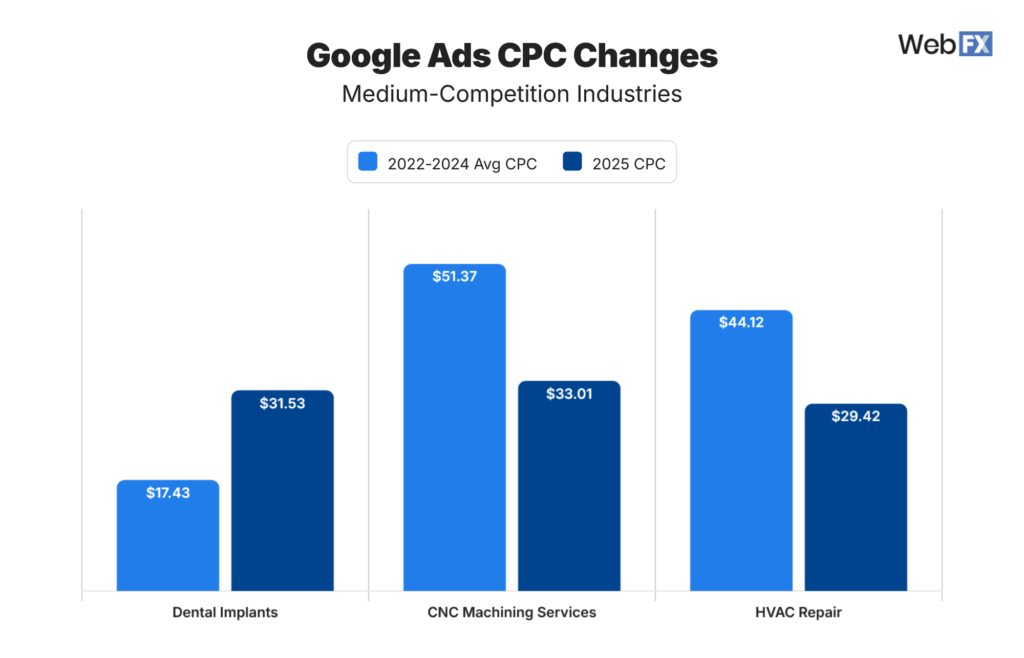
Mid-Range Industries ($10–$30 CPC)
CPCs in medium-competition industries shifted unevenly in 2025, with some sectors rising and others easing, creating pockets of efficiency for targeted bids.
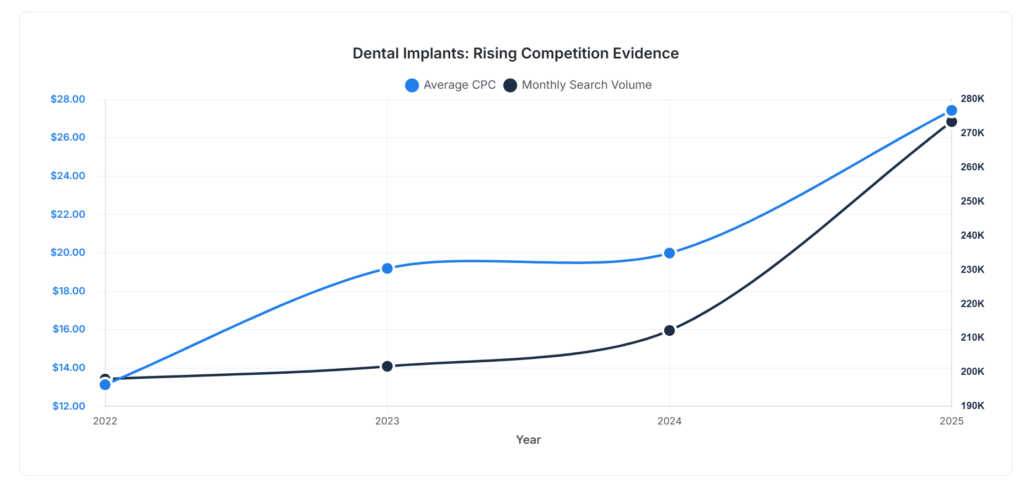
The keyword dental implants represents an important case study around how quickly costs can change in Google Ads.
Rising demand increased dental implant CPCs, which shows how popularity reshapes how much you pay for Google Ads.
Overall, this service has gotten more popular as evidenced by increased search volume (and all of those veneers you see on Instagram nowadays). As the service demand grew, so did competition in Google Ads which increased the CPC.
Key Insights:
Low algorithmic competition doesn’t translate to low CPCs when customer lifetime value is high
Prices can go down! Oftentimes, it feels like everything is getting more expensive but some keywords have seen decreased CPC averages compared to prior years
Costs can vary tremendously depending on industry changes. Dental implants have gotten more popular in 2025, resulting in dramatically rising costs.
Insurance and legal services continue to dominate the highest CPC ranges
Overall, these averages mask the enormous variation by industry and keyword intent.
Location, Location, Location: How Geography Transforms CPC
One of the most overlooked factors in Google Ads pricing? Geographic targeting. Our analysis of location-specific keywords reveals massive CPC variations for identical services:
“Plumber” Keyword CPC by Location
Location
CPC
% Difference from National Avg
National Average
$25.27
—
Denver
$59.81
+137%
Seattle
$25.10
~0%
Chicago
$24.71
−2%
Dallas
$30.18
+19%
Kansas City
$27.80
+10%
Birmingham, AL
$15.53
−39%
What Businesses Actually Spend in Google Ads: Reality vs Theory
Monthly PPC Ad Spend Distribution (350 Businesses)
Spend Range
% of Businesses
Less than $5,000
26%
$5,001–$10,000
27%
$10,001–$50,000
18%
Over $50,000
29%
Actual CPC Reality Check:
When we asked businesses what they actually pay per click on Google Search Network:
Actual CPC Paid (According To Businesses)
CPC Range
% of Businesses
$0.11–$0.50
38%
$0.51–$2.00
29%
$2.01–$10.00
15%
Over $10.00
1%
This massive gap between industry benchmark CPCs and what businesses actually pay reveals a critical insight: most businesses aren’t competing for the highest-competition keywords. They’re finding profitable niches within their industries.
ROI Satisfaction: The Ultimate Metric
Perhaps most importantly, our survey reveals:
54% of businesses report satisfaction with their PPC ROI
26% plan to increase PPC spending in the next six months
Only 13% plan to decrease spending
The satisfied majority shares common characteristics that we’ll explore throughout this analysis.
The Hidden Factors Driving Google Ads Costs in 2025
Beyond basic supply and demand, several macro trends are reshaping Google Ads pricing:
1. The AI Search Disruption
New search patterns are changing the search landscape. While specific appearance rates vary by query type, the introduction of AI-generated results creates both challenges and opportunities for advertisers, with Google reporting increased engagement on commercial queries where AI Overviews appear.
2. Seasonal Volatility Amplified
Our historical data reveals massive seasonal swings becoming more pronounced:
Roofing contractors: $18.55 average CPC but spikes to $60+ during storm season
HVAC repair: Winter and summer peaks reach 3x off-season costs
Tax-related services: 300-400% increases during tax season
3. Industry Consolidation Effects
Major platforms are spending unprecedented amounts on Google Ads. Ahrefs data shows companies like Semrush investing hundreds of millions annually in paid search, forcing smaller competitors to find niche opportunities rather than compete head-on.
The Three-Layer Framework for Google Ads Pricing
Expert insights from
Kayla J.Internet Marketing Specialist
“Google Ads determines your CPC by looking at your ad’s overall quality and how it compares to your competitors’ ads for that particular search. Specifically, Google will consider your ad’s relevance to the keyword, its expected click-through rate for that keyword, and what the overall landing page experience is like for people who search that keyword.
This means that optimizing your landing pages is just as important as optimizing your ad copy. If you have the most enticing, relevant ads but a slow-loading landing page that doesn’t align with the search intent, then not only could your conversion rate suffer, but your CPC could as well.”
After analyzing both CPC data and real-world spending patterns, I’ve identified three distinct layers that determine your actual Google Ads costs:
Layer 1: Base CPC (Industry Foundation)
Your industry sets the baseline, but competition level doesn’t always correlate with CPC:
Personal injury lawyers face $137.55 CPCs with low algorithmic competition
Marketing agencies see lower CPCs despite similar competition levels
The difference? Customer lifetime value and urgency of need
Layer 2: Campaign Type & Network Multipliers
Our survey reveals dramatic cost differences by campaign type:
Search Network Performance:
38% of businesses pay $0.11-$0.50 per click
29% pay $0.51-$2.00 per click
15% pay $2.01-$10.00 per click
Only 1% pay over $10.00 per click
Display Network Performance:
24% pay $0.11-$0.50 per click
26% pay $0.51-$2.00 per click
25% pay $2.01-$10.00 per click
Display consistently costs 30-50% less than Search, but intent quality differs dramatically.
Layer 3: Quality Score & AI Optimization Leverage
Google’s Performance Max campaigns represent the new frontier in automated optimization. Advertisers report varying results, with success heavily dependent on proper implementation and sufficient conversion data for the AI to optimize effectively.
Real-World Budget Allocation: What Works in 2025
Our survey data reveals optimal budget allocation patterns among satisfied advertisers:
PPC Budget as Percentage of Total Marketing Budget:
11% allocate less than 5% (typically testing phase)
36% allocate 6-25% (sweet spot for most businesses)
21% allocate 26-50% (high-growth or PPC-dependent models)
32% allocate over 50% (often e-commerce or lead gen focused)
The businesses reporting highest ROI satisfaction cluster in the 15-35% range…enough for meaningful impact without over-dependence.
The 70-20-10 Rule Evolved for 2025
Based on performance patterns and AI capabilities, here’s the updated framework:
70% to AI-Optimized Core Campaigns: Leverage Performance Max and Smart Bidding on proven keywords
20% to Expansion Testing: New audiences, keywords, and AI-suggested opportunities
10% to Future-Forward Experiments: AI Mode ads, new formats, radical approaches
Starting with campaigns already using 70%+ broad match
Enabling search term matching for query expansion
Allowing AI to adapt creative in real-time
Monitoring search term reports for new opportunities
2. Dayparting 2.0: AI-Informed Scheduling
Beyond basic hour-of-day adjustments, AI now enables:
Predictive dayparting based on conversion patterns
Real-time bid adjustments for micro-moments
Cross-device user journey optimization
3. Geographic Arbitrage Opportunities
Our location data reveals massive opportunity. Target lower-CPC markets first while testing premium markets selectively. A national campaign could prioritize Birmingham ($15.53 CPC) over Denver ($59.81 CPC) for initial scale.
4. Negative Keyword Evolution
High-performing accounts focus on comprehensive negative keyword lists, with many advertisers reporting significant waste reduction through careful exclusion of irrelevant terms. The shift from reactive to proactive negative keyword management represents a major efficiency opportunity.
ROI Reality: What the Data Shows
Our survey data provides concrete ROI insights:
From our Content/PPC/Social Media Pricing Survey (2025):
54% of businesses report satisfaction with their PPC ROI
26% plan to increase PPC spending in the next six months
13% plan to decrease spending
This satisfaction rate, combined with the fact that more businesses plan to increase rather than decrease spending, suggests that despite rising CPCs, many advertisers are finding ways to maintain profitable campaigns.
Industry-Specific Performance Patterns
Based on our CPC analysis and common industry conversion rates:
Legal Services: High CPCs ($137+ for personal injury) require high-value conversions
Home Services: Moderate CPCs ($15-60) with seasonal optimization opportunities
B2B Software: High CPCs ($80-110) justified by enterprise contract values
Healthcare: Moderate to high CPCs ($30-60) with compliance considerations
The Bottom Line: Google Ads Costs Are Rising, But So Is Opportunity
Google Ads costs in 2025 tell a story of transformation, not just inflation. While headline CPCs have increased dramatically in some industries…personal injury lawyers paying 568% more than 2021…the businesses thriving are those embracing new optimization capabilities and finding profitable niches within broader markets.
The data is clear: 54% of businesses report satisfaction with their PPC ROI (according to our survey), and those adapting to new features and strategies are finding ways to succeed despite higher costs. Whether you’re paying $0.50 or $137.55 per click, success comes from understanding your unit economics, leveraging available tools effectively, and optimizing relentlessly toward business outcomes rather than vanity metrics.
The future belongs to advertisers who view Google Ads not as a cost center, but as an investment in predictable, scalable growth. When you know a customer is worth $5,000 over three years, a $50 click becomes a bargain…if you have the systems to convert and retain them.
Ready to transform your Google Ads costs from a budget line item into a revenue driver? WebFX has managed over $10 billion in ad spend across 1,500+ clients, consistently delivering returns that justify the investment. Get your free Google Ads audit and discover exactly how much revenue your budget should be generating.
Cost Per Click (CPC) Calculator
Do you advertise on platforms that charge per click? Use our calculator and figure out exactly how many clicks will fit within your budget.


 Abby is a Digital Marketing Analyst at WebFX, where she implements, optimizes, and tracks SEO and digital marketing strategies that are powered by data for WebFX. With certifications in SEO, Local SEO, and Google Analytics, Abby has implemented hundreds of optimizations and led strategies and initiatives that have helped WebFX improve online visibility, traffic, and leads. Before her time as a Digital Marketing Analyst, Abby was an innovative content writer who created content for WebFX clients in various industries and for WebFX’s own blog and website. When she’s not implementing strategies and optimizations that drive leads and revenue, you’ll find her walking her dog, travelling around Europe, or watching her favorite reality TV show.
 Colton Wilkinson is a Sr. PPC Consultant at WebFX with over a decade of experience designing data-driven marketing strategies for clients across a wide array of industries. Having managed more than $10 million in digital ad spend, Colton helps businesses translate complex digital ecosystems into measurable growth through full-funnel, performance-driven strategy.