
Key Threads marketing benchmarks
Threads marketing benchmarks are performance standards, like the average engagement rate and typical follower growth rates, that help brands understand how their results compare to the platform’s emerging norms. Here’s a quick breakdown of the metrics that matter most for brands on Threads:
| Metric | Benchmark |
| Average engagement rate | 4.51% |
| Engagement trend | 4.76% (early 2024) → 3.60% (Feb 2025) |
| Active users | 275+ million |
| Follower growth pattern | Volatile but rapid for early adopters |
| Post frequency norm | Still emerging, creating a low saturation advantage |
| CTR/Ad benchmarks | Limited, early-stage ecosystem |
Threads represents one of the most significant shifts in text-based social engagement since the early days of Twitter. Yet despite its rapid growth and large user base, the platform offers limited native analytics and few clear indicators of what strong performance actually looks like.
That’s where Threads marketing benchmarks become essential. On a platform where norms and engagement signals change quickly, benchmarks provide a reliable way to evaluate and improve brand performance.
This guide presents the latest 2024–2025 marketing benchmarks for Threads from WebFX’s proprietary analysis, showing how engagement, follower growth, posting frequency, and visibility trends compare — and how to turn those insights into a scalable strategy.
- Why Threads marketing benchmarks matter?
- Threads engagement benchmarks
- Follower growth benchmarks on Threads
- How to use Threads benchmarks to improve performance
- FAQs about Threads benchmarks
Why Threads marketing benchmarks matter?
Benchmarks anchor your performance to measurable standards. Without them, it’s easy to misinterpret what your data is telling you.
For instance, a drop in engagement might suggest content fatigue when the broader platform is experiencing a similar recalibration. However, while a sudden follower surge might feel like a breakthrough, it may actually be reflecting Threads’ natural volatility in surfacing new accounts.
But even with these metrics defined, interpreting marketing performance on a new platform can feel surprisingly unclear. Much like driving a new car for the first time, you trust the smooth ride even when you don’t recognize every icon on the dashboard.
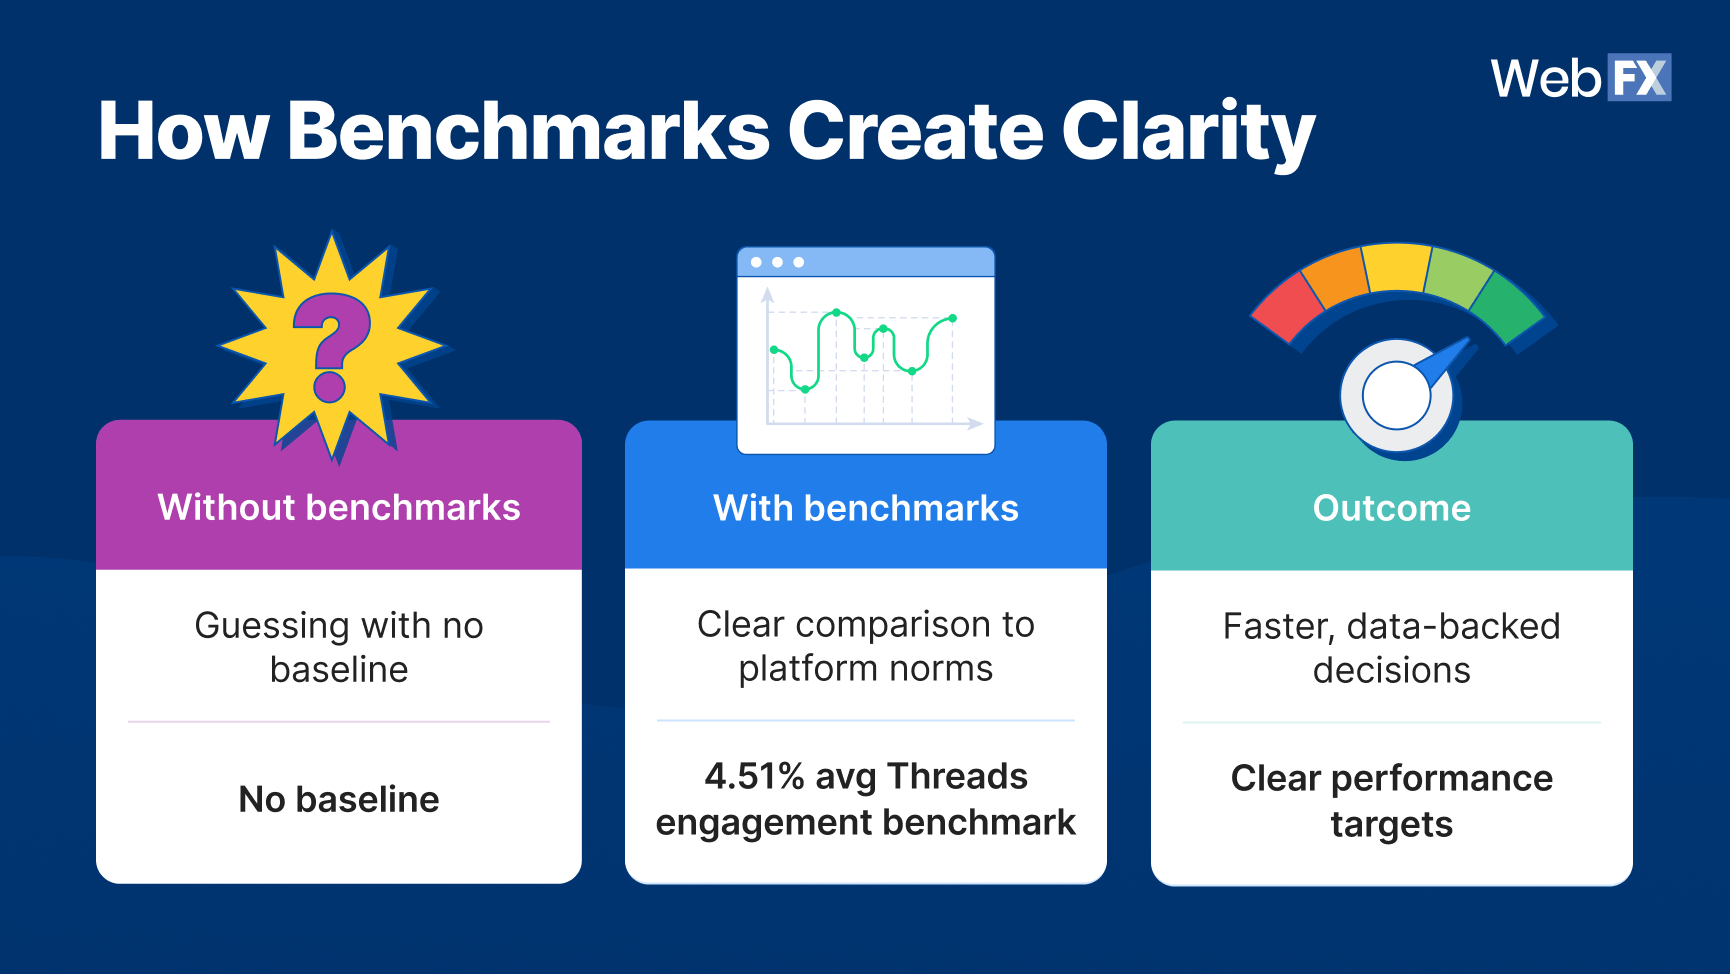
That’s why benchmarks matter. They act like the core dashboard instruments that help you understand whether your strategy is performing as expected or signaling a deeper issue. Without these metrics, it’s easy to misread the platform entirely.
Threads engagement benchmarks
Even though Threads is still relatively new, its engagement rate remains notably high for a text-based network. It’s actually among the strongest indicators of whether your content resonates with the audience you’ve built.
Engagement benchmarks measure how actively users interact with your content. It accounts for likes, comments, replies, reposts, and quote posts relative to your total follower count. Let’s get into exactly what those numbers should ideally look like for a business marketing on Threads:
- Average engagement rate on Threads
- Engagement rate by account size
- What drives engagement on Threads in 2026
Average engagement rate on Threads
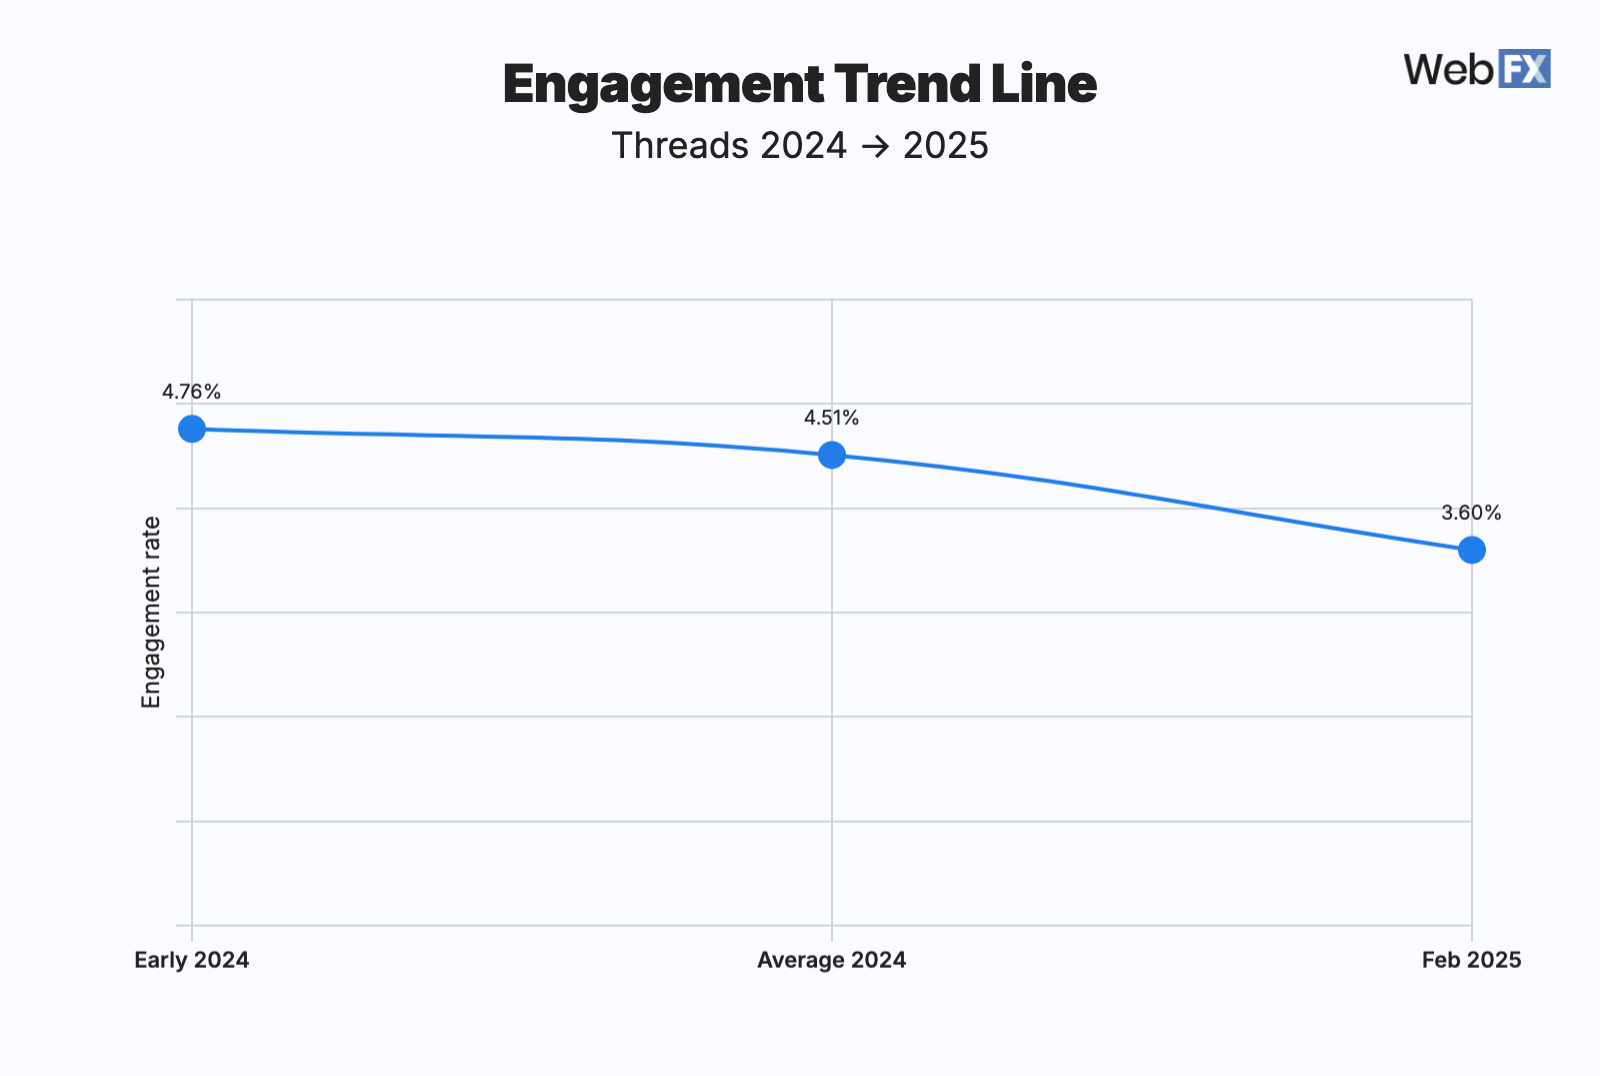
The average engagement rate on Threads is 4.51%, making it one of the most interaction-rich environments for brands experimenting with text-first storytelling.
However, that average hasn’t remained static. Engagement began at an all-time high of 4.76% in early 2024, then dipped to 3.60% by February 2025 as the platform grew, posting volume increased, and novelty leveled off.
This kind of downward shift isn’t unusual. Many social media platforms experience a similar adjustment as posting volume grows and early-stage excitement evens out.
What the average 4.51% Threads engagement rate means for you:
A 4%–5% engagement rate on Threads is currently the baseline for healthy performance. If your engagement rate is at or above this benchmark, your content is resonating with your audience and keeping pace with platform norms. If it falls meaningfully below, it’s a signal to adjust your hooks, content mix, or posting cadence to improve relevance and visibility.
Engagement rate by account size
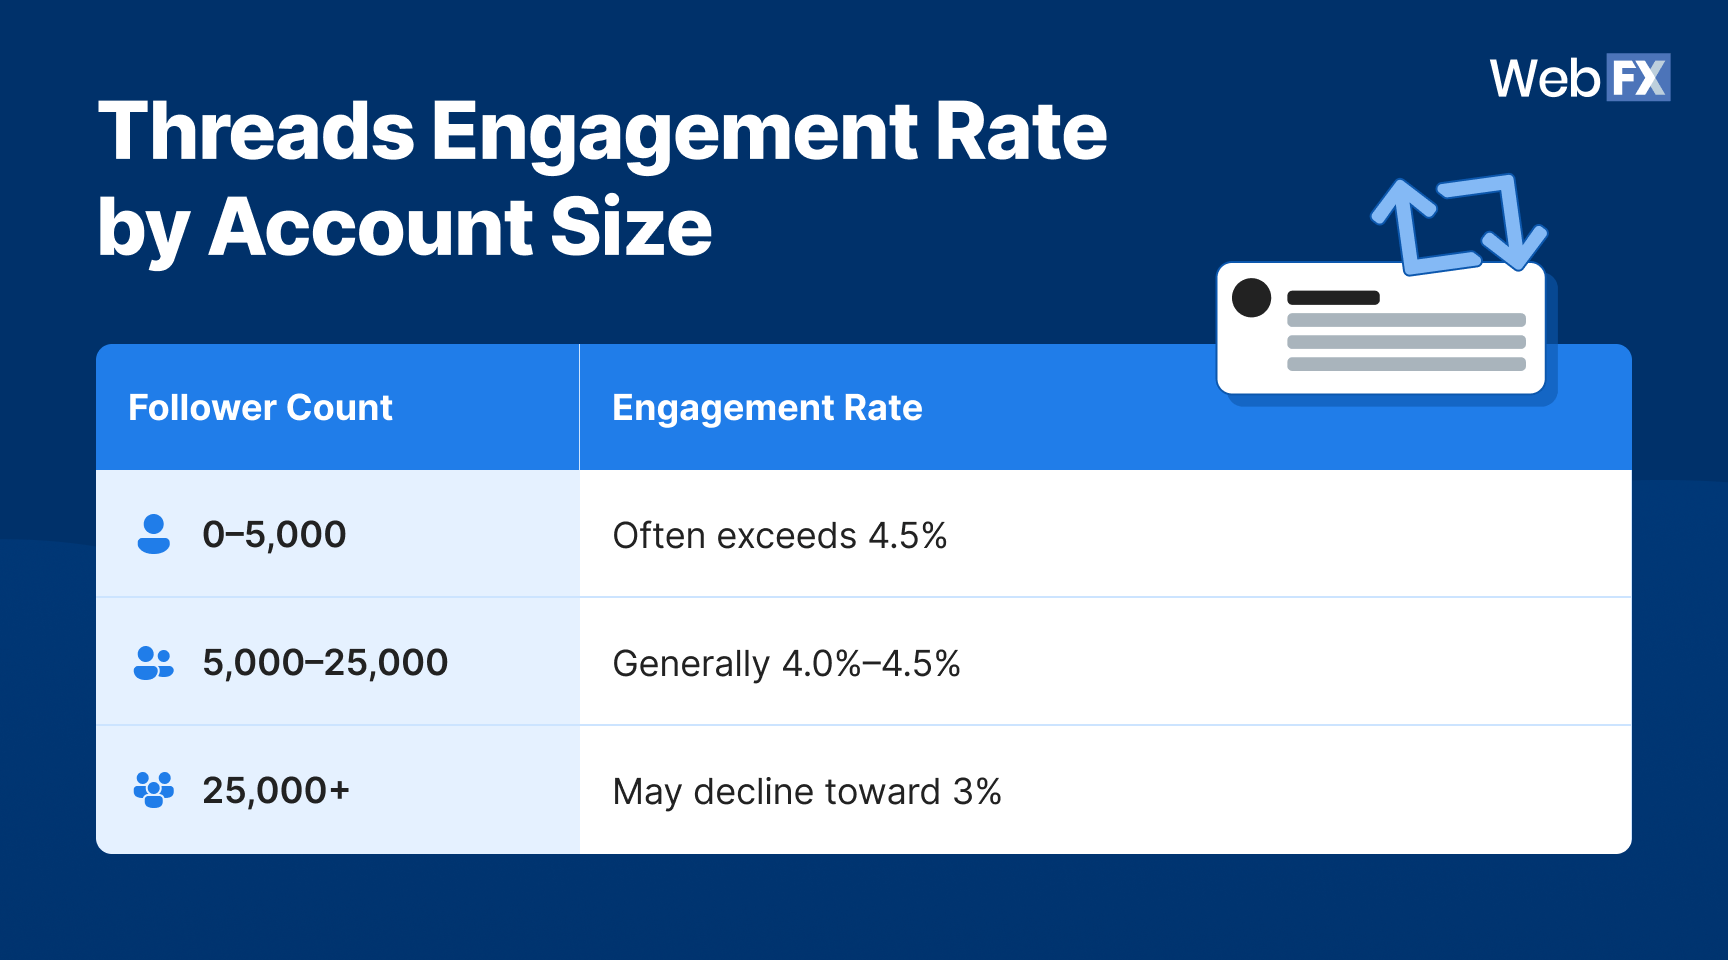
While Threads doesn’t yet provide native category breakdowns, early patterns indicate that smaller accounts often see higher engagement percentages, a trend consistent across many social platforms.
Your engagement rate should be measured relative to your size, not the platform average alone. Comparing a 2,500-follower brand to a 200,000-follower brand will never produce a meaningful insight.
Here’s how Threads engagement rates vary based on typical account sizes:
- 0–5,000 followers: Engagement rates often exceed the 4.5% average.
- 5,000–25,000 followers: Slightly steadier engagement, generally around 4.0%–4.5%
- 25,000+ followers: Engagement may decline toward the 3% range as audiences broaden and passive scrollers increase. This doesn’t signal underperformance — it reflects the natural dilution effect that happens as communities scale.
A Comparison Table highlighting Engagement Rate by Account Size
What drives engagement on Threads in 2026
Early platform behavior shows that engagement increases when brands focus on:
- Conversation-first content: Threads rewards posts designed to spark discussion rather than broadcast updates. Questions, opinions, observations, and cultural commentary tend to outperform static brand announcements or promotional content.
- Clear, concise, scroll-stopping hooks: Short sentences, bold statements, or curiosity-driven openers earn more attention than long paragraphs.
- Timely participation in trends: Because Threads moves quickly, timely commentary often earns higher interaction than evergreen or evergreen-like posts.
- Authentic, unpolished brand voice: The platform leans heavily toward informal, human-first communication. Brands that adopt the “inside voice” of their audience tend to see stronger engagement.
Follower growth benchmarks on Threads
While Threads engagement rates are high, the follower growth rates don’t match up. In fact, the follower counts per account are significantly lower compared to X.
- Average follower growth rates on Threads
- Follower growth by account size
- What drives follower growth on Threads right now
Average follower growth rates on Threads
Understandably, Threads has a smaller audience size of 275 million monthly active users compared to X, with over 586 million monthly active users. The table below shows how distinct the difference in follower counts is between X and Threads.
| Business Size | Typical follow counts Threads | Typical Follow Counts X |
| Small to mid-sized brand | 100–3,000 followers | 10,000+ followers |
| Growing brands | 5,000–20,000 followers | 50,000–100,000 followers |
| Well-known brands and creators | 10%–30% of their X follower count | 100,000–1,000,000+ followers |
Most brands misjudge their performance because they compare themselves to viral accounts, established creators, large brands with massive organic reach, and their own early-stage growth spikes.
This is the reason you can’t rely on follower count only as a benchmark metric, you should always evaluate your growth relative to:
- Your account size
- Your posting cadence
- Your engagement rate
- Platform-wide behavior
- Your previous growth trendlines
What the Threads follower growth rate means for you
Social media platforms always experience uneven growth patterns immediately after launch, and Threads is no exception. With more than 275 million users by late 2024, barely and year after its launch, the audience is expanding rapidly — but follower growth rates can swing significantly depending on:
- How active your brand is
- Whether your content appears in trending Threads or algorithmic recommendations
- How effectively you spark replies or conversations
- Platform-wide shifts in posting volume or user behavior
This means follower growth shouldn’t be assessed in isolation. Instead, it should be evaluated relative to platform norms and account size, two factors that determine what “healthy” growth really looks like.
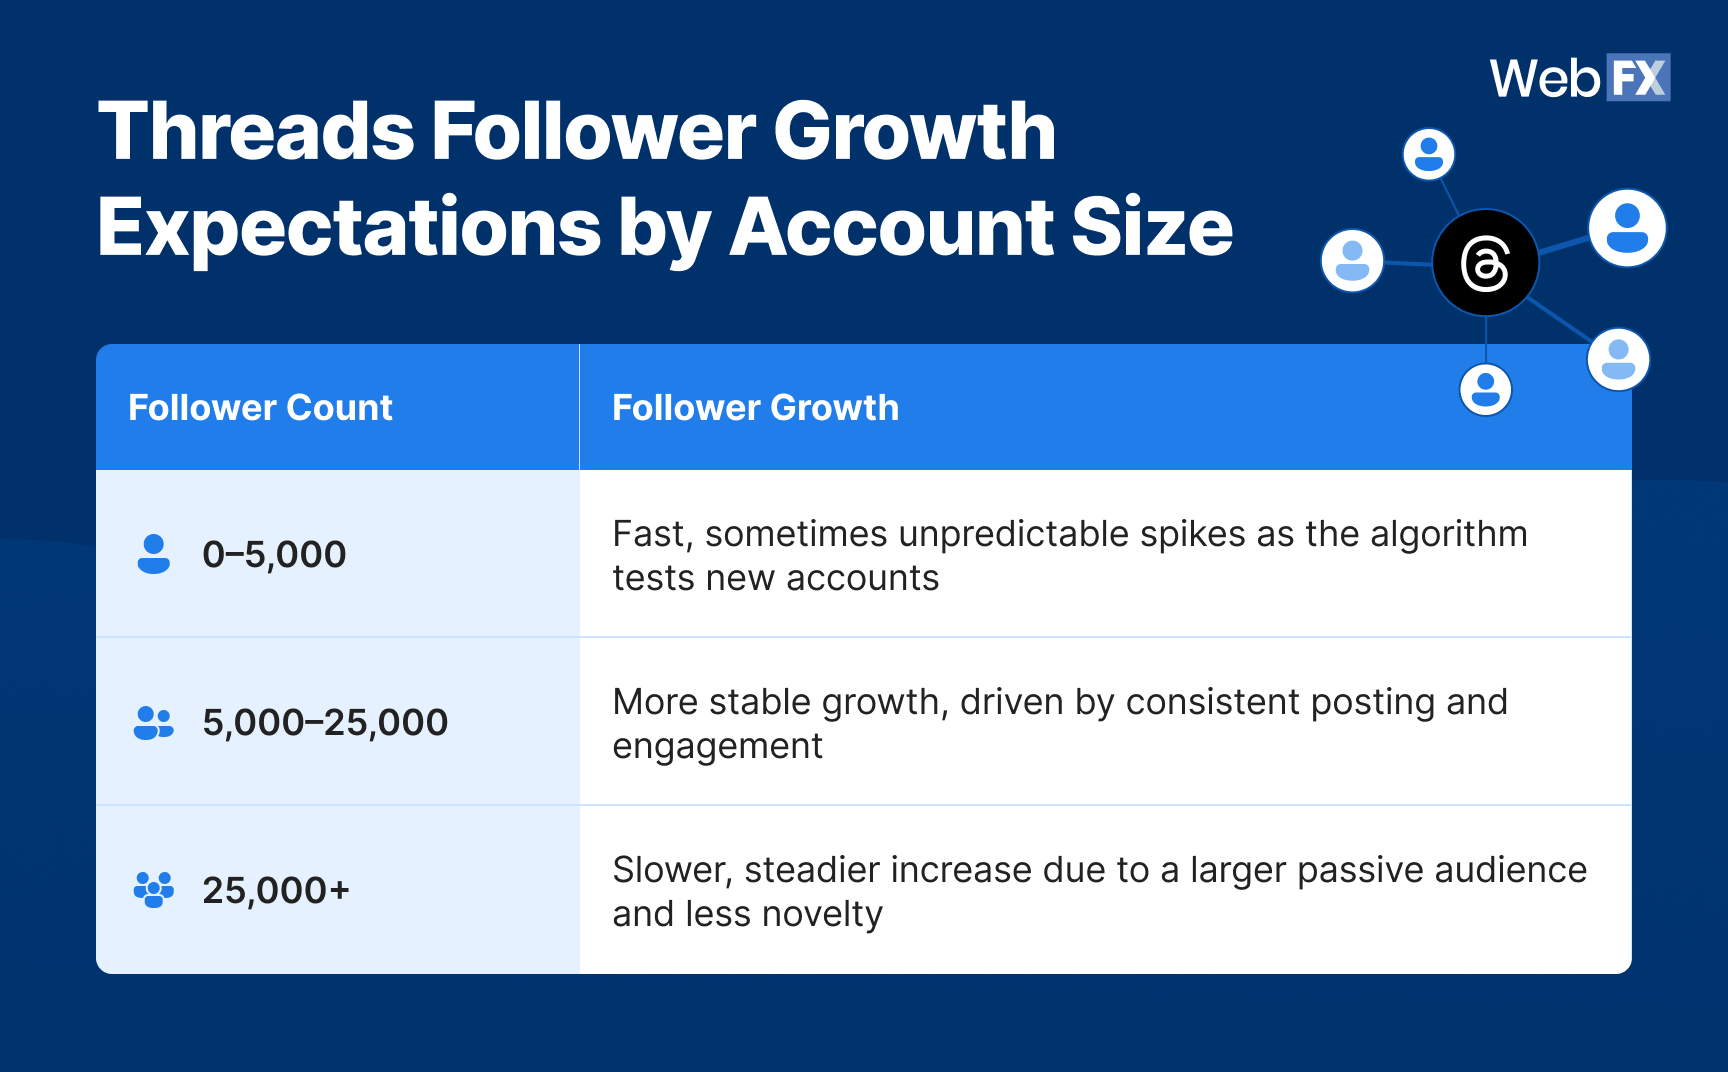
Follower growth by account size
While Threads hasn’t released official follower-growth tiers, we’d like to think it follows the natural pattern seen across most social platforms. This means the smaller accounts grow faster proportionally, while larger accounts grow more predictably.
This typical early platform behavior may look like:
- 0–5,000 followers: Fast, sometimes unpredictable spikes as the algorithm tests new accounts
- 5,000–25,000 followers: More stable growth, driven by consistent posting and engagement
- 25,000+ followers: Slower, steadier increase due to a larger passive audience and less novelty
What drives follower growth on Threads right now
Follower growth on Threads is shaped by a combination of algorithm behavior, content format, timing, and platform culture. Because Threads is still maturing, the levers that drive growth are more dynamic than on established networks — but early patterns are clear and consistent.
- Posting consistently (not constantly): Even without hard posting penalties, accounts that publish regularly, not relentlessly, tend to gain followers steadily. Threads benefits brands that show up predictably in the feed.
- Replying early and often: Much of Threads’ visibility engine runs on replies. Brands that participate in conversations — not just post original content — tend to gain more followers organically.
- Posting content that inspires conversation: Question prompts, thought-starters, short opinions, and quick reactions outperform polished promotional content.
- Leaning into identity and voice: Because Threads rewards authenticity, brands with a clear, relatable voice attract followers more quickly.
- Timely engagement with cultural or industry moments: Posting Threads tied to timely topics drives higher visibility and accelerated follower growth.
How to use Threads benchmarks to improve performance
Benchmarks act like a performance compass: they show you where you are, where you should be, and what to adjust when your numbers fall out of range.
Understanding Threads benchmarks is only the first step — the real value comes from using them to guide decisions, refine your content strategy, and improve results over time.
1. Identify performance gaps
Comparing your recent performance to Threads’ current benchmarks will help you understand whether you’re in the healthy engagement rate range of 4%–5%. Better yet, whether your audience is expanding at a steady, sustainable pace.
To understand whether you’re in the healthy Threads engagement rate range of 4%–5%, export the last 30 days of your Threads analytics. Then calculate your engagement rate per post and your net-new follower growth for that period.
Compare those numbers to the platform benchmarks and steady, incremental follower growth based on your account size. Flag any weeks where engagement dips below 4% or follower growth stalls, so you know where deeper content or cadence adjustments are needed.
2. Optimize Threads campaigns
By understanding what good performance actually looks like, you can implement changes that drive engagement and performance. Look for the weak spots in your Threads campaigns.
For instance, if your engagement rate meets or exceeds the 4–5% benchmark but follower growth lags, increase your reply volume on Threads (aim for 10–15 meaningful replies per day) and test two conversation-led posts each week.
Alternatively, if engagement is below benchmark, test three new hook formats over the next two weeks and track which ones lift engagement above 4.5%. The threshold that typically signals strong audience resonance and algorithmic reach.
3. Set realistic goals
Use benchmarks to set realistic and strategic goals you can work toward every month or every quarter. For example, you could set a goal like“Maintain a 4.5%–5% engagement rate and increase followers by 5%–10% relative to current account size in Q2.”
To ensure you stay on track, review performance weekly. If you fall below target for two consecutive weeks, adjust one variable (posting cadence, content theme, or conversation prompts) before making broader changes.
4. Create a baseline for testing
With benchmarks, you don’t have to guess what’s working and what’s not. Instead, they’ll show you which hook styles, post lengths, timing, topics, and conversation prompts are driving desired results.
So, how do you set the baseline? Document your current “baseline” metrics, like average engagement rate, follower growth, post frequency, and reply volume, in a simple spreadsheet or dashboard.
When running experiments, change one variable at a time for 2–4 weeks (e.g., hooks, timing, post length, topics). Then compare outcomes directly against your baseline to identify which changes reliably outperform the 4%–5% engagement benchmark.
FAQs about Threads benchmarks
What are Threads’ marketing benchmarks?
Threads marketing benchmarks are performance standards, such as engagement rate, follower growth, posting frequency, and visibility. They help brands gauge whether their content is performing above, at, or below Threads platform norms. By analyzing benchmarks, you get the context needed to make informed decisions on a platform that is still evolving.
What is a good engagement rate on Threads?
Based on our proprietary analysis, a healthy engagement rate on Threads currently sits between 4%–5%. Falling significantly below this range suggests your content may not be generating enough replies, conversation, or interaction to keep pace with the platform’s emerging standards.
How often should brands post on Threads?
Brands tend to see the strongest, most sustainable results when posting 3–5 times per week. Threads doesn’t reward posting more just for the sake of volume, and unlike other platforms, they don’t penalize higher posting volume. They do, however, reward brands that consistently post conversation-driven content.
What is a normal follower growth rate on Threads?
Threads’ follower growth is high but volatile, especially for newer accounts. Growth often follows a “surge → settle → stabilize” pattern, where early growth is rapid, then normalizes as your audience matures.
A normal growth rate depends on:
- Account size
- Posting consistency
- Engagement rate
- Participation in conversations
In general, steady week-over-week increases — even modest ones — are a healthy sign.
How do Threads metrics compare to other social platforms?
While Threads is still young, early data shows its engagement rate remains notably higher than many mature text-first platforms, where engagement tends to decline over time. For example, engagement rates on X often sit well below 1% for most brands, while Threads’ current healthy range is closer to 4%–5%.
This doesn’t make Threads “better,” but it does mean early adopters often see higher interaction relative to follower count compared to older networks, where feeds are more saturated, and engagement behaviors are more passive.
Elevate Threads performance with a benchmark-backed strategy
Competing on a fast-moving platform like Threads takes more than a casual posting cadence. Thankfully, benchmarks give you clarity they’ll help you understand where your engagement, follower growth, and posting frequency stand relative to emerging platform norms.
While you can refer to these benchmarks and optimize accordingly, you shouldn’t be oblivious of the fact that Threads and other social media platforms are evolving, and evolving fast! So you need to maintain a level of agility to show up consistently, participate in real conversation, and adapt quickly as the platform evolves.
That’s where a partner comes in. With 30+ years of digital experience and a team of 750+ experts who live and breathe social performance, WebFX can help you turn benchmark insights into daily decisions that move the needle. We’ll help you optimize your Threads performance with sharper hooks, stronger conversations, smarter posting cadence, and content that earns replies, not just impressions.
Get in touch with us online or call 888-601-5359 to speak with a strategist today and start planning how to build a strategy that consistently outperforms the benchmark — and your competitors.
Sources and Methodology
This report combines proprietary Threads performance data drawn from in-house account analysis with select third-party platform and market intelligence to establish current Threads benchmarks. Our analysis reflects real-world posting, engagement, and follower-growth patterns observed across brands actively publishing on Threads.
-
 Lornah Ngugi is a seasoned digital marketing writer with 6+ years of experience translating complex marketing strategies into engaging, results-driven content. She holds a B.S. in Business Information Technology and is certified in HubSpot Academy, Google Analytics, LinkedIn Marketing, and Google Digital Academy. Lornah regularly contributes to the WebFX blog and SEO.com, where she’s authored hundreds of marketing guides that help readers turn their goals into measurable results through practical, data-informed insights. When she’s not writing, you’ll find her enjoying a quiet walk in the park, sipping black coffee, or finding creative inspiration in a good chocolate bar.
 -

WebFX is a full-service marketing agency with 1,100+ client reviews and a 4.9-star rating on Clutch! Find out how our expert team and revenue-accelerating tech can drive results for you! Learn more
Twitter and Facebook Status Generator
Finding engaging social media content for your business can be difficult. Use our tool to quickly find ideas and post directly to your page.
Give Me an Idea
Share this article

Social Media Success Story

Twitter and Facebook Status Generator
Finding engaging social media content for your business can be difficult. Use our tool to quickly find ideas and post directly to your page.
Give Me an Idea