
Meta marketing benchmarks at a glance
- Engagement: Facebook click-through rates average 0.72%–1.49%, while Instagram sees 0.22%–0.88% for Feed ads and 0.33%–0.54% for Stories, with overall Instagram engagement at 0.50%, down 28% YoY.
- Cost Efficiency: Facebook CPC averages $1.06–$1.72, compared to Instagram’s higher $3.35 (Feed) and $1.83 (Stories).
- Reach Costs: CPM is comparable across platforms, averaging $7.47 on Facebook and $6.25–$7.68 on Instagram.
- Performance: Facebook conversion rates range from 2%–14% by industry, with an average ROAS of 2.79.
Are you among the 8 million advertisers using the Meta platforms to reach your audience? If so, then you’ve probably scratched your head several times thinking, “Are my results any good?”
We have just the answer for you! Meta marketing benchmarks. Facebook and Instagram marketing benchmarks help you compare campaign performance to industry standards, enabling you to uncover competitive opportunities and optimize your campaigns.
We’ve rounded up the most significant Meta marketing benchmarks to give you a clear picture of what performance looks like across different metrics in 2024–2025.
- How to use Meta marketing benchmarks
- How your Facebook & Instagram Ads stack up in 2025
- Key Facebook advertising benchmarks
- Key Instagram advertising benchmarks
- FAQs about Meta marketing benchmarks
How to use Meta marketing benchmarks
Knowing how your campaigns compare to industry averages is only the first step — what you do with that data determines whether your Meta marketing delivers real ROI.
Facebook and Instagram benchmarks act as a solid guide to improving campaign performance. However, you shouldn’t take them as the gospel truth! That’s because benchmarks are not static. They change in response to consumer trends, seasonal fluctuations, and advertising competition.
As a result, the goal with benchmarks isn’t to hit an exact number. It’s to identify what’s working, what’s wasting budget, and where strategic testing can close the gap.
But, as imperfect as they are, there are some very effective ways you can use Meta marketing benchmarks, like:
- Setting realistic goals for subsequent social media ad campaigns
- Tracking campaign trends over time
- Forecasting revenue, sales, and lead shifts
- Identify gaps between your performance and industry averages
How your Facebook & Instagram Ads stack up in 2026
Marketers continue to rely on Meta platforms — specifically, Facebook and Instagram — to drive performance across every stage of the sales funnel. But social media ad costs and engagement rates have shifted significantly over the past year.
Below are the latest Meta benchmarks to help you evaluate how your campaigns stack up in 2026.
Key Facebook advertising benchmarks
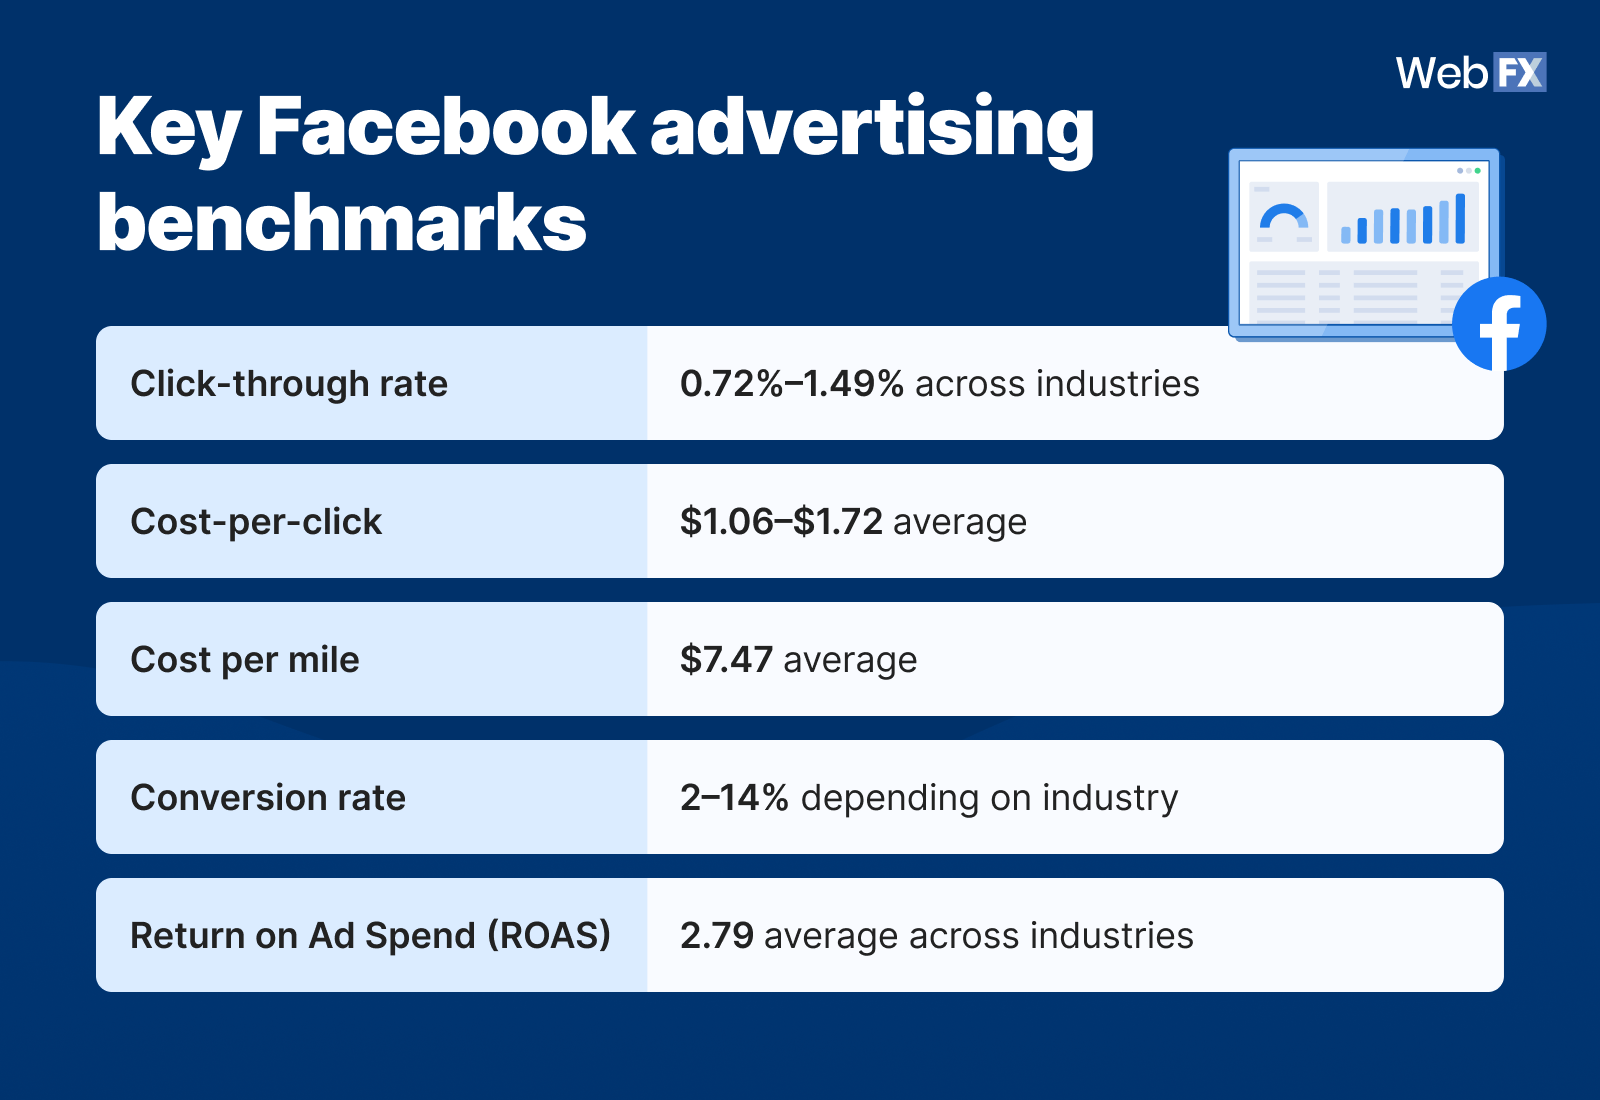
Facebook ads benchmarks provide you with a baseline for your campaign performance. Some of the metrics that matter most when evaluating Facebook ad campaigns include:
🔽 Table view
| Click-through rate | 0.72%–1.49% across industries |
| Cost-per-click | $1.06–$1.72 average |
| Cost per mile | $7.47 average |
| Conversion rate | 2–14% depending on industry |
| Return on Ad Spend (ROAS) | 2.79 average across industries |
1. Click-through rates (CTR)
The CTR measures the percentage of Facebook users who saw and clicked on your ad. A higher CTR shows that your ad is resonating with your audience thanks to relevant and engaging messaging.
If it’s higher than 1.49%, congratulations, your ads are better than most of your competitors, meaning you’ll pay less and enjoy a higher quality score.
If your CTR is lower than 0.72% it shows that your audience is not connecting with your ads, and you need to narrow your target audience, refine your copy, and try out new visuals.
2. Cost per click (CPC)
CPC indicates the amount you spend on each ad click. If your CPC is running lower than the $1.06 industry average, then you can attract more Facebook users at the same budget. A low CPC is typically a sign of efficient ad spend, effective targeting, and strong creative performance.
A higher CPC is a double-edged sword.
On one end, it may mean you’re in a crowded niche or have a low ad relevance score. On the other end, a CPC of over $1.72 on average may mean you’re reaching a high-intent and more qualified audience. Besides, in B2B and professional services with higher lifetime values and longer sales cycles, you should expect to pay a premium CPC, but the ROI will be worth it.
But when your CPC climbs above $1.72 and your ROAS or conversions don’t follow suit, it’s a signal to dig deeper rather than just lowering bids. You should reassess your audience targeting to reach higher-value customers, try new creative formats such as reels versus static images, and adjust campaign timings for better conversions.
3. Cost per mille
CPM shows how much you pay to show your ad 1,000 times. It reflects the competition and demand in the auction. A rising CPM often means more advertisers are targeting similar audiences and appearing in front of a more targeted audience.
If your CPM is significantly higher than $7.47, consider testing different placements (such as Reels or Stories) or targeting broader audiences to find a more cost-effective reach. If it’s much lower, ensure your impressions are reaching quality users — not just cheap but irrelevant views.
4. Conversion rate
What’s the end goal of your Facebook ad campaign? More profile visits? Direct purchases? More bookings? The conversion rate measures the percentage of users who take the desired action after clicking your ads.
A conversion rate higher than the average 14% is a good indicator that your landing page copy and call-to-action match your ads. It also shows that your marketing funnel is well-optimized, making it easier to optimize.
A lower-than-average conversion rate indicates issues with the landing page, offers, and post-click experience. You can turn things around by optimizing the landing page to ensure it aligns with your ad messaging and simplifies the conversion path.
5. Return on ad spend (ROAS)
ROAS is the ultimate profitability indicator for your campaigns. It shows how much revenue you earn for every dollar spent on ads. A ROAS of 2.79 means you make $2.79 in revenue for each $1 spent on Facebook ads.
A ROAS below 2 suggests your campaigns might not be profitable once Facebook advertising costs are factored in. So, you’re below the benchmark — optimize your audience targeting, landing pages, and conversion tracking setup. A ROAS between 3 and 5 is typically considered healthy for most industries.
Key Instagram advertising benchmarks
Metrics on Instagram tend to look very different from Facebook’s. That’s mostly because the Instagram algorithm is different, users interact with content more passively on the platform, and it leans heavily toward visual discovery rather than direct clicks.
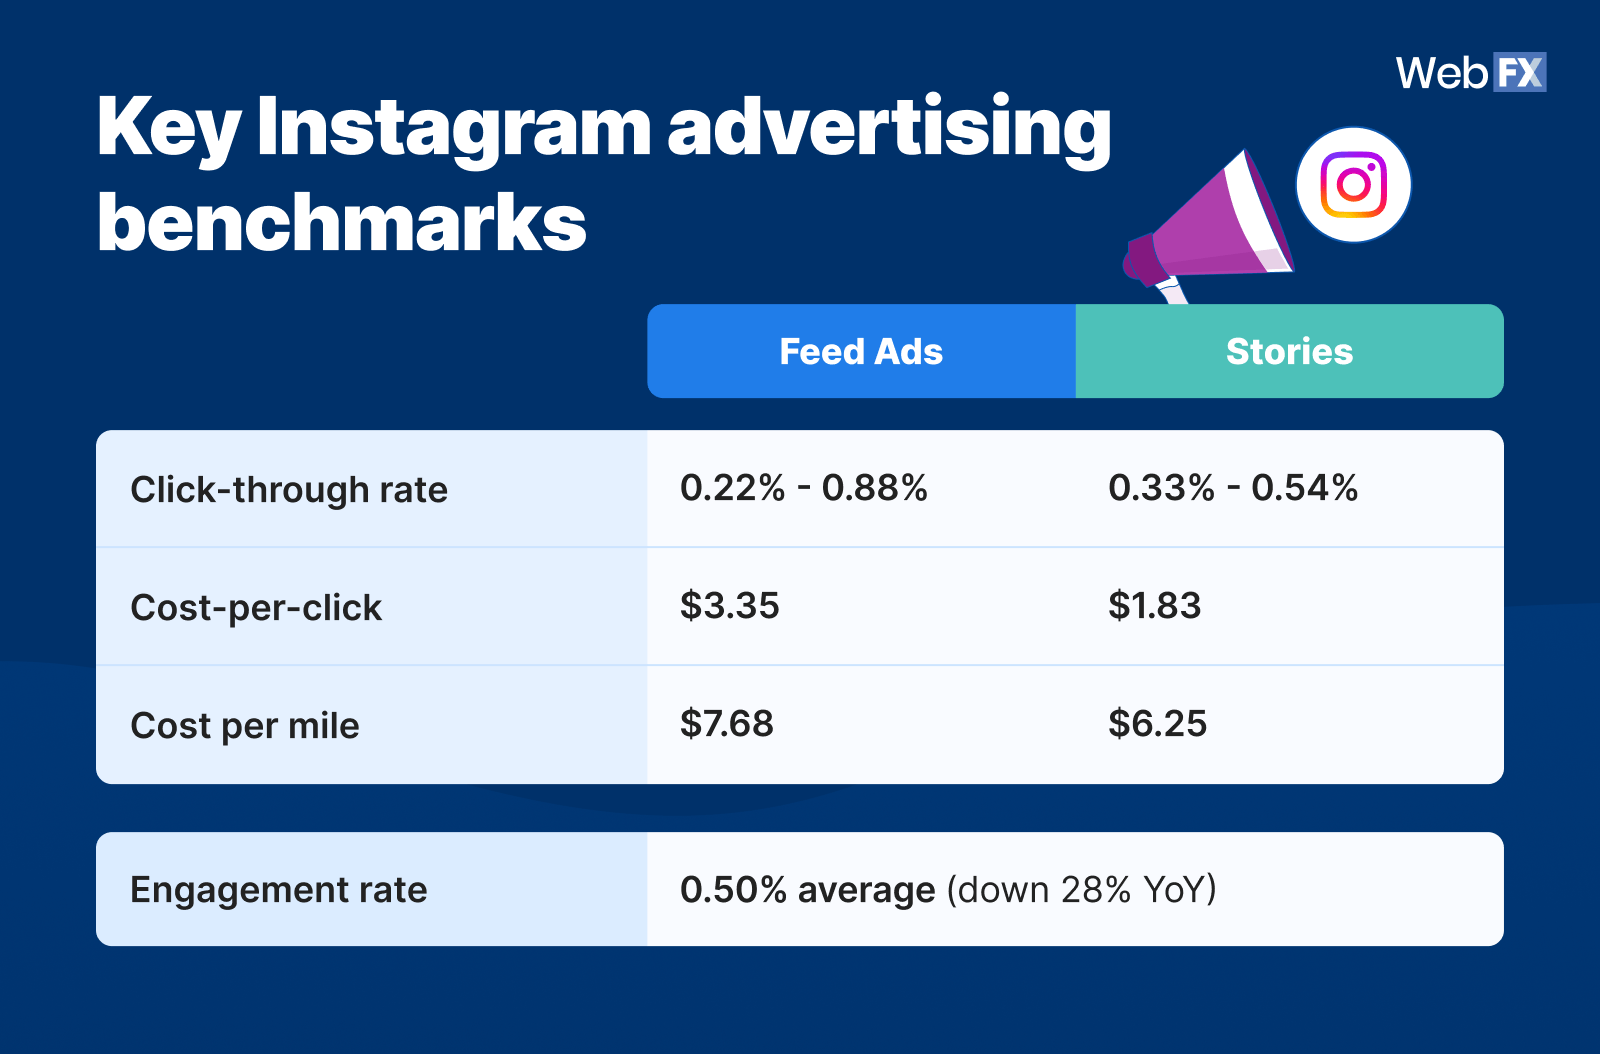
Additionally, Instagram users interact differently with ads on the Feed and stories. So, the Instagram ads benchmarks are typically split between Feed and story ads.
Below is a detailed look at the latest Instagram advertising benchmarks and what they mean for your business.
🔽 Table view
| Click-through rate | 0.22% – 0.88% for Feed ads
0.33% – 0.54% for stories |
| Cost-per-click | $3.35 for Feed ads
$1.83 for story ads |
| Cost per mile | $7.68 for Feed ads
$6.25 for stories |
| Engagement rate | 0.50% average (down 28% YoY) |
1. Click-through rate
Instagram CTRs are lower on average compared to other social media platforms due to its visual-first format. Feed ads (0.22–0.88%) often perform better for upper-funnel goals, such as creating brand awareness, encouraging engagement, and driving website traffic.
Contrastingly, story ads (0.33–0.54%) work well for quick CTAs and brand moments. If your CTR is below 0.3%, consider testing more native, scroll-stopping creatives that fit seamlessly into users’ Feeds. You should also try out different Reels placements to see if your click-through rates will improve.
2. Cost-per-click
At $3.35 (Feed) and $1.83 (Stories), Instagram CPCs are steeper than Facebook’s — reflecting a more engaged but premium audience. The Instagram audience also scrolls more casually and quickly, and the competition there is fierce, so you don’t get as many clicks on the same budget as you would on Facebook or TikTok.
Story ads clicks are cheaper because they’re full-screen and more immersive. A CPC below $2.00, especially in Stories, indicates efficient audience targeting and strong creative resonance.
You don’t have to freak out if your CPC is way above the $3.35, especially in industries with high-intent or long sales cycles, like finance, real estate, or B2B. If your CPC is rising, test shorter captions, fresher creatives, and targeted lookalike audiences.
3. Cost-per-mille
Instagram’s CPM averages $7.68 for Feed and $6.25 for Stories. These numbers reflect competition for attention on a highly visual, brand-driven platform. Brands get slightly more impressions on Instagram ads than Facebook ads due to visual competition and premium ad inventory.
You should be worried when your CPM is below $6 because it shows you’re reaching a broad and less-qualified audience. When it’s above $10, it suggests high competition for your target demographic.
Keep your visuals polished and consistent with your brand aesthetic to justify higher spend.
4. Engagement rate
Algorithm changes and ad saturation have dipped engagement rates on most platforms, but Instagram remains one of the strongest platforms for top-of-funnel engagement. Engagement rates on Instagram average 0.50%, down 28% year-over-year.
While engagement is declining overall, short-form video, like Reels, still generates above-average interaction, making them key to maintaining visibility. Engagement rates below 0.3% may indicate creative fatigue or poor audience relevance.
You can improve your Instagram engagement rate by using Reels strategically, leveraging interactive story features, and optimizing based on benchmarks and campaign results.
FAQs about Meta marketing benchmarks
What are Meta marketing benchmarks?
Meta marketing benchmarks are average performance metrics for Facebook and Instagram ads across industries. They help advertisers compare their campaign results, like CTR, CPC, and ROAS to industry standards and identify areas for optimization.
Why are Instagram ad costs higher than Facebook?
Instagram CPCs average $3.35 for Feed ads and $1.83 for Stories—higher than Facebook’s rates—because Instagram has a more engaged but premium audience, fierce competition, and users who scroll more casually, resulting in fewer clicks per dollar spent.
What ROAS should you aim for on Meta platforms?
A Facebook ROAS of 2.79 means earning $2.79 for every $1 spent on ads, with rates between 3–5 considered healthy for most industries, while anything below 2 suggests campaigns may not be profitable after factoring in advertising costs.
How often do Meta advertising benchmarks change?
Benchmarks shift throughout the year based on factors like ad competition, seasonality, platform algorithm updates, and consumer behavior. Reviewing them quarterly ensures your strategy stays competitive.
Where can I find updated Meta benchmarks?
You can bookmark this page for the latest 2024–2025 Meta benchmark updates or reach out to WebFX for personalized performance insights tailored to your industry.
Don’t just meet the benchmarks — beat them with WebFX
Understanding Meta marketing benchmarks is only half the battle. The other half is turning those insights into growth that takes strategy, testing, and ongoing optimization.
With Meta’s algorithms, targeting options, and ad formats constantly changing, interpreting all that performance data requires high-level expertise and time to optimize. Without the right strategy, creative testing, and optimization tools, it’s easy to waste ad spend instead of improving ROI.
That’s where WebFX comes in. Our Meta marketing specialists help you turn benchmark insights into measurable growth — lowering costs, improving ROAS, and building campaigns that outperform industry averages.
Request your free Meta ad strategy review if you’re ready to transform your Meta marketing performance with the #1 rated social media advertising agency.
-
 Lornah Ngugi is a seasoned digital marketing writer with 6+ years of experience translating complex marketing strategies into engaging, results-driven content. She holds a B.S. in Business Information Technology and is certified in HubSpot Academy, Google Analytics, LinkedIn Marketing, and Google Digital Academy. Lornah regularly contributes to the WebFX blog and SEO.com, where she’s authored hundreds of marketing guides that help readers turn their goals into measurable results through practical, data-informed insights. When she’s not writing, you’ll find her enjoying a quiet walk in the park, sipping black coffee, or finding creative inspiration in a good chocolate bar.
 -

WebFX is a full-service marketing agency with 1,100+ client reviews and a 4.9-star rating on Clutch! Find out how our expert team and revenue-accelerating tech can drive results for you! Learn more
Twitter and Facebook Status Generator
Finding engaging social media content for your business can be difficult. Use our tool to quickly find ideas and post directly to your page.
Give Me an Idea
Share this article

Social Media Success Story

Twitter and Facebook Status Generator
Finding engaging social media content for your business can be difficult. Use our tool to quickly find ideas and post directly to your page.
Give Me an Idea
What to read next