- What is the average engagement rate on Twitter? The average engagement rate on Twitter is 0.5%–1%, though viral content can achieve rates of 3%–5% or higher, with the average reply rate at 0.02%–0.05% and retweet rate at 0.5%–1%.
- How much do Twitter ads typically cost per click? The average cost per click (CPC) for Twitter ads ranges from $0.50–$2, though competitive topics or events can spike costs to $3–$5, with an average cost per follow of $2–$4.
- What is a good click-through rate for Twitter posts? The average CTR on Twitter is 1%–2%, with promoted tweets performing better at 1%–3% compared to organic posts at 0.5%–1.5%, meaning paid content drives more clicks than unpaid.
- How many hashtags should you use per tweet? The optimal number of hashtags per tweet is 1–2 — using more than three hashtags actually decreases engagement, with trending hashtags achieving 2%–5% engagement versus 0.1%–0.5% for branded hashtags.
- What conversion rate should you expect from Twitter ads? Twitter ads achieve an average conversion rate of 1%–3%, which is comparable to the platform’s CTR and higher than typical website conversion rates of 0.5%–2%.
Key Twitter marketing benchmarks to know
- Organic impressions: 50,000–200,000 per month
- Engagement rate: 0.5%–1%
- Click-through rate (CTR): 1%–2%
- Ad conversion rate: 1%–3%
- Cost per click (CPC): $0.50–$2
X — or, as many people still call it, Twitter — is one of the biggest social media platforms out there. So if your business is building out a social media marketing strategy, it might be one of the first sites you consider promoting yourself on.
If you’re in the process of marketing on Twitter, it’s important to keep track of key metrics that reveal how well your campaigns are performing. But those metrics don’t tell you much if you don’t know where they’re supposed to be. You know your conversion rate is 4%, but is that high? Low? Average? Maybe you’re not sure.
In that case, what you need is some X marketing benchmarks. Benchmarks represent average metrics across all Twitter marketers, giving you a standard by which to judge your own metrics. And on this page, we’ll be looking at some of the most significant Twitter benchmarks to know.
Twitter marketing benchmarks for 2026
Having access to benchmark metrics can go a long way toward helping you get your own metrics to where they need to be. That’s why we’ll be exploring some of the most significant Twitter marketing benchmarks, below, including:
- Impressions
- Engagement rate
- Click-through rate (CTR)
- Ad conversion rate
- Cost per click (CPC)
- Follower growth
- Hashtag performance
Here’s an overview of how those benchmarks stack up:
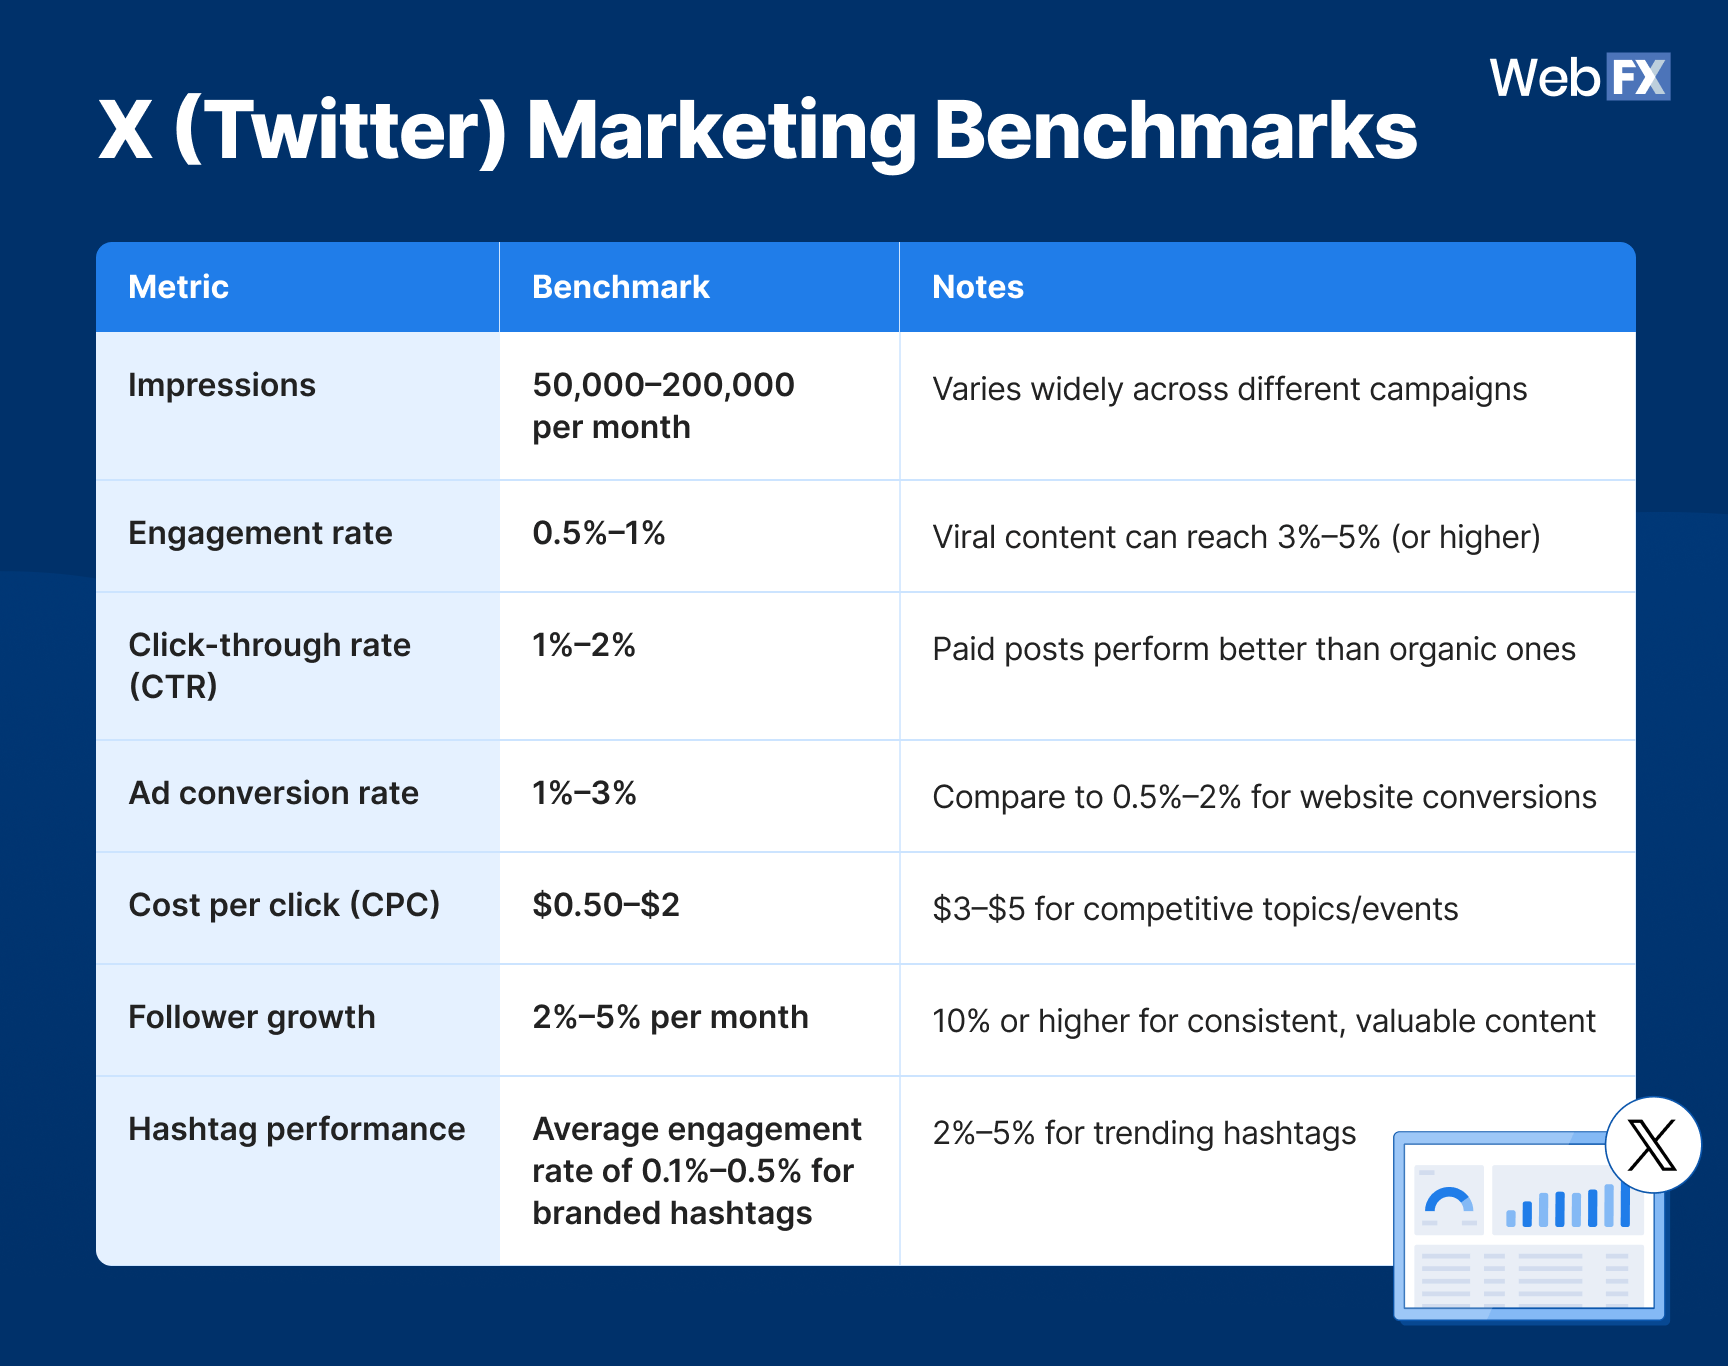
Table view
| Metric | Benchmark | Notes |
| Impressions | 50,000–200,000 per month | Varies widely across different campaigns |
| Engagement rate | 0.5%–1% | Viral content can reach 3%–5% (or higher) |
| Click-through rate (CTR) | 1%–2% | Paid posts perform better than organic ones |
| Ad conversion rate | 1%–3% | Compare to 0.5%–2% for website conversions |
| Cost per click (CPC) | $0.50–$2 | $3–$5 for competitive topics/events |
| Follower growth | 2%–5% per month | 10% or higher for consistent, valuable content |
| Hashtag performance | Average engagement rate of 0.1%–0.5% for branded hashtags | 2%–5% for trending hashtags |
Read on for a more detailed breakdown!
Impressions
What impressions measure
Impressions refer to the number of people who have viewed a particular post or ad from your company’s X account, regardless of how many of those people actually interacted with it.
Why impressions matter
Impressions show you how wide your reach is on Twitter. A low number of impressions means your business isn’t getting in front of many people, while a high number of impressions indicates a large audience. Impressions are also important for measuring engagement, clicks, and conversions, as we’ll see later.
Impression Twitter benchmarks
The average number of impressions varies widely across different marketing campaigns. However, among active accounts, the average is 50,000–200,000 organic impressions per month.
How to boost your impressions
To get more eyes on your tweets, try out the following tips:
- Incorporate images and videos into your posts to get a bigger algorithm boost.
- Consider tagging other accounts to get your posts in front of their followers, too.
- Schedule posts during days and times when your audience is the most active.
Engagement rate
What engagement rate measures
Your engagement rate measures the percentage of impressions that result in some kind of interaction, be it a like, retweet, or comment.
Why engagement rate matters
Engagement rate goes beyond simply measuring how many people see your posts. It lets you see how many of those people actually engage with your posts. That gives you an idea of how compelling your posts are. A low engagement rate means a lot of people are seeing your posts, but most of them don’t find those posts interesting enough to interact with.
Engagement rate Twitter benchmarks
The average engagement rate on Twitter is 0.5%–1%. Having said that, viral content can reach an engagement rate of 3%–5% (or higher).
To give you some more specific engagement benchmarks, the average reply rate is 0.02%–0.05% for promoted tweets, while the average retweet rate — that is, the average percentage of impressions that result in a retweet — is 0.5%–1%.
How to boost your engagement rate
Here are some ways to improve your engagement rate:
- Use your Twitter page to run polls that encourage users to engage in a quick, easy way.
- Reply to comments on your tweets to create back-and-forth conversations.
- Make your posts funny and entertaining to encourage retweets.
Click-through rate (CTR)
What CTR measures
CTR refers to the percentage of impressions that result in someone clicking on a link. Naturally, this metric only applies to posts that link to another page, be it a blog post or a landing page.
Why CTR matters
Some of your posts may be intended to lead users to another page, typically on your website. For those posts, the main goal is to get them to click the link, so it’s important to track how many of them actually do so. That’s particularly true of promoted tweets, where the amount you pay is based on clicks.
CTR Twitter benchmarks
The average CTR on X is 1%–2%. But there’s a discrepancy between paid and organic posts — promoted tweets have an average CTR of 1%–3%, while organic ones average 0.5%–1.5%. That means organic posts don’t perform as well as paid ones when it comes to clicks.
How to boost your CTR
Wondering how to increase your CTR? Try these suggestions:
- Feature a clear call to action (CTA) in your tweets, encouraging users to take a specific action like clicking a link or downloading a guide.
- Offer users something enticing, like a helpful piece of content or a special sale, that they can only access by clicking.
- Include strong visuals in your posts to make them more clickable.
Ad conversion rate
What ad conversion rate measures
Ad conversion rate is the percentage of ad clicks that result in a conversion. The conversion in question could be anything from an email signup to a product purchase, depending on what the goal of the ad is.
Why ad conversion rate matters
Conversions are the end goal of advertising. They’re whatever you want your target audience to do in response to your ads. So, it goes without saying that you should be tracking them. If you have a low conversion rate, that means a lot of people are clicking, but not many are converting, which likely indicates a problem with your landing pages.
Ad conversion rate Twitter benchmarks
On Twitter, the average ad conversion rate is 1%–3% — the same as the average CTR. That number might seem low, but for comparison, website conversions typically average 0.5%–2%.
How to boost your ad conversion rate
There are a few different ways to improve your ad conversion rate, including the following:
- Keep the conversion process as quick and simple as possible to encourage people to complete it.
- Hone your ad targeting to ensure you’re reaching the most responsive audience.
- Make sure your ad copy accurately reflects what users will see on the landing page.
Cost per click (CPC)
What CPC measures
Typically, you pay for ads on X based on the number of clicks those ads get. CPC measures the amount you pay for each click, on average.
Why CPC matters
It’s important to measure CPC so you know if you’re overpaying for your ad campaigns. A really high CPC means you’re paying a lot of money for only a small number of clicks, which isn’t ideal if you can avoid it.
CPC Twitter benchmarks
The average CPC of ads on Twitter is $0.50–$2. That said, ads that relate to competitive topics or events can spike to $3–$5.
A bonus benchmark related to CPC is that the average cost per follow is $2–$4.
How to boost your CPC
Not sure how to get your CPC where you want it? Try these steps:
- Run ongoing A/B tests to find the ad copy and landing page combos that drive the lowest CPC.
- Optimize your ad’s copy and visuals to boost your relevance score.
- Use negative keywords to prevent your ads from appearing to irrelevant users.
Follower growth
What follower growth measures
Follower growth measures the rate at which your X account gains followers. A high follower growth rate means your Twitter presence is expanding rapidly.
Why follower growth matters
Measuring follower growth is useful for seeing how compelling and popular your tweets are. If your follower count is growing at a fast rate, it could indicate that your posts are going viral, or simply that most of the users seeing them really like what you’re putting out.
Follower growth Twitter benchmarks
The average follower growth rate for business accounts on X is 2%–5% per month. Consistent, valuable content can achieve a monthly rate of 10% or higher, though.
How to boost your follower growth
Here are some of the most effective ways to boost your follower growth:
- Make sure you’re posting valuable content on a consistent schedule.
- Promote your X account in your profile on other sites, including your own website.
- Optimize your Twitter bio and header image to clearly communicate the value you offer.
Hashtag performance
What hashtag performance measures
One way to give your posts an extra boost on X is to add hashtags to them. You can measure hashtag performance to see how those hashtags impact your engagement.
Why hashtag performance matters
Using hashtags could either help or hurt your posts, depending on which and how many hashtags you use. Measuring the performance of those hashtags helps you determine the optimal strategy for using them.
Hashtag performance Twitter benchmarks
Branded hashtags on Twitter have an average engagement rate of 0.1%–0.5%. For trending hashtags, that engagement rate jumps to 2%–5%. The optimal amount of hashtags to use in a tweet is 1–2 — more than three hashtags actually decreases engagement.
How to boost your hashtag performance
Follow these tips to give a boost to your hashtag performance:
- Only use 1–2 hashtags per tweet for optimal engagement.
- Use relevant hashtags to tap into trending industry conversations.
- Alternate between broad, popular hashtags and niche, industry-specific ones to reach both a wide and targeted audience.
Twitter marketing benchmark FAQs
Here are the answers to some common questions about X marketing benchmarks:
What are Twitter marketing benchmarks?
Twitter marketing benchmarks are key performance metrics that represent the standard across all marketers on X. You can compare your own metrics to these benchmarks to see how well your campaigns are performing.
What are the most important X benchmarks to know?
Some of the most essential Twitter benchmarks to keep up with include:
- Cost per click (CPC)
- Click-through rate (CTR)
- Ad conversion rate
- Engagement rate
Each of these metrics helps you see how your X marketing is performing and identify any areas in need of improvement.
What qualifies as good marketing performance on Twitter?
There are many different ways to define “good” marketing performance. However, if we define it as “above average,” a good Twitter marketing strategy should result in:
- Over 200,000 organic impressions per month
- An average engagement rate of more than 1%
- An average CTR of over 2%
- An average ad conversion rate of more than 3%
- An average CPC of under $0.50
Upgrade your X marketing strategy with the experts at WebFX
Evaluating your marketing metrics against the Twitter marketing benchmarks on this page is only step one. Step two is optimizing those metrics to get them where they need to be. That takes a thorough knowledge of marketing on X, knowledge you might not feel you have.
If that’s the case, your best bet is to partner with a Twitter marketing agency like WebFX. We’ve been helping businesses promote themselves on social media for decades, and our team knows exactly which tactics are best for boosting your company’s Twitter presence. Best of all, we’ll implement those tactics for you.
Interested in partnering with us for our X marketing services? Just give us a call at 888-601-5359 or contact us online today!
Methodology
This report combines proprietary industry benchmarks (taken from in-house performance data) with select third-party competitive intelligence. The result is an up-to-date look at the latest Twitter marketing benchmarks across all industries.
-
 Matthew Gibbons is a Senior Data & Tech Writer at WebFX, where he strives to help businesses understand niche and complex marketing topics related to SEO, martech, and more. With a B.A. in Professional and Public Writing from Auburn University, he’s written over 1,000 marketing guides and video scripts since joining the company in 2020. In addition to the WebFX blog, you can find his work on SEO.com, Nutshell, TeamAI, and the WebFX YouTube channel. When he’s not pumping out fresh blog posts and articles, he’s usually fueling his Tolkien obsession or working on his latest creative project.
 -

WebFX is a full-service marketing agency with 1,100+ client reviews and a 4.9-star rating on Clutch! Find out how our expert team and revenue-accelerating tech can drive results for you! Learn more
Twitter and Facebook Status Generator
Finding engaging social media content for your business can be difficult. Use our tool to quickly find ideas and post directly to your page.
Give Me an Idea
Share this article

Social Media Success Story

Twitter and Facebook Status Generator
Finding engaging social media content for your business can be difficult. Use our tool to quickly find ideas and post directly to your page.
Give Me an Idea