What is an Infographic? Infographic Definition + 5 Examples
What is an infographic?
Infographics are educational graphics that display complex information in an informative and entertaining way. They are purely visual and are typically used to showcase facts and data.
Infographics present their complex information quickly and clearly. It’s an effective way for you to provide your audience with valuable information in a way that is engaging, interesting, and easy to comprehend.
Below you’ll see an environmentally-conscious infographic example designed by our team here at WebFX.
On the rest of this page, we’ll discuss infographics and why you should invest in infographic design. We’ll also cover how to get started with creating your own infographics.
If you need help creating infographics that drive results, call us today at 888-601-5359 to speak with a strategist.
Let’s get started!
Digital vs. Traditional Marketing
Download this guide to understand the key advantages, costs, and opportunities for each to decide which is best for your marketing strategy!
Get My Free Guide
Types of infographics
Now that you understand the infographic definition, let’s talk about types of infographics.
When you create an infographic, you can choose from a range of types, including:
- Comparison
- List
- Process
- Timeline
- Informational
- Statistical
- Hierarchical
- And more
The infographic you pick will depend on your content or what you want to share with readers. If you’re comparing two things, like apples and oranges, you would probably use a comparison infographic because of its layout.
Infographic design vs. data visualization: How are they different?
As you learn more about how to make an infographic, you’ll come across information about data visualization. Some people may even use the terms interchangeably. It’s important to note, however, that these two visual data items are different.
Infographics
- Visual representation of facts, events or numbers
- Reflects a pattern and aligns to a story
- Tells a premeditated story with a set conclusion
- Subjective – guides the audience to a particular conclusion
- Used for marketing content, blog posts, case studies
Data visualization
- Visual representation of data
- Information is placed in a schematic form to see what the data means
- Presents data naturally with no agenda
- Objective – users draw their own conclusions from the data set
- Used for reports and editorials
So, what does this all mean?
To put it simply, data visualizations present the data raw and allow the user to draw their own conclusions about the data. Infographics focus on hand-selected information that helps tell a story or guides a user to feel a particular way about a topic.
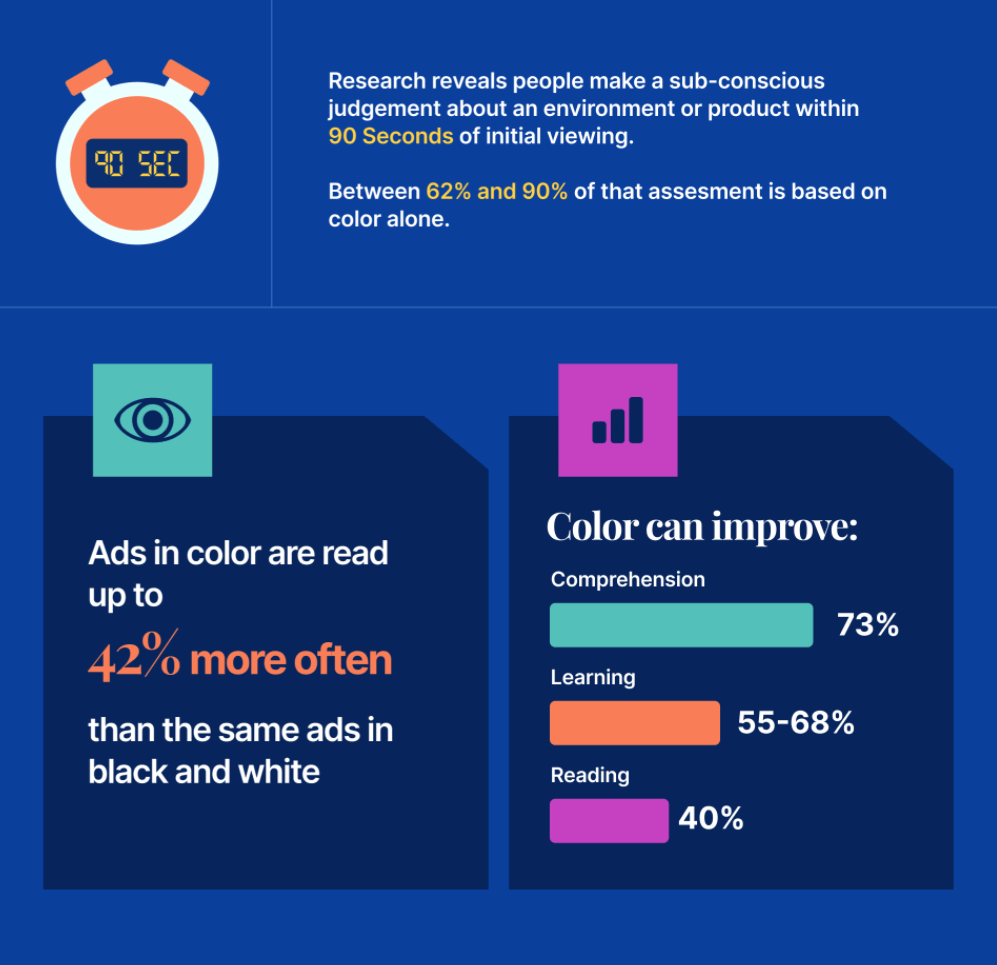
In the below infographic example, we told the story of how color and psychology work together to impact people’s consumer habits.
Data visualizations can be included in infographics, but infographics can’t be included in data visualizations.
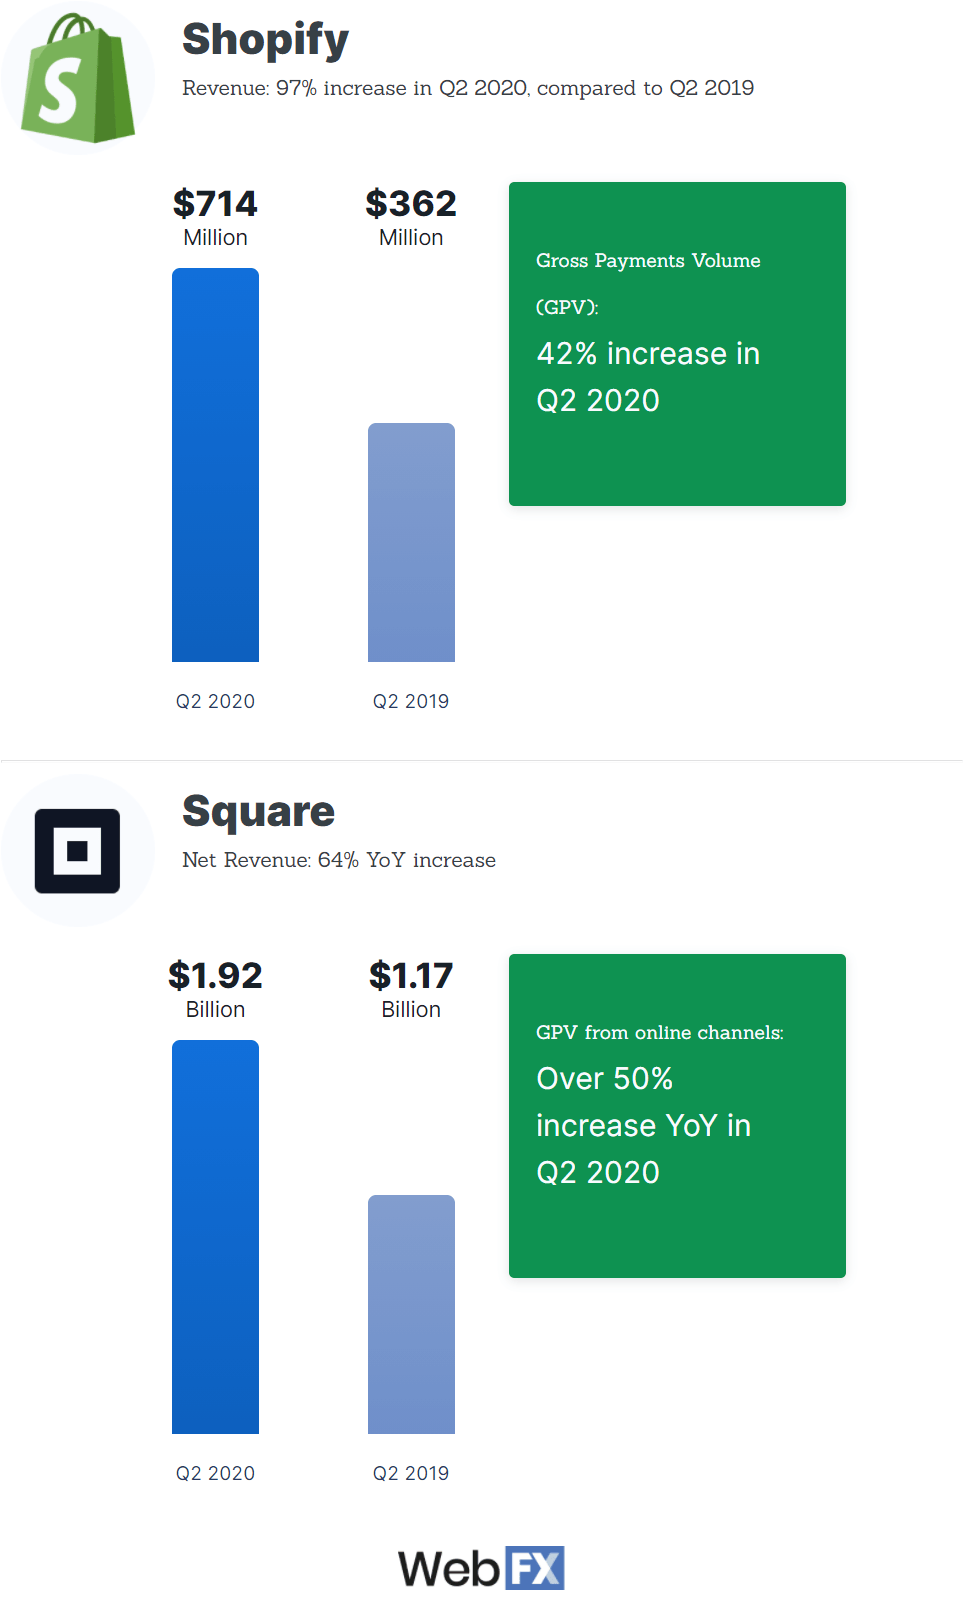
Below, you’ll see an infographic example that includes a data visualization used to supplement the story of how companies can survive with ecommerce.
Check out the full blog post on ecommerce growth to see how we used data, animation, and design to tell a cohesive story.
For example, let’s say your shareholders want to see your company’s growth over the past year. To make it easy to understand, you create a chart that shows your growth over 12 months. You include the recorded sales figures for each month and order them by month.
This is an easy way for you to present information to your shareholders. They can see the hard figures and conclude for themselves if your company has grown or if the growth meets their expectations.
Now let’s say you want to use that same data to prove to your clients that you’re driving success. You decide to make an infographic to make it visually appealing.
Instead of including all the data in your infographic, you only focus on data that shows your growth. You may choose a month where you had particular high sales or made the biggest profit. These figures are highlighted in your infographic to tell the story of your company’s success.
By including these figures in your infographic, you’re guiding your audience towards the conclusion that your business is successful and a good choice for them.
Infographics guide your audience towards a particular conclusion, while data visualization presents all the information and allows your audience to come to their own conclusions. This is the biggest difference between these two visual elements.
Infographic examples to inspire your designs
Want to see a few more infographic examples? We’ve been making infographics for clients for many years. Check out two more of our favorite infographics:
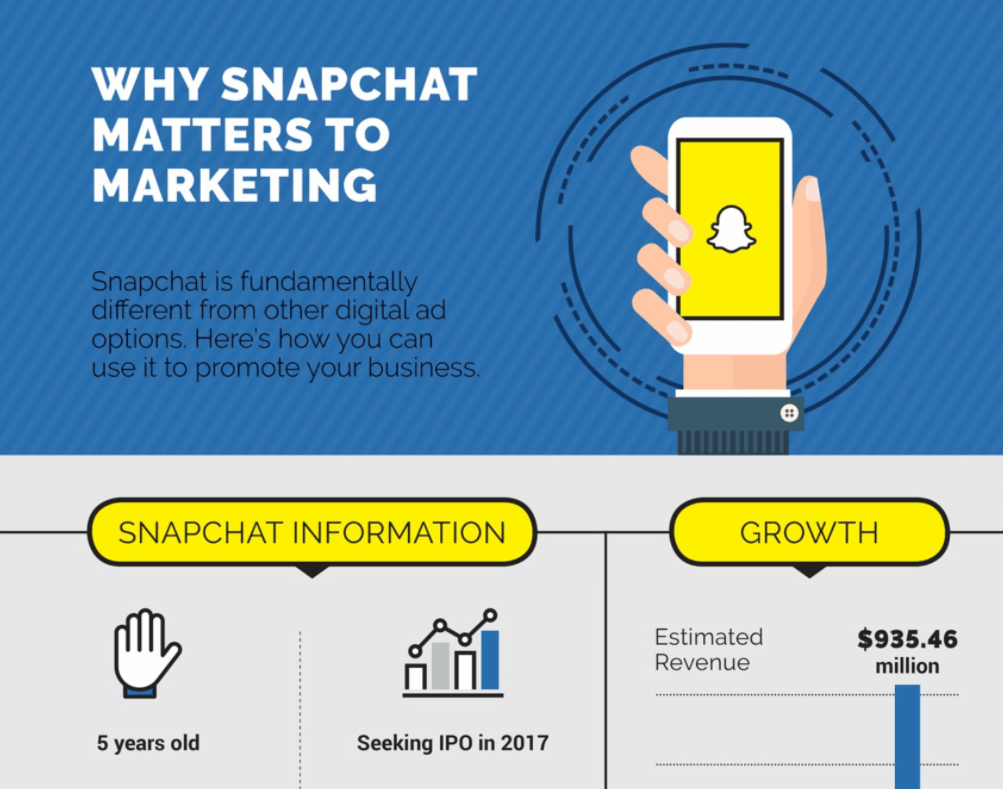
Why Snapchat Matters to Marketing
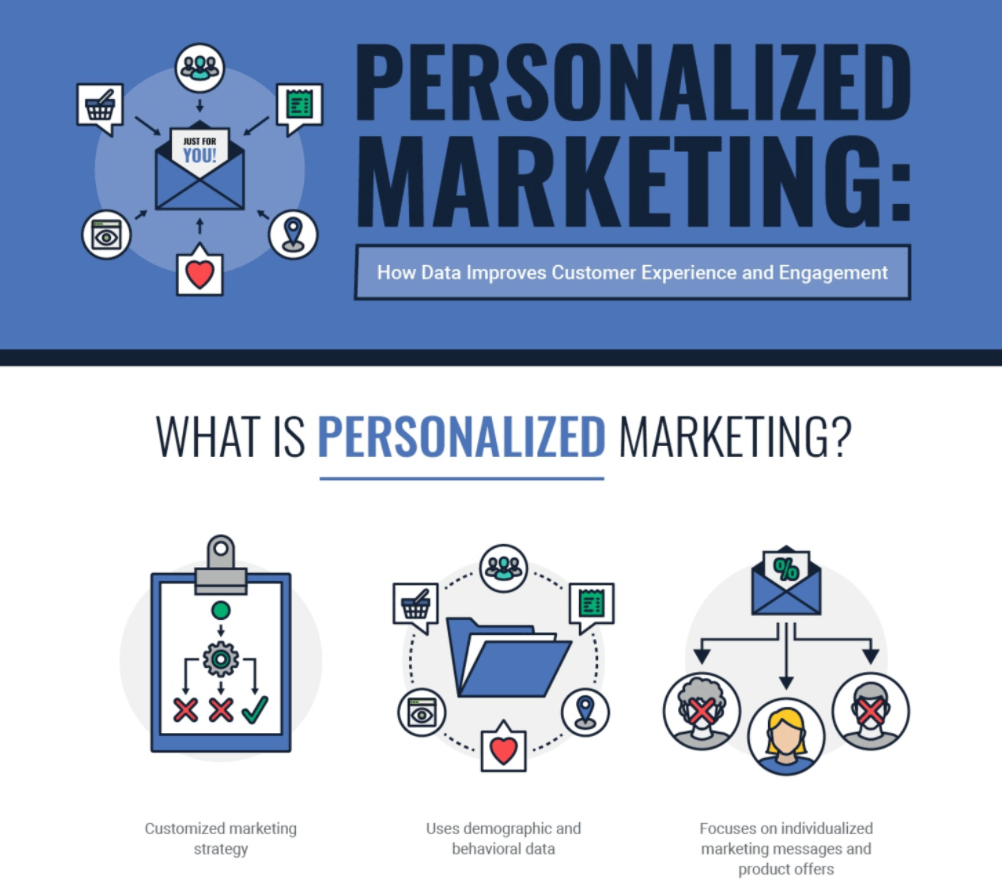
Personalized Marketing
Powering the Internet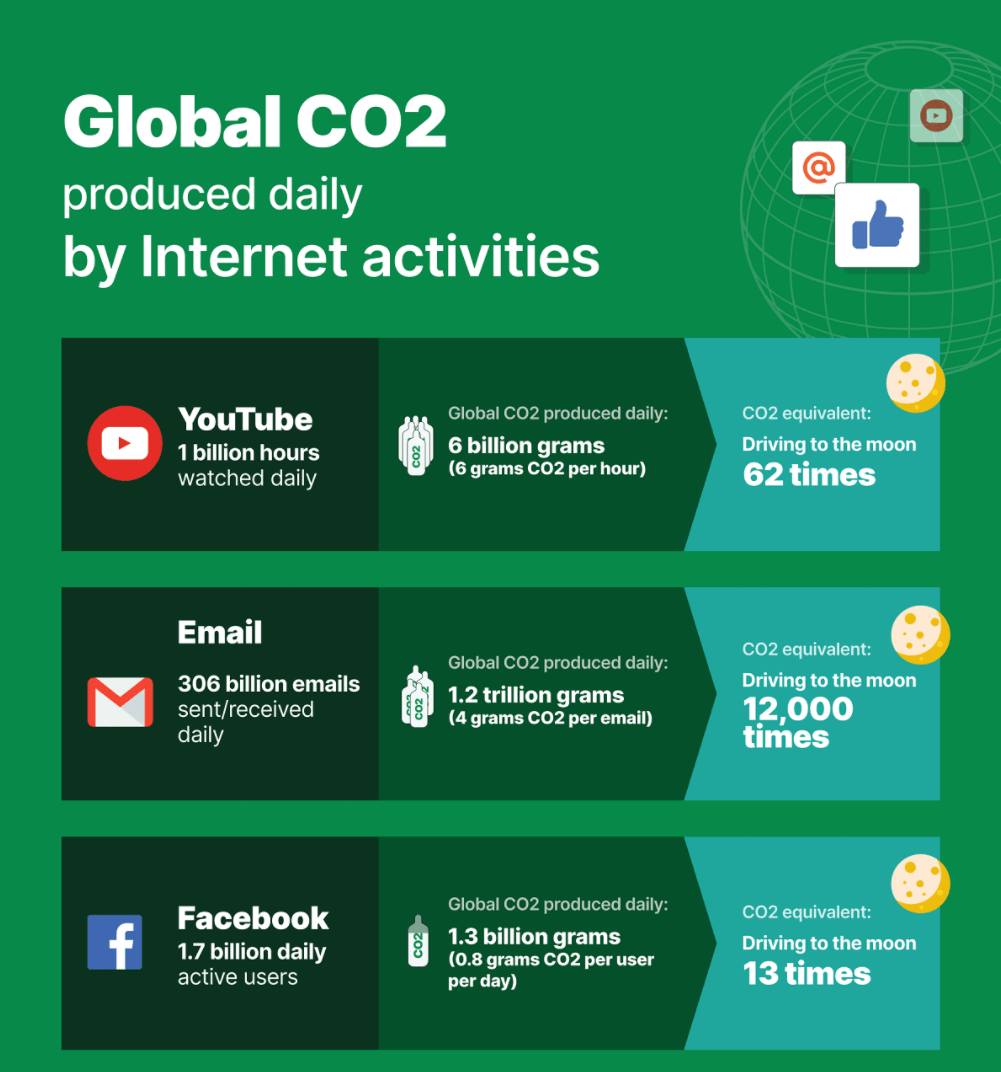
Sometimes a basic infographic isn’t enough. At WebFX, we go the extra mile and offer motion graphics. These are animated video infographics that are more engaging than your typical infographic. Video infographics typically present data with moving graphics, a soundtrack, or sound effects.
If you want to see additional examples of infographics and motion graphics or want to learn more about our infographic design services, visit our custom infographic design page for pricing and additional details on our process.
How to create an infographic of your own
After asking the question “what is infographic design?” the next question that follows is “how do I design my own infographics?” Let’s take a look at the steps you can follow to start infographic design.
1. Decide who is making your infographic
First and foremost, you must decide who is making your infographic. It takes time and effort to create an infographic that drives results. You must ensure that you’re equipped with the right tools to make a successful one.
If you want to make your infographic in-house, you must use the right software. This is even more important if you don’t have experience making infographics. You want to use a program that makes it easy.
There are a wide variety of tools you can use. Here are some of the most user-friendly infographic tools:
- Canva: Canva has a free, built-in infographics section that allows you to design infographics from a template. You can input your information and brand style into these infographics to make it unique to your business.
- Piktochart: Piktochart is a great infographic builder that has over 100 free themes and more than 1000 images. You can easily build a custom infographic to display your information.
- Infogram: This infographic design builder offers 30 free themes and allows for interactive embeddable infographics.
These are all great programs that help you build professional infographics.
However, if you don’t have the time or resources to create infographics, you can always rely on a design company to create them for you.
2. Look at existing infographics
Next, you’ll want to look at existing infographics to get an idea for how you want your infographic to look. You may not have an idea for your infographic right off the bat, so looking at other infographics helps give you inspiration.
You can find infographics on sites like Cool Infographics and Daily Infographics.
Additionally, you’ll want to consider using your company’s brand kit for your infographic so that it matches the look and feel of your brand. This will help create brand awareness.
3. Come up with your infographic topic
When you create an infographic, you must center it around a topic. It’s important that you focus on a specific topic and don’t get too generic with it.
For example, let’s say you’re a florist. You decide you want to make an infographic about flower arrangements. If you simply focused on flower arrangements without any direction, it wouldn’t be helpful for your audience.
To make a quality infographic, you could focus on flower choices and arrangements for rustic weddings. This is specific and focused, but it’s helpful for people who are having a rustic-themed wedding.
This would make a great infographic because it’s focused and helpful. You could create multiple infographics for different wedding themes. Whether it’s a classic wedding theme or an exotic theme, you can create infographics that help people figure out the right flowers for their wedding.
If you aren’t sure where to start with a topic, you can look at examples of infographics. The infographic websites listed above have dozens of examples of infographic topics. While you don’t want to steal an idea directly, you can use those infographics to inspire other, similar ideas.
You’ll also want to determine if your topic is time sensitive. It’s much easier to promote non-time sensitive infographics because they can be used no matter the timing.
For instance, let’s say you wanted to create an infographic about an upcoming presidential election. You may think about creating an infographic that focuses on the candidates and their stances on different topics.
While this is a helpful infographic, it’s time-sensitive. Once the election is over, the information won’t be relevant anymore.
On the other hand, a topic like the electoral college is less time-sensitive. This is a topic that people are constantly asking questions about and want to know more. It becomes even more relevant when a presidential election happens.
As you research different topics, think about whether they are time sensitive. You want to choose topics that are evergreen. It will help you have a more effective infographic that reaches more people.
4. Figure out what your audience will learn
After you decide on the topic, you’ll want to focus on the information that supports your topic. Ultimately, you want to decide what your audience will learn from your infographic. It’s important that they gain value from your infographic, so you must ensure the information you include helps your audience learn.
You should always have an objective on your infographic. There should be a goal in mind that your audience will learn about a topic. You need to do more than just create a great looking infographic.
Ensure that you do thorough research and obtain data that’s worth learning. Your audience should walk away from your infographic feeling informed and educated on your selected topic.
Digital vs. Traditional Marketing
Download this guide to understand the key advantages, costs, and opportunities for each to decide which is best for your marketing strategy!
Get My Free Guide
Why are infographics so popular?
As you look more into how to make an infographic, you may wonder why they are so popular.
Infographics are visually appealing
Infographics are popular because they are appealing to your audience. In fact, content with visuals gets 94 percent more views than text-only content.
Infographics make it easier to process information
These graphics make it easier to process information, too. Humans can process visual content faster than written content. It’s easier to understand because infographics are broken down into the most important statistical facts.
Infographics tell a story
Infographics allow your business to educate your audience with important facts and figures, while creating a visual story that keeps them engaged better than written content.
People are drawn to visuals
If given the choice to choose a page of text or an infographic that provides the same information, people will choose the visual since it is a more appealing way to digest information.
Infographics are easy to share and have potential to go viral
If people like the infographic and find it informative, they can easily share it on social media. This allows others to view it, like it, comment on it, and share it.
A well-designed infographic can go a long way in terms of shares and exposure for your business.
Why infographics matter to business
Infographics are extremely beneficial to your business. It’s a great way to pass on important information to your audience. Here are five ways that infographics benefits your business.
Infographics simplify communication and clarifies messages
It’s sometimes difficult to get your message across with written content. Users may see a wall of text and become overwhelmed, and bounce from the page. They aren’t enticed to read your information or don’t have time to read an entire page of text.
If your text is confusing, too technical, or very in-depth, your audience may struggle to find the point of the information. They want quick answers and want to know what you’re trying to prove.
Infographics bring clarity. They make it easy for your audience to understand your point and directs them straight to the point. You break down your information and statistics to make it easy for your audience to come to a conclusion.
When information is easier to digest, your audience is more likely to engage. They’ll read your infographic and absorb the most important information.
By designing infographics that are engaging and interesting, you’ll simplify the communication process and make the information clear to your audience.
Infographics engage your audience
Infographics are a fresh breath of air on a text-heavy page.
This visual tool helps get your audience interested in your information. If they don’t have time to read the entirety of your content, they will skim. An infographic gets them to stop scrolling through the page and engage.
Not to mention, infographics are great at preventing information overload. They help your audience process the information better and helps them to continue to engage on your page.
Infographics paint you as an expert
Infographics are a great way for you to showcase your knowledge. It takes time to research information and provide your audience with statistics about your field.
By presenting this statistical information to your audience, you show that you are knowledgeable in your field. You know how to take relevant data and present it in a manner that makes sense to your audience.
Infographics allow you to display your knowledge and build trust with your audience. They feel confident in choosing your business because you know your facts.
Infographics drive results
Infographics are valuable tools for driving results. Since infographics are engaging and shareable, it’s easy to get your audience to pass them along to new and interested leads.
These graphics are great for increasing brand awareness. When someone sees your infographic, they get a sense of your brand. Your infographics are typically reflective of your company’s brand and style. It helps new people get familiar with your brand.
When you create infographics, you have a higher reach to your target audience. Your information appeals to people who are looking for it. If they’re interested in your industry-specific information, they’re more likely to be interested in your business.
This helps you connect with people interested in your business. It’s a great way to help you find new leads for your business.
In addition, you increase comprehension of your message. People understand your message better, which leads them to engage with your content more. This leads to more people exploring your website and learning about your products and services.
Create an infographic (or four) with WebFX
Infographics are a great addition to your content marketing strategy. You can use these graphics to help you present information in a way that is easier for your audience to understand. At WebFX, we have years of experience creating infographics that drive results.
We’re a full-service digital marketing company that specializes in creating custom infographics. We have a team of over 500 experts that will bring their knowledge and expertise to your campaign. We’ll help you create infographics that engage and interest your audience.
If you’re looking for a company that drives results, look no further than WebFX. In the past five years, we’ve driven over $6 billion in sales and over 24 million leads for our clients. We know how to create campaigns that help our clients grow their business.
Don’t believe us? Just ask our clients! Check out our 1,100+ client testimonials that attest to the awesome work we do!
Time to Level Up Your Sales
Our long list of services helps you grow every aspect of your business with marketing strategies that are proven to increase bottom-line metrics like revenue and conversions.
In the past 5 years, we’ve managed more than 14.9 MILLION transactions across our client base.
Get started today!
If you’re ready to start creating impactful infographics, contact us online or call us today at 888-601-5359 to speak with a strategist.
We look forward to helping your business reach new heights!
Table of Contents
- What is an Infographic?
- Types of Infographics
- Infographic Design vs. Data Visualization: How Are They Different?
- Infographic Examples to Inspire Your Designs
- How to Create an Infographic of Your Own
- Why Are Infographics So Popular?
- Why Infographics Matter to Business
- Create an Infographic (or Four) with WebFX
- Get Started Today!
Related Resources
- What is “Good, Unique Content”?
- What is a Content Gap? (& How to Do a Content Gap Analysis in 3 Steps)
- What is a Content Management System (CMS) and How to Choose the Best for Your Needs?
- What is a Content Marketing Agency? (And Everything else You Need to Know)
- What is Content Marketing and How Does It Work?
- What is Duplicate Content and Will It Hurt Your SEO?
- What is Evergreen Content?
- What is Gated Content? [All-Encompassing Guide to Gated Content]
- What is Long-Form Content? (And How to Master Long-Form Writing)
- Content Marketing Glossary
Marketing Tips for Niche Industries
- Tourism/hospitality Statistics
- Treat More Patients with Healthcare Marketing Services
- Urgent Care Marketing Ideas: 5 High-ROI Tactics
- WebFX: Your Education Digital Marketing Agency
- Why Auto Part Retailers Need Digital Marketing
- Why Digital Marketing is Essential for Auctioneers
- Your Guide to Digital Marketing for Exercise Equipment Companies
- Vision Care Industry Statistics
- 10 Best Orthodontist Marketing Ideas to Earn More Patients
- 10 Digital Marketing Strategies for the Heavy Equipment Industry


