

Over-the-top (OTT) platforms have become one of the most popular ways to watch your favorite TV shows and movies. If you’re wondering whether investing in OTT ads could help you sell more products or gain new clients, you’ve come to the right place.
We’ve compiled the ultimate list of the top OTT statistics for 2026 to show how powerful this advertising strategy is for your business.
On this page, we’ll explore:
So, keep reading to find out!
And don’t forget to sign up for our newsletter, Revenue Weekly, for even more OTT and digital advertising tips from our award-winning experts.
Watch: CTV and OTT Basics Explained
OTT statistics: OTT market trends
Do you want the inside scoop on the latest OTT market trends? Check out these noteworthy OTT statistics of 2026:
- $316.4 billion is the OTT video market’s project revenue in 2024.
- $429.4 billion is the OTT video market’s projected revenue by 2029.
- $127 billion is the expected revenue of the global streaming video on demand (SVOD) market in 2029.
- The global SVOD market’s revenue grew to $107 billion in 2023.
- Tencent Video has about $42 million in revenue in July 2024.
- The number of active OTT users is expected to reach 4.9 billion by 2029.
- The number of OTT video users in Canada is expected to reach over 26 million in 2025.
- User penetration of OTT video is expected to hit 61% in 2029.
OTT statistics: Platforms
Which OTT platforms are the most popular in the U.S.? Let’s go through the OTT statistics for 2026 broken down by platform below:
Netflix
Netflix is one of the most popular OTT platforms in the world. View these noteworthy Netflix statistics to learn more about this platform’s power in the OTT market:
- Netflix had over 75 million subscribers in the U.S. and Canada in the second quarter of 2023.
- 282.7 million is the number of Netflix’s paid subscribers worldwide, as of the third quarter of 2024.
- Netflix had 14 million app downloads worldwide in July 2024.
- One in three U.S. Netflix users say they won’t drop the service.
- 47% of Americans prefer Netflix over any other streaming platform.
- 45% of Netflix’s worldwide revenue comes from the U.S.
- $33.7 billion was Netflix’s total revenue in 2023.
- Netflix spent about $17 billion on content in 2022.
- About $9.8 billion was Netflix’s total revenue in the third quarter of 2024.
- $5.41 billion was Netflix’s net income in 2023.
Amazon Prime Video
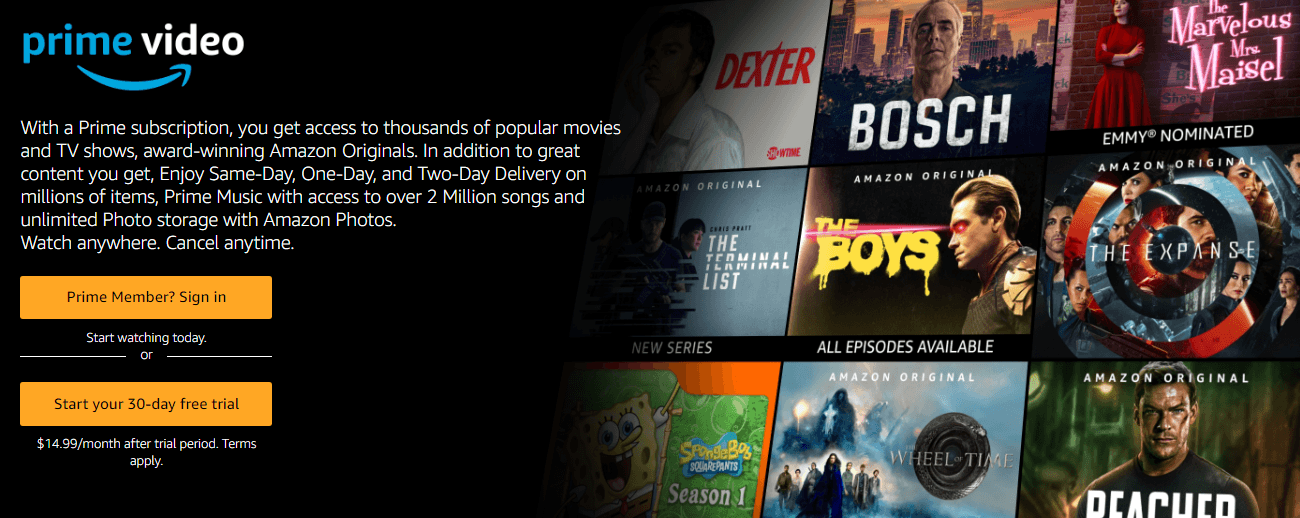
No list of the top OTT statistics for 2026 would be complete without exploring the OTT streaming giant, Amazon Prime Video.
Amazon Prime Video is the second largest OTT streaming platform. Learn more about it by checking out these powerful Amazon Prime Video statistics:
- 205 million is the number of active subscribers worldwide on Amazon Prime Video.
- 22% was the market share of Amazon Prime Video in the U.S. in the third quarter of 2024.
- Movies are the most common content type on Amazon Prime Video.
YouTube
YouTube provides endless hours of free and paid video content for users. See how popular this streaming provider is by viewing these amazing YouTube statistics:
- More than $31.5 million was YouTube’s global revenue in 2023.
- YouTube had over 2.5 billion global viewers in 2024.
- 240 million is the number of active users in the U.S. on YouTube.
- YouTube Music and YouTube premium subscribers reached 100 million paying users in 2024.
- 56 minutes is the amount of time each day users under the age of 18 spend on YouTube.
- 49% of U.S. adults aged 65 and over use YouTube.
- 12% of total active users on YouTube are men between the ages of 25 and 34 years old.
- YouTube Premium’s ad business accounts for about 10% of the company’s revenue.
- 9% of total active YouTube users are female aged between 25 and 34 years old.
TikTok
TikTok is well known for its popular videos that provide endless hours of entertainment for users. It’s also one of the best OTT platforms to advertise your products or services.
Learn why with these impressive TikTok statistics:
- Over $53 billion is the expected advertising revenue of TikTok in 2027.
- 91 minutes is the amount of time each day users under the age of 18 spend on TikTok.
- 54% of worldwide TikTok users identify as male.
- 45% of worldwide TikTok users identify as female.
- 36% of TikTok users are between the ages of 35 and 54.
Hulu
Hulu offers ad-free subscriptions and lower-cost subscriptions with ads, which is why it’s one of the most popular OTT streaming platforms today.
Check out these noteworthy Hulu statistics below:
- 62% of people watch Hulu with ads.
- 54% of Hulu’s subscribers are Gen Z and Millennials.
- 48% of Hulu users are male.
- Hulu had 51.1 million paying subscribers in the third quarter of 2024.
- The number of Hulu’s paying subscribers reached about 50 million in December 2023.
- $1.6 million is the value of Hulu’s ad revenue.
- Hulu generated an average revenue per user (ARPU) of over $93 in the first fiscal quarter of 2024.
HBO Max
HBO Max offers a wide range of TV shows and movies for users to stream on their TV, mobile phone, and more.
Learn more about this power-house OTT platform by checking out these noteworthy HBO Max statistics:
- HBO subscription revenue reached $4 billion in 2022.
- HBO Max had about $60 million in revenue in July 2024.
- 48.6 million is the number of active HBO Max subscribers in the U.S.
- 12.4 million is the number of HBO Max app downloads worldwide in 2024.
Disney+
Disney+ is a relatively new streaming platform in the OTT market and it’s growing rapidly. View our favorite noteworthy Disney+ statistics below:
- 153.8 million is the number of Disney+ subscribers worldwide in the third quarter of 2024.
- 31 is the number of hours U.S. adults watch Disney+ a week.
- 50% of U.S. households with a Disney+ subscription don’t have children.
- Disney reported a loss of $2.5 billion for its streaming services in 2023.
- Disney had over $100 million in revenue worldwide in July 2024.
- Disney+ earned at least $1 million from consumer spending in more than 50 different markets in 2023.
- Disney+ Core reported an average monthly revenue of $7.22 per subscriber in the third quarter of 2024.
OTT statistics: User behavior
No list of OTT statistics for 2026 would be complete without analyzing user behavior across various streaming platforms.
See how users interact and use video streaming platforms and services with these handy stats:
- 83% of U.S. consumers used SVOD service in 2023.
- 36% of Baby Boomers say that they don’t watch any streaming services.
- 33% of Gen Zers say that they don’t watch live or cable TV.
- 99 minutes per day is how much time U.S. kids and teens spent on TikTok in 2021.
- 61 minutes per day is how much time U.S. kids and teens spent on YouTube in 2021.
- Consumers spent over $8 billion in OTT streaming apps in 2023.
OTT advertising statistics
More households are cutting the cord from cable and switching to OTT streaming platforms to watch their favorite TV shows and movies.
That means advertising on OTT platforms is one of the best ways to promote your products or services while your target audience watches video content.
Learn more about the benefits of OTT ads by checking out these mind-blowing OTT advertising statistics below:
- 207% is how much programmatic ad impressions increased on connected TVs in the U.S. in 2021.
- 65% of OTT viewers look up product information on a second screen while watching their video content.
- Ad spending in the OTT video advertising market is expected to show an annual growth rate of 5.83%, resulting in a projected market volume of $251.7 billion by 2029.
- Ad spending in the OTT video advertising market is projected to reach $189.6 billion in 2024.
- OTT video advertising’s ARPU is expected to reach $80.27 in 2024.
- $48.37 is the projected average ad spending per Internet user in the OTT video advertising market in 2024.
Inspired by these OTT advertising statistics?
There’s no denying that you can reach your target audience through OTT advertising. If you need help with implementing an effective OTT ad campaign, let WebFX help.
Our digital advertising experts have more than 30 years of experience crafting revenue-driving ad campaigns. In fact, in the past five years alone, we’ve driven more than $10 billion in revenue and 24 million leads for our clients.
Are you ready to improve your revenue with OTT advertising? Chat with one of our strategists today by calling 888-601-5359 or contacting us online to learn more about our OTT advertising services!
-
 Abby is a Digital Marketing Analyst at WebFX, where she implements, optimizes, and tracks SEO and digital marketing strategies that are powered by data for WebFX. With certifications in SEO, Local SEO, and Google Analytics, Abby has implemented hundreds of optimizations and led strategies and initiatives that have helped WebFX improve online visibility, traffic, and leads. Before her time as a Digital Marketing Analyst, Abby was an innovative content writer who created content for WebFX clients in various industries and for WebFX’s own blog and website. When she’s not implementing strategies and optimizations that drive leads and revenue, you’ll find her walking her dog, travelling around Europe, or watching her favorite reality TV show.
 -

WebFX is a full-service digital marketing agency delivering revenue-driving strategies across online advertising, SEO and AI search optimization, and digital marketing. Backed by 1,100+ client reviews, a 4.9-star rating on Clutch, and proprietary revenue-tracking technology, our team helps businesses grow visibility and revenue across platforms, from Google to ChatGPT to LinkedIn. Discover how our expert team and revenue-accelerating tech can drive results for you. Learn more
Cost Per Click (CPC) Calculator
Do you advertise on platforms that charge per click? Use our calculator and figure out exactly how many clicks will fit within your budget.
Calculate Your CPC
Share this article

Cost Per Click (CPC) Calculator
Do you advertise on platforms that charge per click? Use our calculator and figure out exactly how many clicks will fit within your budget.
Calculate Your CPC
What to read next