-
 7 min. read
-
 Trevin Shirey
 VP of Marketing
- Trevin serves as the VP of Marketing at WebFX. He has worked on over 450 marketing campaigns and has been building websites for over 25 years. His work has been featured by Search Engine Land, USA Today, Fast Company and Inc.
Wondering how to use Google Analytics? When you’re new to Google Analytics, it can seem like a jumble of bar graphs, line charts, and numbers. So, how do you — a newbie to Google Analytics — start?
If you want to leverage this powerful tool for your site, you need to make sense of what Google Analytics offers, how to customize it to your purposes, and what each section can do for you. Our Google Analytics tutorial can help you launch into this resource without as many frustrations and stress. Keep reading to learn how to use Google Analytics in five simple steps!
Do you need a team of experts to interpret Google Analytics intel? WebFX’s Google Analytics consulting services can turn your cryptic data into actionable steps. Contact us online at WebFX today or call us at 888-601-5359.
93% of WebFX customers are extremely satisfied with their digital marketing results.
“Working with WebFX, everything is very organized and strategic. We’re only a year into our partnership, and our expectations have definitely been met.”
View More Client Testimonials

What does Google Analytics track?
Before we explore the setup and specifics of Google Analytics, it’s helpful to know how Google Analytics works in the first place.
Google Analytics gathers data from sites that include a specific JavaScript tracking code. It tracks how your visitors get to your website and what they do when they get there. Through cookies, this SEO analysis tool receives information and converts it into readable formats like graphs.
The interactions with your site fall into three categories:
- Page hits: When your tracking code-embedded page loads
- Event hits: When users perform actions on your page, like clicking a button
- Ecommerce (transactional) hits: When users purchase products
- Social interaction hits: When users interact with your site’s social media widgets
You get to see essential measurements about users and performance as this data is sent to Google Analytics. Google Analytics even has a Real-Time feature that lets you watch the numbers fluctuate with current interactions. Now that you have a little background on the system’s tracking, how to use Google Analytics can come even easier.
1. Make an account and add a property
If you haven’t created a Google Analytics account yet, head over to the login page and enter your information. It’s free to make an account, but Google also offers a free demo version that you can test out. You might not think of your domain like real estate, but it is your plot of the Internet to build a strong presence.
That’s also what Google Analytics calls the site you own and want to track — a property. You’ll have to add a Google Analytics property after you sign in. It’s also possible to enter a mobile app as a Google Analytics property.
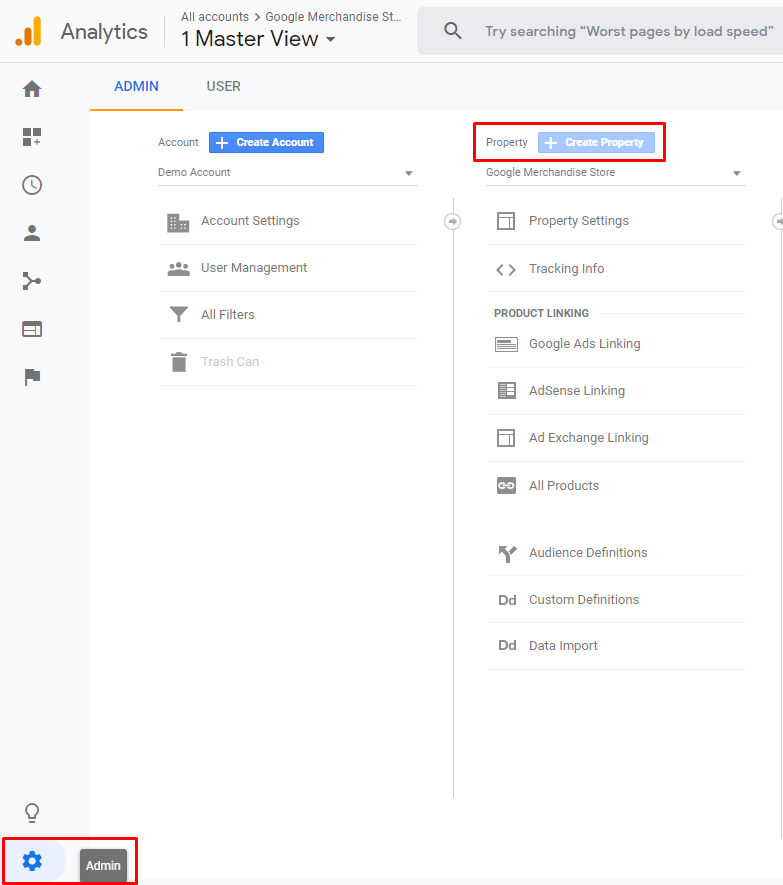
Technically, any online resource with your tracking code attached counts as a property. Under the Admin section, click “Create Property” to enter your URL. 
2. Put the tracking code on your site
Next up in this Google Analytics tutorial is placing the tracking code on your website. The tracking code acts as a slingshot of information, sending each significant interaction back to your Google Analytics account. When you added a property, Google Analytics generated an ID for you.
The ID identifies which Google Analytics account your site belongs to, and it’s included in the global site tag.
![]()
The global site tag is in a text box, located in the Admin section under Property > Tracking Info > Tracking Code. You’ll directly highlight the global site tag and paste it into the HTML, following the initial <head> tag. If you’re tracking all the pages across your site, you’ll have to repeat this for each page, so you can observe the traffic and ROI across every part.
Now that you’ve inserted the code, you can watch your charts shift and turn the data into progress as you attract visitors and promote content.
3. Pick marketing goals
Google Analytics lets you set specific benchmarks for your site’s performance that get tailored to your business. In Admin > View > Goals, you can construct distinct goals to fit your site and view your success. If you have an ecommerce store, a goal would be to sell a product.
A retailer would have a finished goal when someone buys a pair of shoes on their site. Goals vary widely, depending on your business size and nature. You can separate goals into four types, and they can mean certain things for each site.
Check out the goal categories:
- Destination goals: Ending up at a specific URL
- Duration goals: The time spent on a page or the website in general
- Page goals: Number of pages a visitor went through on the site
- Event goals: Completing a video, clicking “share,” or a similar activity
- Smart goals: Machine learning targets the sessions with the most potential for conversions
So, what action are you looking for? To spark some ideas, here are a few samples:
- Generate leads through form submissions
- Increase dwell time on a contact page
- Reach the “shopping cart” page
- Get people to watch a video
4. Navigate Google Analytics reports
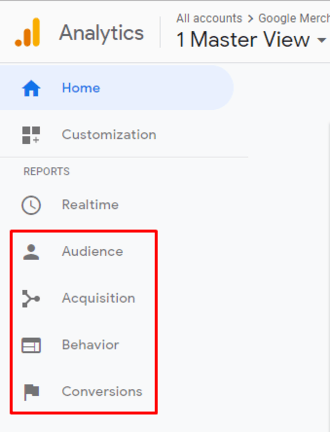
The traditional Google Analytics reports line the side of the tool, and they allow you to go in-depth on many topics. Google Analytics reports cover Audience, Acquisition, Behavior, and Conversions. In some cases, these reports will use data sampling.

Audience
The Audience report supplies critical details about your site visitors. You can become familiar with their interests, location, device usage, and other demographic specifics to better market your services or products. It also gives the bounce rate — the percentage of people who navigate away from your page after they arrive, without visiting any other pages on your site — which is useful for improving your ranking in search results.
Acquisition
Acquisition tells you where people found your site (how you “acquire” them), how they move around your website (sessions and duration), and whether they bring revenue.
Behavior
Behavior reports show data related to user actions.
It also holds an exciting feature called Site Search. Site Search lets you see sessions that searched for something specific on your site, and you can see their query terms, too. This feature allows you to observe what people expect and can’t find when coming to your site.
However, you have to enable this feature and input a site search on your website if you’d like to gather this kind of data.
Conversions
The Conversions report shows you how many goals you’ve reached and how different channels contribute to sales and conversions. You can also configure custom reports to use in Google Analytics with your desired metrics and dimensions. At Customization > Custom Reports, you can pick and choose the features that apply to you.
This report then compiles relevant data in one place, so you can access and share it easily.
5. Set up the dashboard
The ultimate benefit of learning how to use Google Analytics is seeing your site’s condition. You can view essential information from the dashboard, but the default settings aren’t advanced and selective. Customized dashboards for your Google Analytics property collects the widgets you want in designated groups.
You can monitor the areas of the highest concern with personalized dashboards rather than sifting through trivial data.
Looking for an all-in-one SEO audit tool? You’ve found it.
SEO Checker provides data on key metrics to give you:
- Complete SEO score
- Content Grade
- Site Speed Analysis
- and more.

Improve your Google Analytics numbers with WebFX
Our Google Analytics tutorial is only the start of what this resource can do for your business. You can compare effective parts of your site with points of weakness until it’s a powerhouse and able to round up high volumes of traffic and optimal rankings.
At WebFX, we have a team of more than 200 specialists, adding years of knowledge and proficiency to your campaign. Our search engine optimization (SEO) services provide analysis, optimization, reporting, and real results to drive revenue for your business. We also offer Google Analytics consulting that guides you through the next steps of how to use Google Analytics for content, website design, and more.
Contact us online or call us at 888-601-5359 to speak to an expert about our web analytics services.
-
 Trevin serves as the VP of Marketing at WebFX. He has worked on over 450 marketing campaigns and has been building websites for over 25 years. His work has been featured by Search Engine Land, USA Today, Fast Company and Inc.
 -

WebFX is a full-service marketing agency with 1,100+ client reviews and a 4.9-star rating on Clutch! Find out how our expert team and revenue-accelerating tech can drive results for you! Learn more
Try our free SEO Checker
Boost your site’s search performance with our free SEO Checker. Analyze your website for optimization tips on titles, headers, content, speed, and more. Get a free report now to enhance rankings on Google, Bing, Yahoo, and beyond!


How Is Your Website’s SEO?
Use our free tool to get your score calculated in under 60 seconds.
Try our free SEO Checker
Boost your site’s search performance with our free SEO Checker. Analyze your website for optimization tips on titles, headers, content, speed, and more. Get a free report now to enhance rankings on Google, Bing, Yahoo, and beyond!


