

-
Why are TikTok marketing benchmarks important for brands?
TikTok marketing benchmarks provide competitive intelligence to identify performance gaps, optimize content strategy, and allocate ad budgets with precision—transforming creative decisions from experiments into revenue-driving engines backed by data rather than guesswork. -
What is a strong TikTok engagement rate?
TikTok’s average engagement rate is 3.85–4.1%, which is nearly 8× higher than Instagram’s 0.45%—smaller accounts under 5K followers often achieve even better rates around 4.2% because the algorithm favors authentic conversations and niche audiences over large, diluted follower bases. -
How cost-effective is TikTok advertising compared to other platforms?
TikTok ads average $9.16 CPM, making them more cost-efficient than Meta’s $14.91 average Facebook CPM—brands that create authentic, native-looking content instead of polished promos can double engagement while stretching their advertising dollars further. -
What video metrics matter most for TikTok algorithm success?
Completion rate and average watch time are critical—videos keeping viewers past the 40–60% completion mark gain sustained FYP exposure, while strong retention past 60 seconds drives higher comment rates and algorithmic promotion regardless of video length. -
How can brands turn benchmarks into improved ROI?
Brands should build content for performance by analyzing top-performing posts’ structure, rotate ad creatives weekly to maintain low CPMs, and track the complete TikTok-to-site conversion journey in GA4 to fix friction points before scaling ad spend.
TikTok marketing benchmarks can vary greatly, but average engagement rates rang from 3.85% – 4.90% while TikTok ads see a 0.84% click-through rate (CTR). And there are plenty more 2026 benchmarks to dive into!
We’ll walk you through exactly what engagement rates, ad costs, and performance metrics you should hit, plus actionable strategies to close the gap and turn insights into impact.
Why TikTok marketing benchmarks matter for your brand
121.5 million TikTok users are in the U.S., and they spend approximately 32% of their Internet time on the clock app.
If you’re thinking that TikTok is just a fun place for cat videos and killer dance moves, think again. A recent study reports that 56% of U.S. consumers have purchased products promoted or advertised on TikTok, turning scroll time into serious sales opportunities. But capitalizing on that buying power requires more than showing up.
Benchmarking your TikTok marketing gives you the competitive intelligence to spot performance gaps before they cost you revenue. When you know the average brand posts six times per week but achieves better results at 3-5 posts, you stop overproducing and start optimizing. When you understand TopView ads can convert 3x better than In-Feed placements, you allocate budget with precision instead of hope.
You see, the brands dominating TikTok aren’t relying on pure hunches. They actually measure against benchmarks and adjust in real-time. This data-driven approach transforms content decisions from creative experiments into revenue engines, making sure every video, ad, and strategy move pushes you closer to tangible ROI.
TikTok engagement benchmarks
Engagement rate tells you how many people actually care about your content (not just scroll past it). On TikTok, engagement refers to likes, comments, shares, and saves relative to your follower count. The platform rewards genuine interaction, which is why understanding where you stand against industry benchmarks can make or break your content strategy.
🔽 Table view
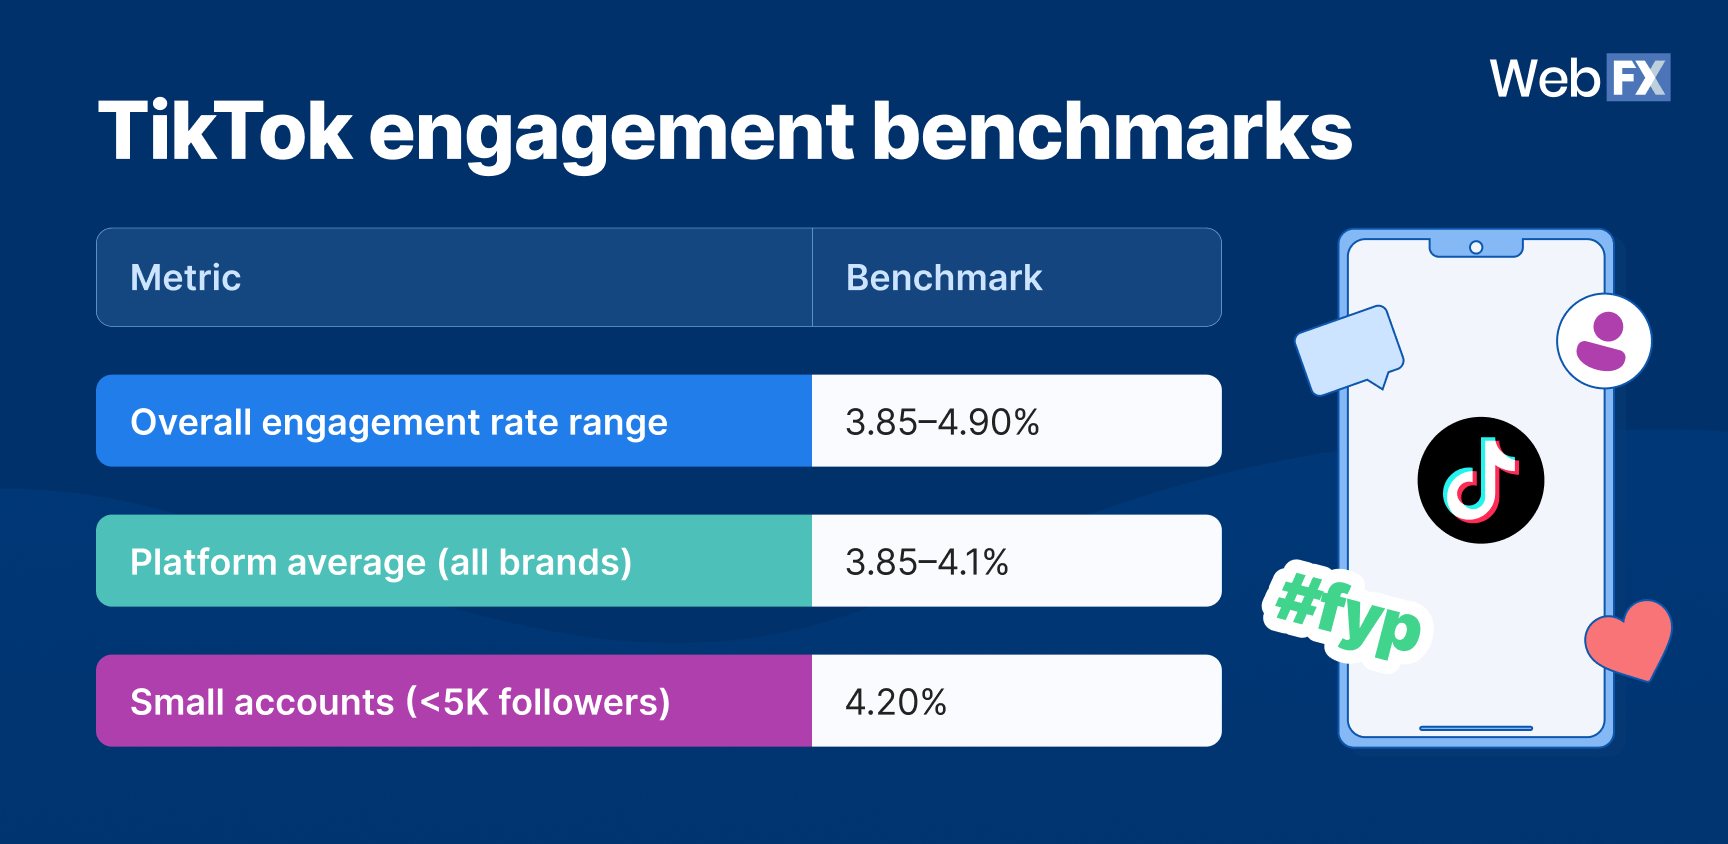
| Metric | Benchmark |
| Overall engagement rate range | 3.85–4.90% |
| Platform average (all brands) | 3.85–4.1% |
| Small accounts (<5K followers) | 4.20% |
📊 Key insights
- Smaller accounts have a hidden advantage. Those under 5K followers often see engagement rates around 4.2%, while all brands on the app average 3.85–4.1%. TikTok’s algorithm favors real conversations, and niche audiences engage better than diluted follower bases.
- TikTok crushes other platforms on engagement. Instagram currently averages a 0.45% engagement rate (down 24.1% YoY). TikTok’s 3.85% baseline is nearly 8× higher. The For You Page (FYP) levels the playing field, as a brand with 2,000 followers posting quality content can outperform a 200K account phoning it in.
- Maintaining engagement gets harder as you grow. More followers often means more passive scrollers. Brands sustaining 4%+ engagement at scale double down on authentic storytelling, trending audio, and content that sparks interaction.
💡 Actionable takeaways
- Track engagement per video, not just your overall average. One viral hit skews your numbers. Find which formats (tutorials, behind-the-scenes, user-generated content) consistently hit 4%+ and do more of that.
- Prioritize saves and shares over views. The algorithm promotes content that people revisit or send to friends. Add questions, cliffhangers, or “save this” hooks to signal your video deserves more reach.
- Lean into your niche instead of chasing everyone. Under 5K followers? You’re in the sweet spot. A skincare brand talking to acne-prone teens beats generic “beauty tips” every time.
TikTok advertising benchmarks
TikTok ads don’t just sell products. They sell discovery, too. The platform’s blend of entertainment and algorithmic precision lets even small budgets make a big splash. But performance depends on how efficiently you buy attention, and ultimately, how effectively you turn that into action.
🔽 Table view
| Metric | Benchmark |
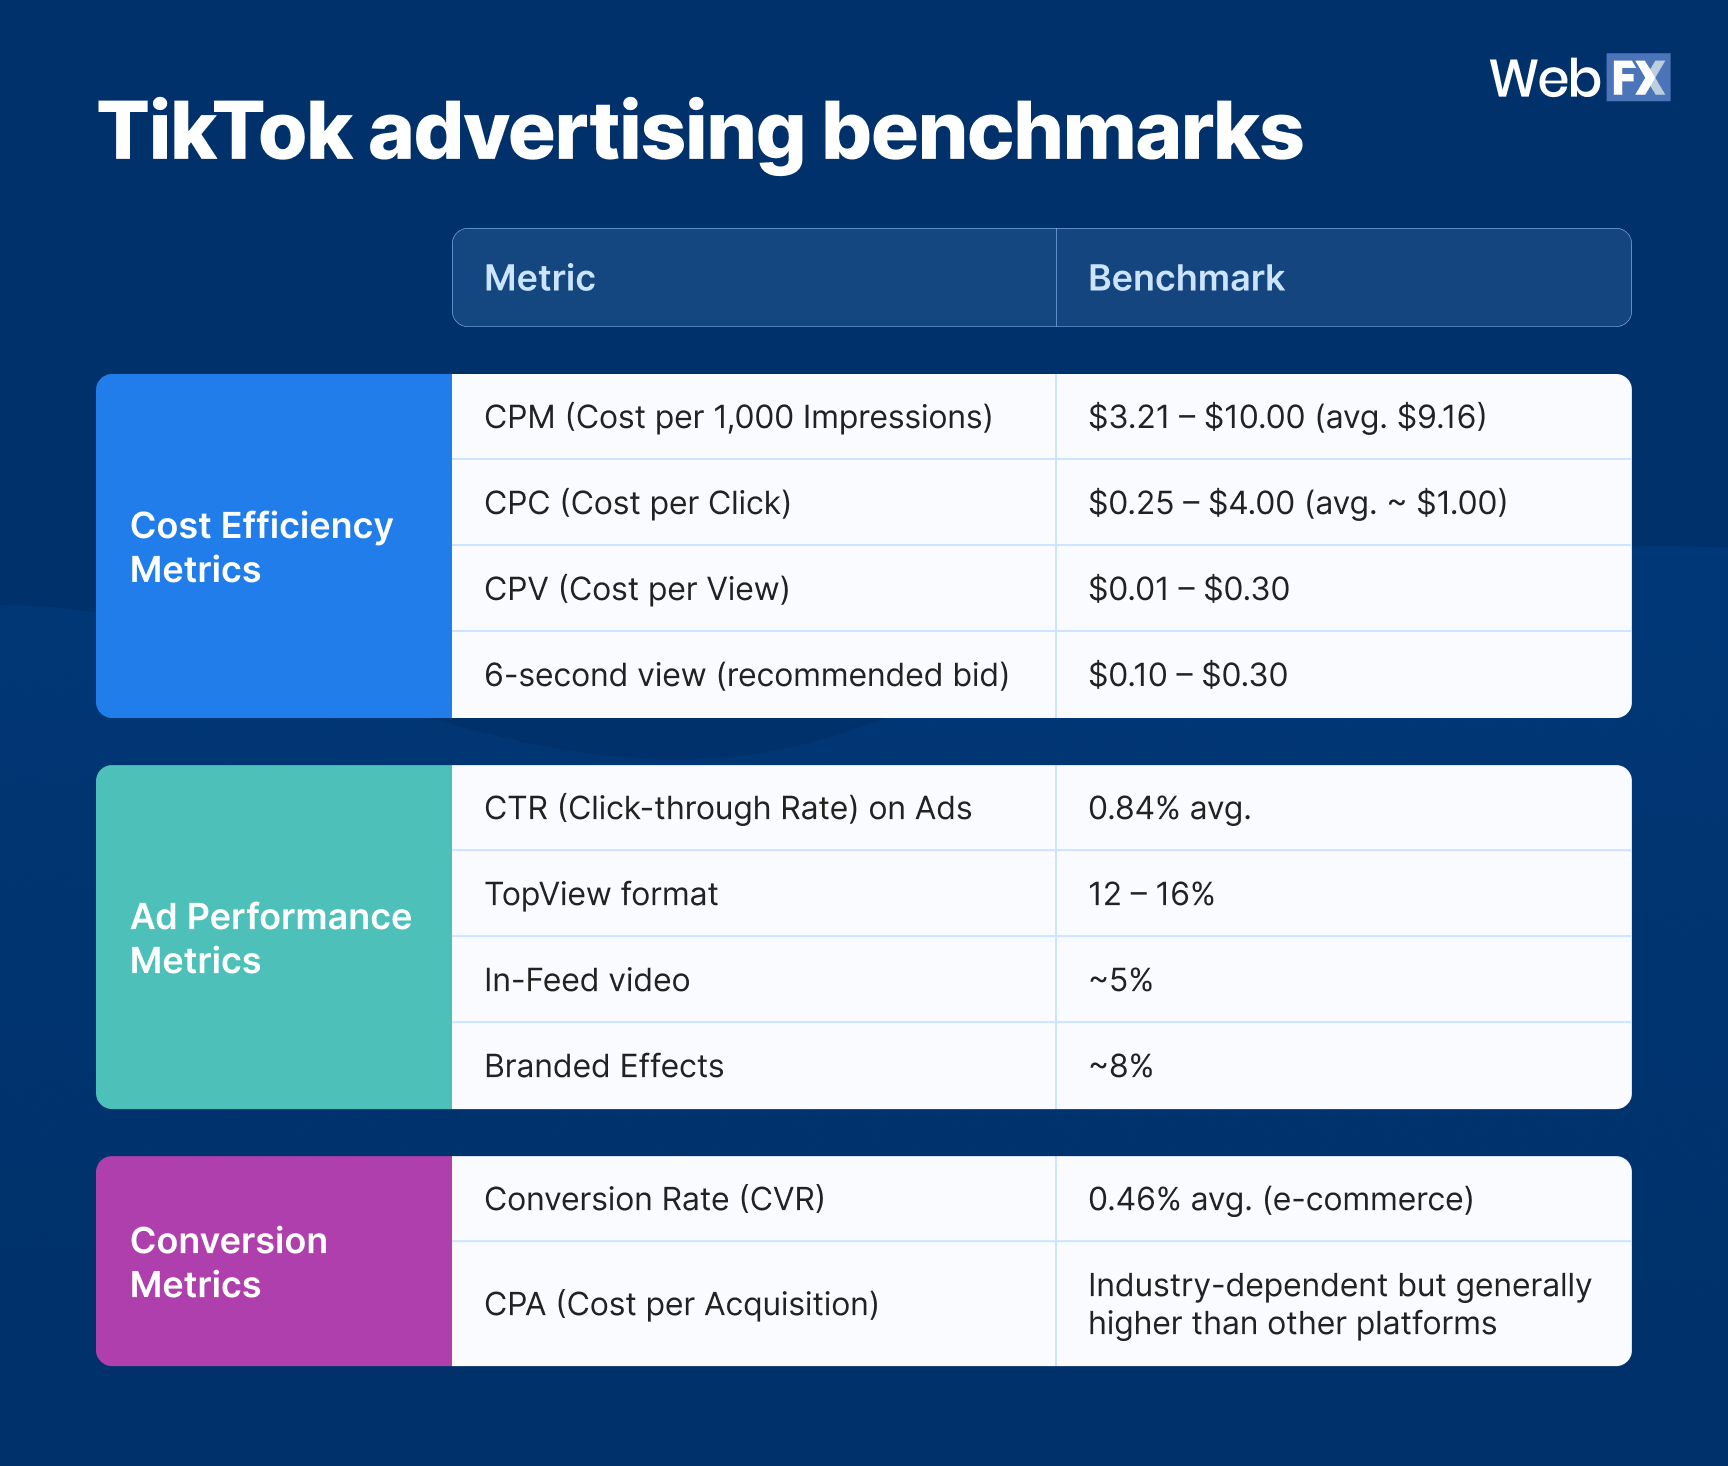
| Cost Efficiency Metrics | |
| CPM (Cost per 1,000 Impressions) | $3.21 – $10.00 (avg. $9.16) |
| CPC (Cost per Click) | $0.25 – $4.00 (avg. ~ $1.00) |
| CPV (Cost per View) | $0.01 – $0.30 |
| 6-second view (recommended bid) | $0.10 – $0.30 |
| Ad Performance Metrics | |
| CTR (Click-through Rate) on Ads | 0.84% avg. |
| TopView format | 12 – 16% |
| In-Feed video | ~5% |
| Branded Effects | ~8% |
| Conversion Metrics | |
| Conversion Rate (CVR) | 0.46% avg. (e-commerce) |
| CPA (Cost per Acquisition) | Industry-dependent but generally higher than other platforms |
📊 Key insights
- TikTok ads stretch your dollar further. With CPMs averaging $9.16, TikTok remains one of the most cost-efficient platforms for reach (cheaper than Meta with $14.91 average Facebook CPM), while delivering higher engagement per impression.
- Creative execution beats ad spend. The average 0.84% CTR climbs fast when your ad looks native to the FYP. Brands that ditch polished promos for quick, authentic storytelling often double their engagement.
- Format fit defines success. TopView ads (12–16%) dominate for visibility, while Branded Effects (~8%) and In-Feed videos (~5%) drive participation, each playing a unique role across the funnel.
💡 Actionable takeaways
- Lead with the hook, not the logo. Capture attention in the first three seconds. Movement, curiosity, or humor will outperform branding every time.
- Test by intent, not assumption. Use TopView for awareness, In-Feed for mid-funnel, and Branded Effects for engagement, then track which drives your lowest CPC or highest completion rate.
- Audit your cost-to-conversion path. A $1 CPC and 0.46% CVR mean every creative and landing-page disconnect costs you real money, so fix friction before scaling spend.
TikTok performance benchmarks
Every scroll is a split-second audition. TikTok doesn’t hand out reach to whoever posts the most. It crowns the videos people can’t swipe away from. Your completion rate and average watch time are your north stars that tell the algorithm whether your video deserves a spot on more For You Pages.
🔽 Table view
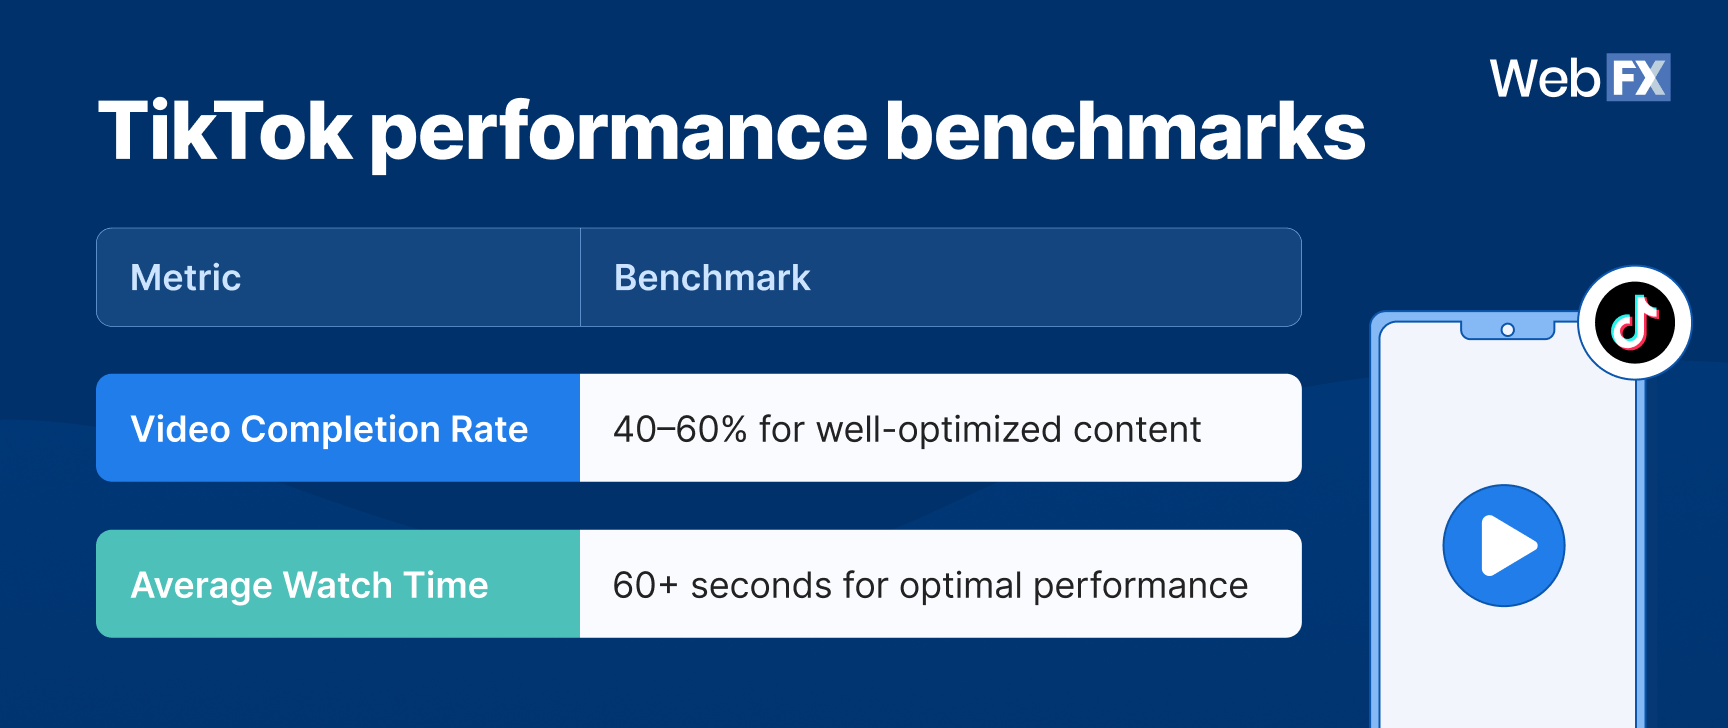
| Metric | Benchmark |
| Video Completion Rate | 40–60% for well-optimized content |
| Average Watch Time | 60+ seconds for optimal performance |
📊 Key insights
- Retention is the real reach multiplier. Videos that keep viewers past the halfway mark (40–60% completion) are far more likely to hit sustained exposure on the FYP.
- Longer videos win when they earn it. While shorter clips grab attention, TikToks that hold viewers past 60 seconds often see stronger watch time and higher comment rates.
- Story structure beats trend chasing. Viewers stay longer when videos have a clear narrative arc (curiosity → payoff) instead of recycled trends that fade in the scroll.
💡 Actionable takeaways
- Hook early, reward late. Start fast, then deliver on your promise by the end to push completion rates above 50%.
- Repurpose strong finishers. If a post keeps retention past 60%, re-edit or caption it for new angles. The algorithm likes fresh uploads that sustain watch time.
- Track retention dips, not just averages. Use TikTok Analytics to spot where viewers drop off and adjust pacing, visuals, or text overlays accordingly.
How to use TikTok marketing benchmarks to improve ROI
Bear in mind that these benchmarks aren’t the goal. Treat them as your guardrails. When you know where the averages sit, you can finally see where to break them. TikTok moves fast, but the math behind it doesn’t lie. Here’s how you can turn benchmarks into breakthroughs:
1. Build for performance, not presence.
If your content averages below 3.8% engagement or your completion rate rarely clears 40%, the problem isn’t frequency but friction. Simplify visuals, front-load your value, and keep the story moving.
✅ Test this: Audit your last 10 posts. Find the top three with the highest completion rates and rebuild your next week’s content around their pacing and structure.
2. Let cost metrics guide creative strategy.
A $9.16 CPM exposes what your audience actually values. When your CPM spikes, it’s not inflation; it’s a signal your ad no longer earns attention. Refresh your hook before your budget bleeds.
✅ Test this: Rotate your creatives weekly. Swap your ad’s opening frame or caption every seven days and monitor CPM changes. Your lowest-cost version wins this test.
3. Optimize for outcomes, not applause.
A 0.84% CTR means users noticed you. A 0.46% CVR means they acted. The brands growing fastest on TikTok track both because engagement without conversion is just expensive entertainment.
✅ Test this: Map your TikTok-to-site journey in Google Analytics 4 (GA4). Track where users drop after clicking your ad, fix that friction point, and only then scale your spend.
Benchmarks give you direction, but action turns them into actual growth. When you treat data as feedback (not judgment), your next post stops being a guess and starts being a calculated climb toward ROI.
🎥 How to use TikTok for business (no experience necessary)
FAQs about TikTok marketing benchmarks
What are TikTok marketing benchmarks?
TikTok marketing benchmarks are performance averages that show how your content and ads stack up across the platform. They include metrics like engagement rate (3.85–4.9%), CPM ($9.16 average), and video completion rate (40–60%). Use them to evaluate if your results are competitive, overperforming, or need optimization.
What’s a good engagement rate on TikTok in 2026?
A strong TikTok engagement rate sits between 3.85% and 4.9%, with smaller accounts under 5K followers averaging 4.2%. Anything above 5% signals high-performing, community-driven content that resonates beyond your follower base.
How much do TikTok ads cost in 2026?
TikTok ads average a CPM of $9.16 and a CPC of around $1.00, making it one of the most cost-efficient platforms for reach and engagement. Expect a CTR of 0.84% and a conversion rate near 0.46% for e-commerce campaigns, with creative quality driving the biggest variance.
How often should brands post on TikTok?
Brands performing best on TikTok typically post 3–5 times per week. That cadence balances visibility with creative quality, enough to feed the algorithm consistently without sacrificing originality or burning out your team.
How can I improve my TikTok ROI using benchmarks?
Start by comparing your current metrics to platform averages. For example, if your completion rate is below 40%, refine your hook and pacing. If your CPM spikes above $10, refresh your ad creatives. Small, data-informed tweaks to engagement and cost metrics can double performance over time.
You’ve got the data. Now let’s make it dance.
The gap between average performance and market-leading results is, well, execution. When your creative strategy aligns with platform benchmarks, your CPM drops, your completion rates climb, and your ad spend starts working harder than it ever has.
But let’s face it, managing TikTok campaigns that consistently beat the benchmark takes strategy, speed, and stamina. Rapid creative testing, data-backed iteration, and constant performance tuning. It’s a full-time job that most in-house teams can’t juggle alone.
With 30 years of digital expertise and a team of 750+ marketing experts, we don’t just report results, we deliver them. Our proven TikTok advertising services handle the heavy lift: Creative rotation, audience targeting, budget optimization, and performance tracking, so you can focus on building your business.
Your brand already has a story worth sharing. Let’s make sure it’s one the algorithm (and your audience) can’t ignore. Contact us online or call 888-601-5359 to speak with a strategist today!
Data sources & methodology
This report combines WebFX proprietary campaign data with third-party competitive intelligence to provide the most accurate, up-to-date TikTok marketing benchmarks available.
The majority of insights come from in-house performance data across hundreds of managed U.S.-based TikTok campaigns, spanning multiple industries and ad formats. These findings are supplemented by public benchmarking datasets and platform reports to ensure statistical validity and context across the broader marketing landscape.
All metrics represent median or average values derived from verified campaign performance between 2024 and 2025.
-
 Albert Dandy Velasquez blends SEO strategy with compelling storytelling to help businesses boost their visibility and revenue online. With a B.A. in English and certifications from HubSpot, Semrush, and Google Analytics, he has written and optimized hundreds of articles on organic SEO, content strategy, and user experience. He regularly contributes to the WebFX blog and SEO.com, creating content that helps readers turn marketing goals into measurable results. When he’s off the clock, he’s usually exploring new neighborhoods on two wheels, filming travel content, or chasing golden hour with a coffee in hand.
 -

WebFX is a full-service marketing agency with 1,100+ client reviews and a 4.9-star rating on Clutch! Find out how our expert team and revenue-accelerating tech can drive results for you! Learn more
Twitter and Facebook Status Generator
Finding engaging social media content for your business can be difficult. Use our tool to quickly find ideas and post directly to your page.
Give Me an Idea
Share this article

Social Media Success Story

Twitter and Facebook Status Generator
Finding engaging social media content for your business can be difficult. Use our tool to quickly find ideas and post directly to your page.
Give Me an Idea
What to read next