

Table of Contents
- What is a sales analysis report?
- What data can you find in a sales analysis report?
- What is the purpose of a sales analysis report?
- The benefits of sales analysis reports
- The key elements in a sales report
- 10 different types of sales reports
- 1. Sales pipeline report
- 2. Conversion rate report
- 3. Average deal size report
- 4. Average sales cycle length report
- 5. Marketing collateral and channel usage report
- 6. Won vs. lost deals analysis report
- 7. Customer churn report
- 8. Sales call report
- 9. Lead response time report
- 10. Revenue report
- How do you write a sales analysis report?
- 1. Identify your sales analysis report’s audience
- 2. Outline your sales report’s objectives
- 3. Decide your sales reporting timeframe
- 4. Gather your data
- 5. Provide historical data
- 6. Discuss your key insights and recommendations
- 7. Use visuals to support your storytelling
- 8. Create a sales analysis report template
- Write a sales analysis report with the help of RevenueCloudFX
They say you can only improve what you can measure. So if you want to increase your profits and optimize your sales process, you need sales analysis reports to give you data-driven insights about your process and results.
If you want to know more about the different types of sales reports and how to write a sales analysis report, you’re in luck. This blog post will go through these topics:
- What is a sales analysis report?
- What data can you find in a sales analysis report?
- What is the purpose of a sales analysis report?
- The benefits of sales analysis reports
- The critical elements in a sales report
- 10 different types of sales reports
- How do you write a sales analysis report?
Feel free to go through all the sections or jump into any topic you need help with.
What is a sales analysis report?
A sales analysis report is a document that shows you data, insights, and trends related to your sales activities within a certain period so you can measure your success.
What data can you find in a sales analysis report?
Sales reports typically contain these metrics:
- Revenue
- Number of leads in the sales pipeline
- Lead conversion rate
- Historic sales data
- Sales or industry trends
What is the purpose of a sales analysis report?
The objectives of sales analysis reports are:
- To find out if your sales performance during the period improved or declined
- To guide your next strategies and finetune your sales process
Whether you’re a new small- to medium-sized business (SMB) or an enterprise, you’ll benefit from using sales analysis reports. Sales leaders can use these reports to make informed decisions and craft sales strategies aligned with their goals.
The benefits of sales analysis reports
Sales analysis reports outline crucial data in a standardized way, giving you an overview of your sales performance during a certain period. Here are the benefits of having sales reports:
- Report your sales performance and forecast: What was your sales figure during a specific period? Sales analysis reports can provide this information. It can also provide you with insights to help you with sales forecasting.
- Analyze product demand: Are your prospects interested in your product, or are your sales declining? Sales analysis reports help you understand your offering’s demand. Perhaps a new competitor launched a product similar to yours. Or customers’ needs have changed.
- Provide customer insights: Sales analysis reports help you understand your customers’ needs. As a result, your marketing team can improve its strategies, and your sales team can also improve its nurturing process to close a deal.
- Refine sales strategies: If you regularly and properly examine your sales performance, customers’ reception of your products, and overall marketing, you can improve your sales management and optimize your sales processes.
The key elements in a sales report
Different companies will have different sales analysis report content because each has a unique set of objectives and key performance indicators (KPIs) to track. However, here are some key elements that most companies need in their sales report:
- Sales KPIs and metrics like net profit margin and number of units sold
- Comparison of your current sales metrics with the previous period (say, monthly) and previous season (say, during the same period last year)
- Total sales volume
- Gross and net sales
Sales analysis reports must focus on the most important metrics that affect your sales process so that you can optimize it. Having too much data in your reports not only overwhelms your team but also impacts your team’s productivity.
10 different types of sales reports
Sales leaders need a variety of sales analysis reports to get an overview of the sales process and how it’s helping the business achieve its sales goals. Here are 10 of the most common types of sales analysis reports:
- Sales pipeline report
- Conversion rate report
- Average deal size report
- Average sales cycle length report
- Marketing collateral and channel usage report
- Won vs. lost deals analysis report
- Customer churn report
- Sales call report
- Lead response time report
- Revenue report
Let’s go through each one to discuss what each sales analysis report is for:
1. Sales pipeline report
- Best for: Identifying the best practices for each sales pipeline stage and understanding which stages have an efficient process and which stages need process improvements
Do you know which deals are likely to close, which ones may not, and how each deal can affect your bottom line? A sales pipeline report can help you answer these questions and evaluate the sales health of your business.
Make sure your sales reps do their due diligence in creating a realistic pipeline so that you can accurately forecast your closed deals.
2. Conversion rate report
- Best for: Measuring the effectiveness of your sales strategies
A conversion rate report helps you better understand your prospect-to-lead and lead-to-customer conversion. It measures your sales strategies’ effectiveness and identifies their strengths and weaknesses.
At which stage of the sales lifecycle do your sales reps excel or underperform? You can identify which strategies deliver results and which you need to optimize. Conversion rate reports also measure your sales reps’ strengths and weaknesses, so you can provide the support they need to increase their conversion rates.
3. Average deal size report
- Best for: Setting weekly or monthly milestones for your sales representatives
An average deal size report helps you forecast revenue and set milestones for your sales team. Let’s say your monthly revenue target is $40,000, and your average deal size is $5000. Your sales team needs to close eight deals for the month to reach your revenue target.
Make sure you monitor your average deal size regularly so you can set realistic expectations and milestones for your team and individual sales representatives.
4. Average sales cycle length report
- Best for: Evaluating the sales process’s efficiency and analyzing individual sales representative’s performance
Average sales cycle length refers to the average time it takes for a sales representative to close a sale. This report shows the sales performance of each sales representative and tells you about your sales process’s efficiency.
If you want to use an average sales cycle length report, set an apt timeframe as your benchmark. You can then start evaluating your sales reps’ performance against your benchmark.
Is one of your sales representatives struggling to close a deal within the average sales cycle length? Identify their pain points and provide coaching.
However, if all your sales representatives can’t close deals within your sales cycle length average, it’s time to evaluate your sales process. You may need to optimize your approach and training.
5. Marketing collateral and channel usage report
- Best for: Identifying the relevant marketing campaigns and channels among your prospects
Which marketing campaigns and channels have attracted new prospects and customers? Use a marketing collateral and channel usage report to determine the most effective marketing campaigns and channels among your customers.
Did most of your leads that turned into customers come from search? Which channels generated the most cold leads? Share this report with your marketing team, so they know which campaigns and channels are effective, and they can improve their strategies.
A tool like RevenueCloudFX, a proprietary sales and marketing platform from WebFX, is a comprehensive tool that can help you identify your most effective channels and campaigns. It can even provide insights into the buyer’s journey, so you’ll know when they became aware of your brand and signed up as a lead.
6. Won vs. lost deals analysis report
- Best for: Getting customers’ insights about your offerings’ advantages and disadvantages versus your competitors
While it’s a good idea to monitor and analyze your closed deals, evaluating your lost deals is also essential. Why?
Understanding why a prospect chose a competitor’s product over yours informs you of your customers’ needs and pain points. Did prospects choose your product over a competitor? A won vs. lost deals analysis report can tell you their favorite product features, so you can better understand your prospects’ problems.
This sales analysis report gives you an overview of your product’s overall strengths and weaknesses.
7. Customer churn report
- Best for: Understanding why your customers churn and improving your sales process to make your customers happy
Is your business’s customer churn rate higher than your company or industry average? Address the increasing customer churn by finding out why your customers decided to stop engaging with your business with a customer churn report.
Are they churning because of a price increase, service, quality, or product features? When a customer churns, reach out to your customer to understand their challenges and needs. These insights can help you improve your customer retention rate and customer experience.
In addition, use your customer churn report to optimize your sales process and identify which parts need improvement to increase customer satisfaction.
8. Sales call report
- Best for: Identifying best practices for closing deals and segmenting prospects
Tracking the number of calls or visits to prospects is one of the ways you can measure how effective your sales representatives are. Your sales reps must have a healthy number of deals they’ve closed compared with the number of prospects they’ve reached out to.
A sales call report can help you identify gaps in your team’s close rate. Let’s say your reps are meeting about seven prospects per day, and most of them close two leads out of seven.
Two of your reps, however, are averaging four per day. Let these sales reps share their best practices. Consider coaching reps that are struggling with closing deals.
Does your sales team notice a pattern among prospects, like high conversion rates from particular industries or low conversion rates from a specific lead source? Encourage them to share these insights, so your team can segment leads and prioritize the ones who will most likely convert.
9. Lead response time report
- Best for: Monitoring the average time it takes for your sales team to respond to leads
Did you know that you’re nine times more likely to convert prospects when you follow up within five minutes of them reaching out to you? A lead response time report helps you track the average time it takes for your reps to respond to leads, so you can shorten the time and improve your conversion rates.
If it’s taking your team more than 24 hours to respond to a lead, consider making changes to your strategies and sales processes. Regular monitoring of your lead response time (or speed to lead) and conversion rate can help you set a response time that your reps can use as a benchmark.
10. Revenue report
- Best for: Monitoring new contracts and renewals and how your sales team has been contributing to your bottom line
Make the most of a revenue report by setting your sales and revenue goals. This report shows how your sales representatives have contributed to your bottom line.
How do you write a sales analysis report?
The ultimate goal of a sales analysis report is to evaluate and communicate sales information and recommendations to your team. You must start by identifying your sales analysis report’s audience and purpose.
Is your sales analysis report intended to encourage your sales representatives to meet their quotas? Or are you crafting a sales report to update the management team about your sales activities and results?
Here’s a step-by-step guide on how to write a sales analysis report:
- Identify your sales analysis report’s audience
- Outline your sales report’s objectives
- Decide your sales analysis report’s timeframe
- Gather your data
- Provide historical data
- Discuss your key insights and recommendations
- Use visuals to support your storytelling
- Create a sales analysis report template
Let’s go through each one:
1. Identify your sales analysis report’s audience
Is your sales analysis report intended for your management? Or are you crafting a sales analysis report you’d like to share with your marketing team?
The metrics that matter to your marketing team may not be as crucial to the management team. Ensure your sales report has a dedicated audience who will find the content meaningful and actionable.
2. Outline your sales report’s objectives
Now that you’ve identified your intended audience for your sales analysis report, list your report’s objectives. Setting your report’s objectives can guide you on the data to include in your report and your report’s timeframe.
For example, your sales report’s objective is to share the performance of the different marketing campaigns with your marketing team. A monthly sales analysis report can detail the performance of your marketing channels and campaigns, such as the number of leads generated and lead quality per channel.
3. Decide your sales reporting timeframe
Your timeframe depends on your objectives and how often you’re required to update your team or management.
Do you need to encourage sales reps’ productivity and increase accountability? A daily sales report makes sense. Include the following metrics to guide them:
- Number of sales opportunities for the day
- Number of calls made
- Number of proposals sent
If you need to measure your representatives’ sales performance and inform them if they’re on track to reach their quotas, a weekly sales report makes sense. Provide these details to let them know how they’re doing:
- Number of calls and appointments made
- Number of closed deals
- Lead-to-opportunity ratio
- Lead conversation ratio
- Total sales per location
Was your sales strategy effective? A sales analysis report that summarizes your monthly sales performance can help you assess your strategy. Track these metrics monthly, so you can adjust your strategy or tweak your process to meet your business goals:
- Sales cycle length
- Number of deals at each stage of your pipeline
- Average close rate
- Average deal size
- Sales volume
4. Gather your data
Collect the sales data for your report. If your business uses a customer relationship manager (CRM), data downloading, data transformation, and data analysis are easier. Do you need sales data for the past seven days? Use filters and export your data for the week.
CRMs like Nutshell even let you download presentation-ready charts and graphs, making your reports easier to understand and analyze.
5. Provide historical data
After writing sales analysis reports for some time, you can compare your current sales performance or data with the previous timeframe or its equivalent period. This data can help you understand sales trends and strategize your next steps.
For example, you have a monthly revenue report comparing your current revenue to the previous month. You can also compare your current revenue with your revenue from the same period last year to show its performance year-over-year.
6. Discuss your key insights and recommendations
Make your sales analysis report easy to understand by letting the data tell stories and explain key insights. Did your team close more deals this month compared to the previous month? Explain why.
If your customer retention rate increased, discuss what contributed to the growth. Did your team implement a strategy that directly reduced customer churn? Mention what you did new that contributed to the results.
Did you have fewer leads and closed deals this month? Perhaps an economic or industry change affected your sales performance, like a new competitor launching a similar product. Or an economic shift that’s affected customer behavior.
7. Use visuals to support your storytelling
Use graphs to show trends and colors to indicate growth or decline. Did a competitor start a new social media campaign directly affecting yours? Share a screenshot of their ad.
8. Create a sales analysis report template
Make writing sales analysis reports more efficient by creating a template. If your CRM allows it, automate the reports, too, so you can spend more time analyzing and collecting data.
Feel free to tweak your template as you go along. Take out metrics that no longer matter to your business. If you optimized a part of your sales process in the past, you might need to add new metrics to monitor if your refreshed sales process is bringing the desired results.
Measuring the metrics that affect your bottom line.
Are you interested in custom reporting that is specific to your unique business needs? Powered by RevenueCloudFX, WebFX creates custom reports based on the metrics that matter most to your company.
- Leads
- Transactions
- Calls
- Revenue

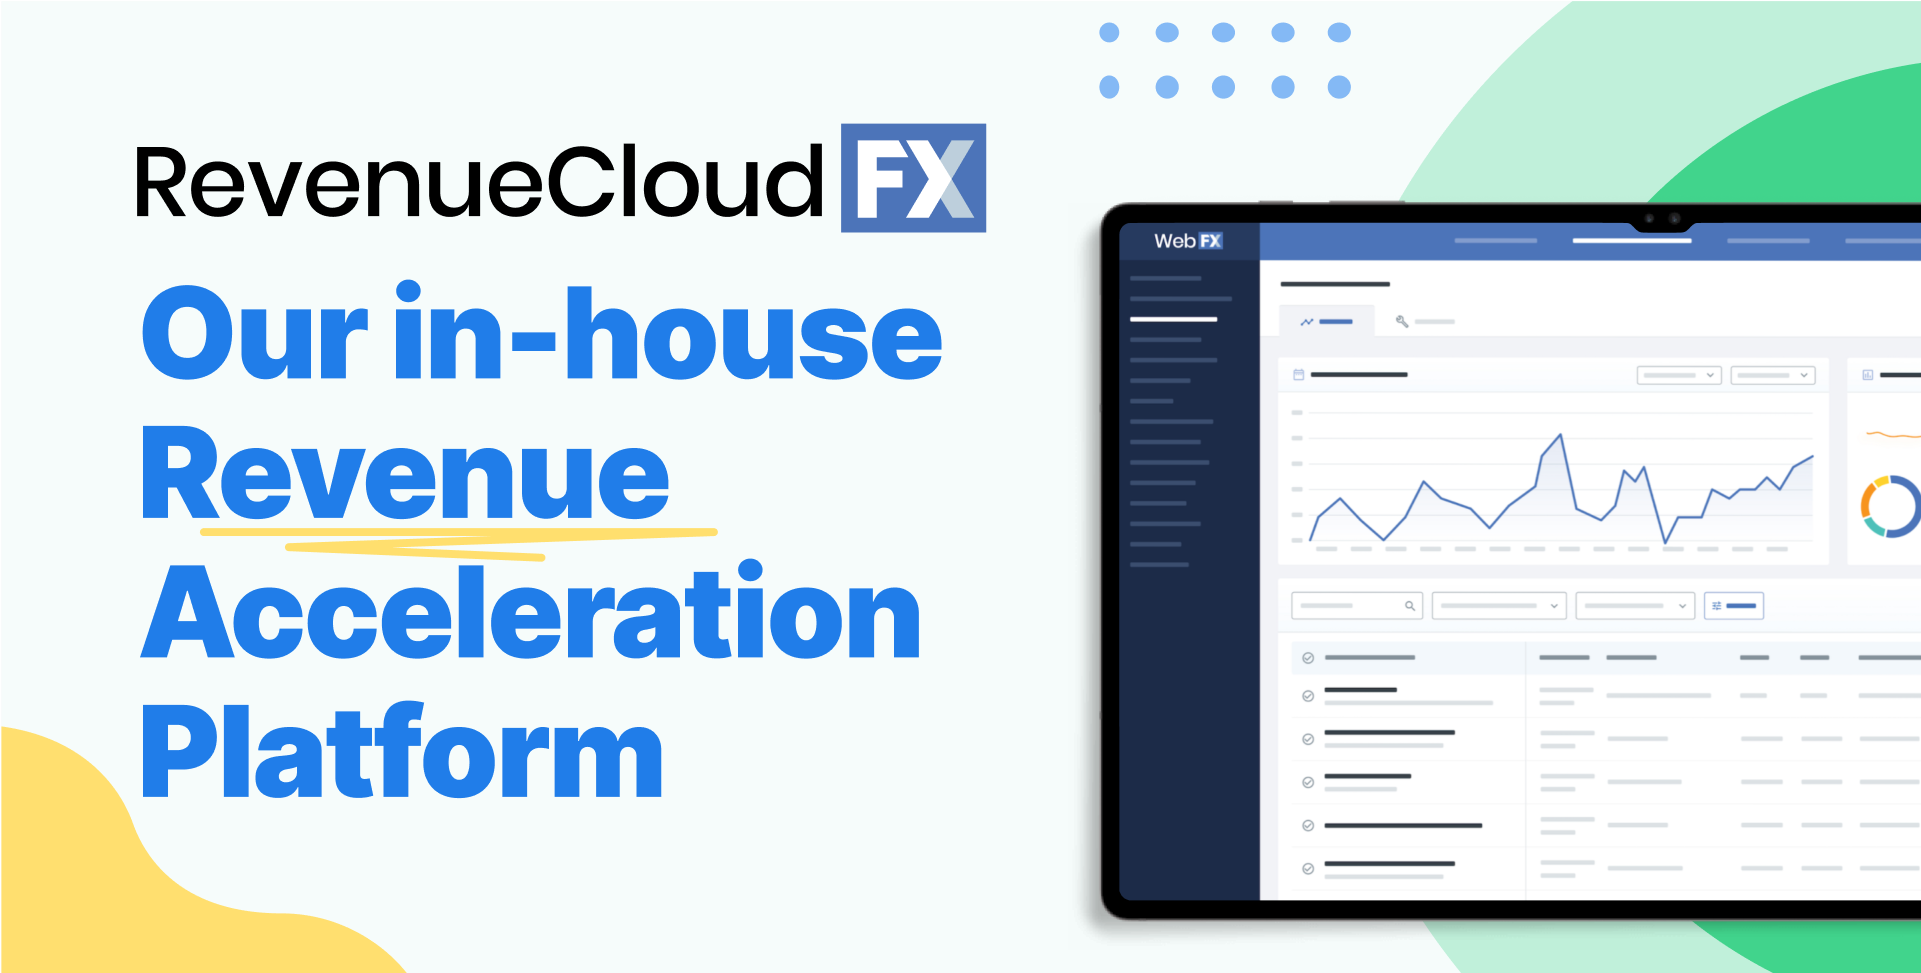
Write a sales analysis report with the help of RevenueCloudFX
Sales analysis reports help you refine your strategies and processes to improve your bottom line. If you need help writing and analyzing sales reports, look no further than WebFX.
With our proprietary sales and marketing technology, RevenueCloudFX, writing sales analysis reports becomes a breeze as it can generate reports for you, saving you loads of time. All the data you need for your sales reports are housed in RevenueCloudFX, so you’ll spend more time analyzing than collecting data.
Powered by IBM Watson, RevenueCloudFX also comes with 10 seats in Nutshell, a user-friendly CRM platform that can generate visually appealing reports.
Contact us online or call us at 888-601-5359 to speak with a strategist about RevenueCloudFX!
-
 Maria is a Lead Emerging Trends & Research Writer at WebFX. With nearly two decades of experience in B2B and B2C publishing, marketing, and PR, she has authored hundreds of articles on digital marketing, AI, and SEO to help SMB marketers make informed strategic decisions. Maria has a degree in B.S. Development Communication major in Science Communication, and certifications in inbound marketing, content marketing, Google Analytics, and PR. When she’s not writing, you’ll find her playing with her dogs, running, swimming, or trying to love burpee broad jumps.
 -

WebFX is a full-service marketing agency with 1,100+ client reviews and a 4.9-star rating on Clutch! Find out how our expert team and revenue-accelerating tech can drive results for you! Learn more
Try our free Marketing Calculator
Craft a tailored online marketing strategy! Utilize our free Internet marketing calculator for a custom plan based on your location, reach, timeframe, and budget.
Plan Your Marketing Budget
Table of Contents
- What is a sales analysis report?
- What data can you find in a sales analysis report?
- What is the purpose of a sales analysis report?
- The benefits of sales analysis reports
- The key elements in a sales report
- 10 different types of sales reports
- 1. Sales pipeline report
- 2. Conversion rate report
- 3. Average deal size report
- 4. Average sales cycle length report
- 5. Marketing collateral and channel usage report
- 6. Won vs. lost deals analysis report
- 7. Customer churn report
- 8. Sales call report
- 9. Lead response time report
- 10. Revenue report
- How do you write a sales analysis report?
- 1. Identify your sales analysis report’s audience
- 2. Outline your sales report’s objectives
- 3. Decide your sales reporting timeframe
- 4. Gather your data
- 5. Provide historical data
- 6. Discuss your key insights and recommendations
- 7. Use visuals to support your storytelling
- 8. Create a sales analysis report template
- Write a sales analysis report with the help of RevenueCloudFX
Share this article

Proven Marketing Strategies
Try our free Marketing Calculator
Craft a tailored online marketing strategy! Utilize our free Internet marketing calculator for a custom plan based on your location, reach, timeframe, and budget.
Plan Your Marketing Budget