
Key ecommerce benchmarks for 2026
Ecommerce marketing benchmarks are the specific data points, such as return on ad spend (ROAS) and customer acquisition cost (CAC), that represent standard industry performance, helping you see how your business measures up against the competition.
- The median CAC is $156
- The average cost per lead (CPL) for B2B companies is $148
- The average CPL for B2C companies is $116
- Email marketing generates a 6-10x ROAS
- Paid search campaigns deliver a 4-6x ROAS
In 2026, the first step to beating your competition is knowing your numbers and how they compare to your competitors. Are your ecommerce conversion rate metrics competitive? Are you overspending compared to others in the industry?
This guide dives into our latest ecommerce marketing benchmarks report for 2026 to outline key industry standards and help you create a success strategy.
What are ecommerce marketing benchmarks?
Ecommerce marketing benchmarks are the specific data points, like customer acquisition cost (CAC) and return on ad spend (ROAS), representing the standard of performance within the industry. They help you understand how well your company is performing compared to other ecommerce companies.
Why should you care about ecommerce benchmarks?
Measuring your company’s numbers against your competitors’ performance will help you see where you’re outperforming them and where you can improve.
By the end of this guide, you’ll be able to:
- Spot inefficiencies in your strategy
- Identify strategic opportunities
- Set realistic goals based on real data
- Prove your return on investment (ROI) to stakeholders
Top ecommerce benchmarks to track in 2026
Let’s explore the top benchmark categories you want to track for the highest impact on your conversion rate goals.
- Core cost benchmarks
- Return on ad spend (ROAS) benchmarks
- Search and keyword benchmarks
- Real-world practitioner insights
1. Core cost benchmarks
Before you can measure return, you must understand your investment. Our 2026 benchmarks report data shows that the average B2B cost per lead (CPL) is $148, while the average B2C CPL is $116.
But the most crucial metric is the total customer acquisition cost (CAC) — the total cost to get a new paying customer. The median CAC is $156, which represents a typical cost for a standard ecommerce business.
It’s important to note that the average CAC is much higher at $242. This is because premium verticals like consumer electronics at a $750 CAC skew the average. Dramatic variations across the industry highlight why it’s important to compare your numbers to your specific vertical, and not a generalized average.
Here’s a closer look at ecommerce cost benchmarks for the top industry verticals.

Table view
| Ecommerce cost benchmarks by industry vertical | ||||
| Vertical | B2B CPL | B2C CPL | CAC | Market position |
| Amazon and Marketplace sellers | $142 | $98 | $72 | Companies have the platform advantage |
| Apparel | $142 | $98 | $72 | Higher competition |
| General ecommerce | $142 | $98 | $130 | The market standard |
| Home and garden | $142 | $98 | $150 | Seasonal peaks |
| Furniture | $81 | $98 | $156 | B2C focused |
| Automotive ecommerce | $179 | $179 | $234 | Hybrid market |
| Specialized ecommerce | $142 | $98 | $262 | Niche premium |
| Jewelry | $218 | $180 | $350 | Luxury positioning |
| Consumer electronics | $142 | $98 | $750 | Premium tech |
Here are the key trends we’re seeing:
- Platform advantage: Amazon sellers achieve 50% lower CAC, thanks to the marketplace’s built-in infrastructure.
- Premium costs: At the other end of the spectrum, consumer electronics and jewelry companies command acquisition costs 3–5 times higher than the average, reflecting the investment needed for high-ticket items.
- B2B efficiency: The furniture vertical is a unique case where the B2B CPL, at $81, is lower than the B2C CPL, at $98. These B2B furniture companies are more efficient because they target professionals and bulk buyers.
2. Return on ad spend (ROAS) benchmarks
Once you know your costs, you need to measure your ROAS. A higher ROAS is crucial for offsetting high customer acquisition costs, particularly for premium brands.
The business model you operate under directly impacts your target ROAS.

Table view
| Performance benchmarks by business model | |||||
| Model type | B2B CPL | B2C CPL | CAC | ROAS target | Sales cycle |
| Marketplace seller | $142 | $98 | $72 | 4:1+ | 1-7 days |
| Direct-to-consumer (DTC) brand | $142 | $98 | $130-$156 | 3:1+ | 3-14 days |
| B2B ecommerce | $81-$218 | $98-$180 | $150-$350 | 5:1+ | 14-90 days |
| Luxury/premium | $218 | $180 | $350-$750 | 6:1+ | 7-30 days |
The data shows us that premium and luxury ecommerce brands are bringing in higher ROAS numbers, highlighting the importance of premium positioning.
For premium brands, for every $1 of ad spend, they’ll get $6 in return, making it the highest ROAS in our ecommerce report. So if you’re a premium ecommerce brand, if you spend $100, you need to optimize your campaigns and strategies to earn $600 in return.
The high ROAS mostly makes up for very high profit margins and customer acquisition costs. But it also means that premium and luxury brands must work exceptionally hard to ensure each sale is profitable.
On top of that, each marketing channel has a different job, influencing different ROAS expectations. Using your email list for brand awareness is as inefficient as using influencer marketing to bring in immediate, high-volume sales. To hit your goals, you need to assign the right task to the right channel.
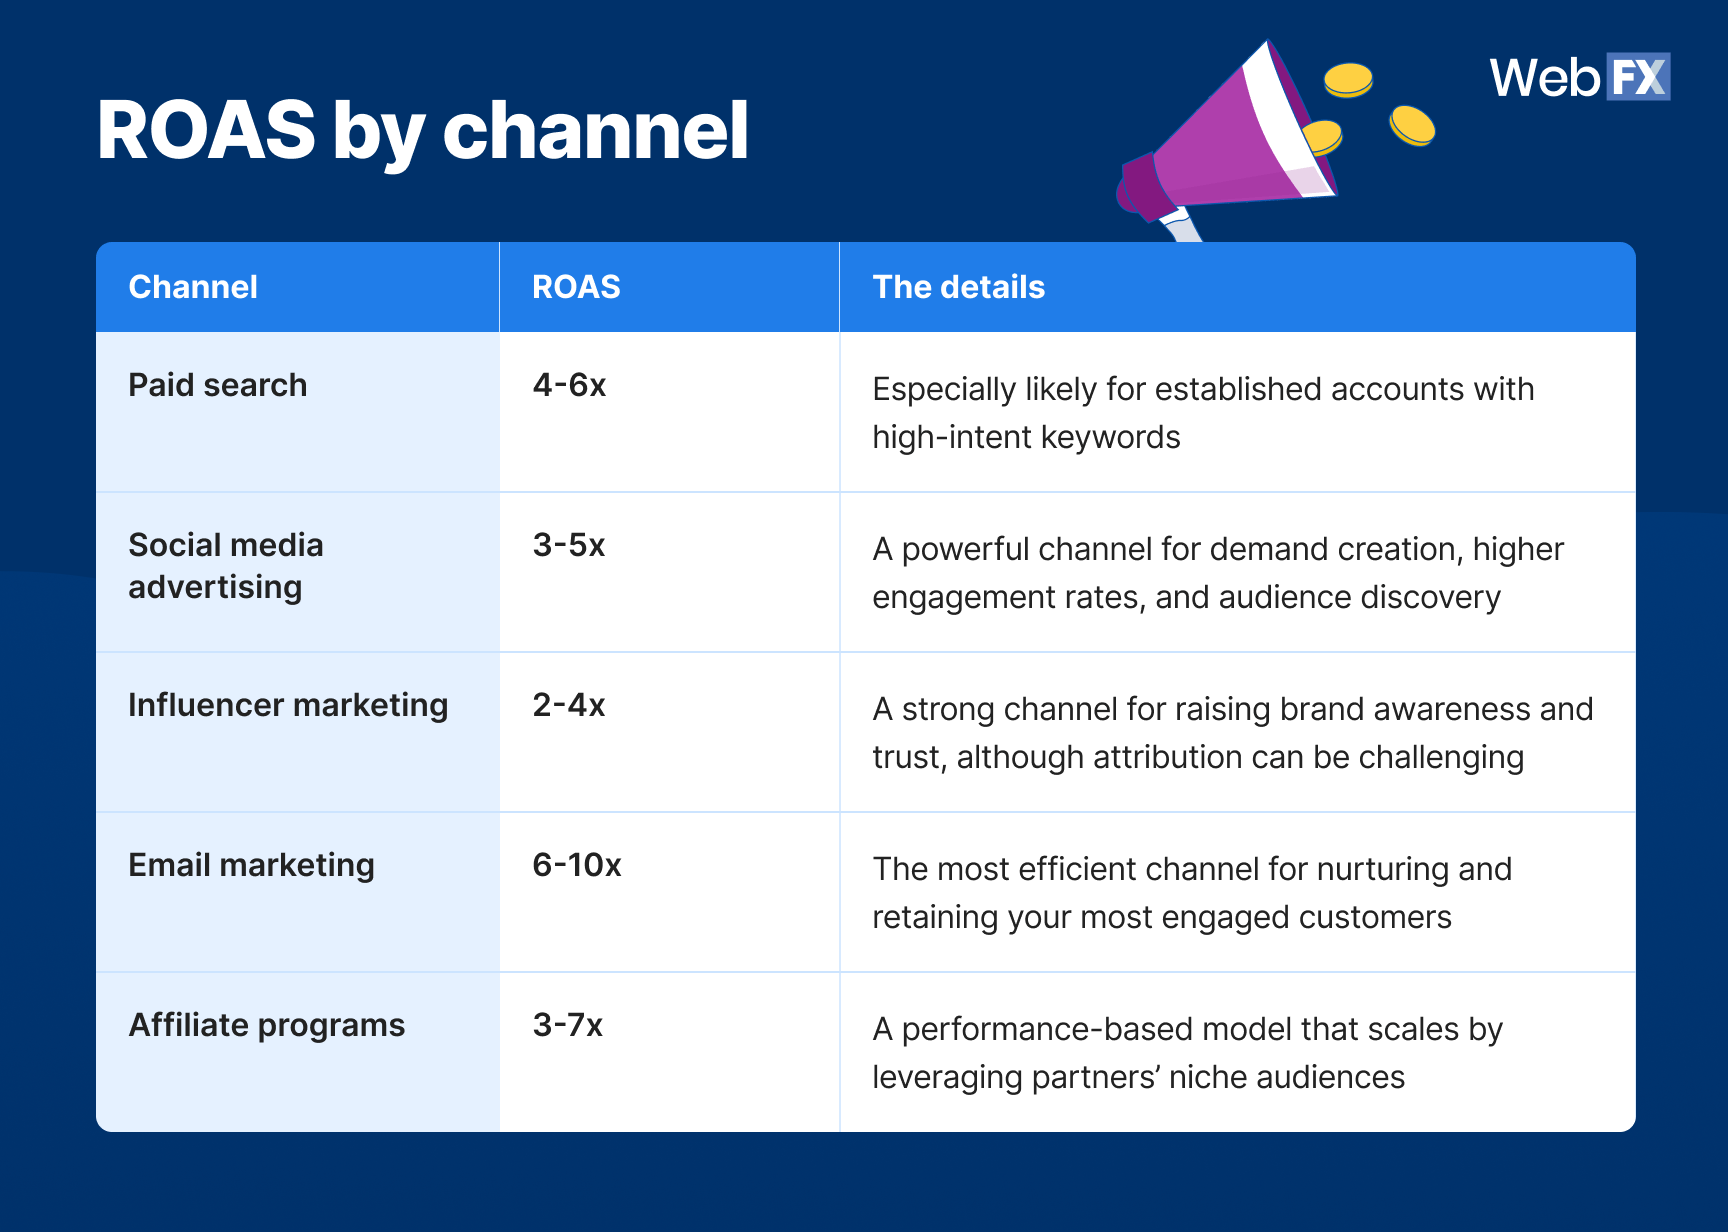
Table view
| Channel | ROAS | The details |
| Paid search | 4-6x | Especially likely for established accounts with high-intent keywords |
| Social media advertising | 3-5x | A powerful channel for demand creation, higher engagement rates, and audience discovery |
| Influencer marketing | 2-4x | A strong channel for raising brand awareness and trust, although attribution can be challenging |
| Email marketing | 6-10x | The most efficient channel for nurturing and retaining your most engaged customers |
| Affiliate programs | 3-7x | A performance-based model that scales by leveraging partners’ niche audiences |
Use this table as a guide for the performance you should demand from each channel to ensure your company is investing in the right areas.
The ROAS for influencer marketing is the lowest only because it is more challenging to track. For instance, a customer might see the influencer’s post, forget about it, and then search for your brand a week later. While the sale is not credited to the influencer, they still planted the seed.
In contrast, email marketing brings in the most ROAS because it costs significantly less than paying for clicks or paying influencers. You use email marketing to speak to your most engaged audience for pennies, making it an efficient channel for driving repeat purchases and profit.
3. Search and keyword benchmarks
While getting in front of customers costs money, not all clicks are created equal. You create a successful strategy by targeting the right keywords and understanding the competitive landscape.
Let’s start with keyword choice. Are you choosing keywords based on the goals of your strategies? For example, if you’re just starting out in the industry, you’d focus on educational keywords to show your thought leadership and grow your authority. If your goal is to find more B2B opportunities, you might focus on more keywords related to tools and services.
Here is a more detailed look at high-value ecommerce keyword categories:

Table view
| Keyword category | Monthly volume | Cost-per-click (CPC) range | Difficulty | Traffic potential | Strategic value |
| Platform branded | 1.14M+ | $1.80-$8.00 | 76-84 | 1.3M+ | Navigational dominance |
| Commercial intent | 36K-123K | $3.00-$5.00 | 49-72 | 576K+ | High conversion |
| Educational/training | 22K-74K | $0.25-$2.11 | 13-85 | 29K+ | Thought leadership |
| Tools and services | 4.5K-22K | $0.50-$6.00 | 57-91 | 4K-51K | B2B opportunity |
One of the interesting data points from our report’s keyword analysis is that commercial intent keywords are some of the best keywords to target for higher conversion rates. This category is also easier to target, with good traffic potential and monthly volume.
But have you ever wondered why it feels difficult to rank for ecommerce-related keywords? It’s because you’re not just competing with other stores — you’re competing with industry giants like Shopify and Amazon.
Our search data shows that Shopify has over 492,000 organic keyword rankings, with an estimated traffic value of $36.8 million. In fact, 64% of high-value keywords already have enterprise-level competition.
But here’s the secret — Shopify’s dominance is also your best source of free market research. Their multi-million-dollar strategy tells you exactly what topics are top-of-mind for ecommerce entrepreneurs right now.
The keyword “Pinterest affiliate marketing” in particular has grown 405% year-over-year to over 8,000 searches. This is a goldmine telling you to create strategies around this hot, emerging trend before it becomes saturated.
While giants dominate broad topics, they still leave gaps for B2B ecommerce businesses selling to ecommerce stores. Our analysis identified opportunity areas with low competition and high demand:
- Product photography services: The term has a high demand of 12,000 searches and a low difficulty score of 34, indicating little competition.
- Conversion rate optimization: Ecommerce stores are looking to work with providers that can improve their conversion rate. This is a growing topic with around 4,900 searches and moderate competition.
4. Real-world practitioner insights
We showed you the data, but what are actual ecommerce business owners saying? We went beyond the data to find out what’s actually working for ecommerce businesses right now.
Their insights from over 50 practitioner discussions revealed numerous proven strategies and failed experiments, enabling you to make informed decisions early on in your new strategy.
The content creation shift from AI to influencers
First, let’s talk about what ecommerce businesses are paying for. We saw two main trends — influencer marketing and AI applications.
Companies are paying influencers $100 per 30-second video, while an AI-generated alternative can cost as little as $50 per video. Many recommend a hybrid approach to content creation, using AI for 70% of content and human influencers for the remaining 30%.
Technology adoptions
Practitioners are rapidly adopting tools that streamline operations. Automated bidding on Meta and Google has an 85% adoption rate, while creative apps like Canva and CapCut are used by 67% of businesses. 73% of community members are also actively using native Shopify AI features.
Additionally, emerging tools include voice-to-video content generation tools and Google Opal for no-code AI applications.
The data shows a preference for tools that help streamline the content creation process. Your business can gain a competitive edge by testing emerging tools to get ahead of the game.
Operational hurdles
But what about the current operational pressures for ecommerce businesses? Here’s a look at the top challenges brands are facing in today’s landscape:
- Logistical overload: Many owners spend 60%-70% of their time on logistics instead of activities that actually grow the business, such as marketing and strategy. This has created a need to work with outsourced teams to manage the tasks they do not have time to handle.
- Chargeback management: Customer-initiated transaction reversals are especially an issue for new-to-platform sellers. For this reason, chargeback management has become an immediate need to prevent revenue loss.
- Regulatory compliance: The European Union’s Digital Services Act (DSA) now requires sellers to verify their businesses and suppliers in order to sell items on platforms like Amazon, Google, and Meta. If you’re selling internationally or looking to scale, you’ll need to make EU DSA compliance protocols an immediate investment priority.
Budget allocation best practices
Your spending should align with your company’s growth stage. Our analysis revealed that startups should prioritize performance marketing for immediate ROI, while scaled businesses have the flexibility to invest more in brand marketing.
Here’s the data on how ecommerce businesses at specific growth phases spend their revenue.
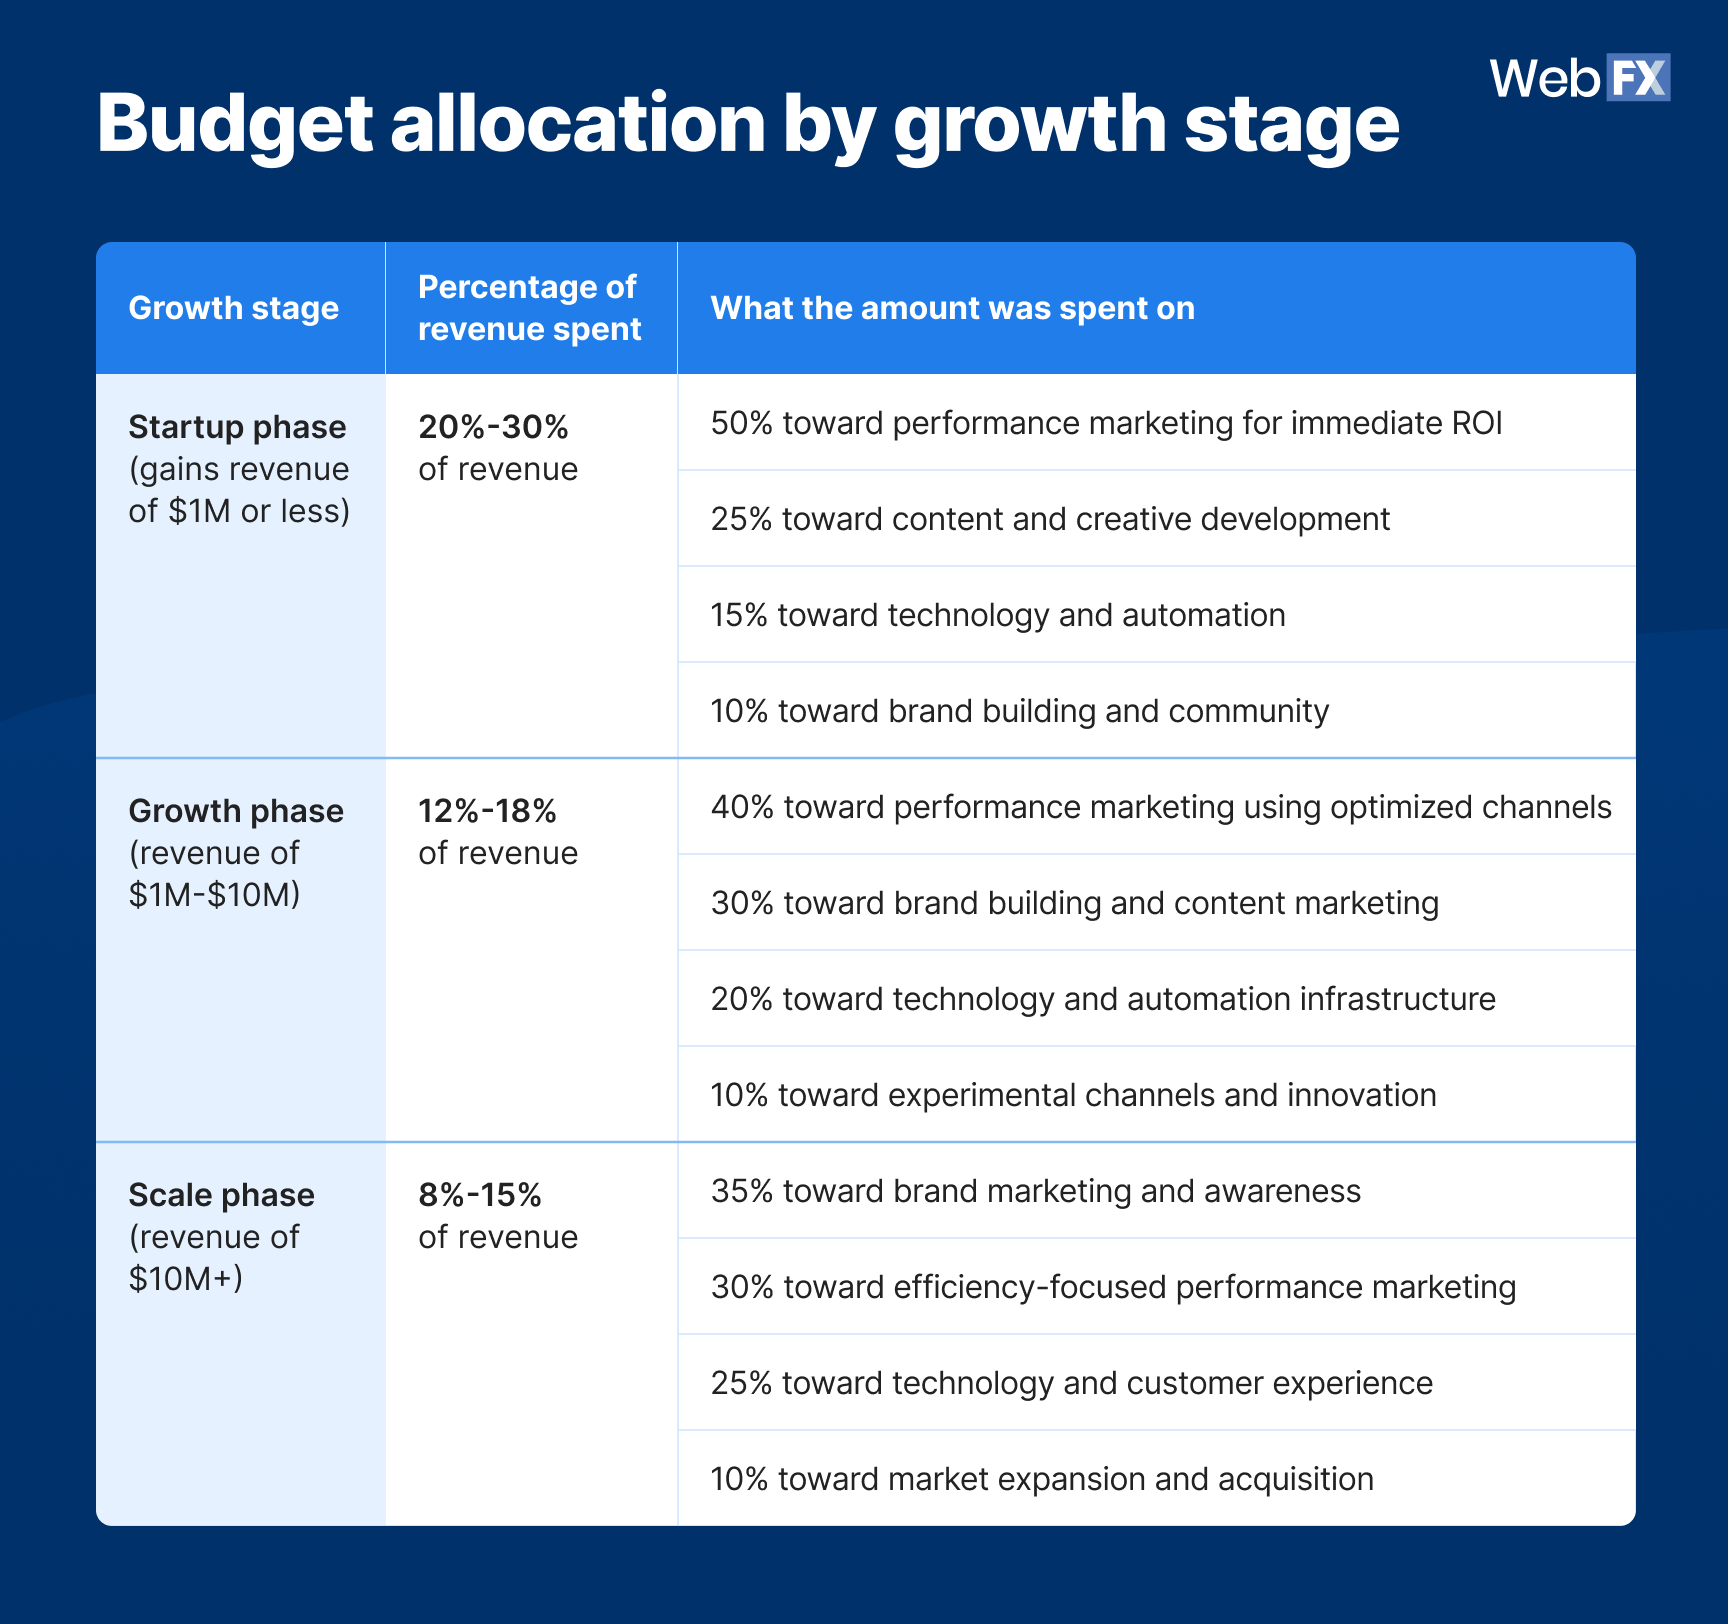
Budget allocation by growth stageTable view
Growth stage
Percentage of revenue spent
What the amount was spent on
Startup phase (gains revenue of $1M or less)
20%-30% of revenue
50% toward performance marketing for immediate ROI
25% toward content and creative development
15% toward technology and automation
10% toward brand building and community
Growth phase (revenue of $1M-$10M)
12%-18% of revenue
40% toward performance marketing using optimized channels
30% toward brand building and content marketing
20% toward technology and automation infrastructure
10% toward experimental channels and innovation
Scale phase (revenue of $10M+)
8%-15% of revenue
35% toward brand marketing and awareness
30% toward efficiency-focused performance marketing
25% toward technology and customer experience
10% toward market expansion and acquisition
Your action plan: How to improve ecommerce performance
Based on these benchmarks, we’ve identified the strategic actions your ecommerce business can take to improve performance.
Immediate actions (0-3 months)
- Establish your baseline: Use the cost and ROAS tables in this report to set realistic baseline metrics for your specific vertical and business model. This will help you optimize costs.
- Optimize your content mix: Audit your influencer spend against its actual performance. If the performance doesn’t measure up, consider implementing the 70/30 AI/human content mix to effectively lower costs while maintaining an authentic voice.
- Shift to performance-based partnerships: Move away from flat-fee arrangements. Instead, test performance-based affiliate partnership models for your influencer and creator relationships to ensure you only pay for results.
- Target the gaps: Focus your SEO and content efforts on low-competition, high-intent keywords. Our report shows that product photography and CRO education are major opportunity areas.
- Build your owned channels: Prioritize building your email and SMS lists by offering valuable gated content, a simple checkbox in the checkout process, or providing an immediate incentive in exchange for their email address or phone number. These are your highest ROI channels that third-party platforms can’t take away from you.
Medium-term investments (3-12 months)
- Invest in automation: Build out your AI-assisted content production capabilities to streamline your marketing strategy. Implementing marketing automation will enhance lead nurturing and automate routine fulfillment and customer service processes, reducing operational overhead and improving margins.
- Build authority with content: Establish your category authority through educational content marketing. Using this strategy will allow you to attract high-intent users at a lower CPC than purely commercial keywords.
- Integrate your analytics: Implement cross-platform inventory and analytics integration to get an accurate, unified view of how all your channels are performing together.
Long-term strategies (12+ months)
- Expand your market footprint: Strategically grow beyond your current core business by expanding into new regions or countries, introducing new product types, and establishing new logistics and supplier relationships.
- Develop strategic assets: Build a competitive moat to make it difficult for competitors to copy you. This could involve building your own software tools, creating a subscription, or developing a marketplace platform in your niche.
- Solidify thought leadership: Go beyond content marketing to establish your brand as an industry leader. This can involve publishing original, data-driven industry reports, acquiring complementary businesses that strengthen your brand portfolio, and establishing your company’s leaders as the most trusted industry voices.
FAQ: Ecommerce marketing benchmarks
What are ecommerce marketing benchmarks?
Ecommerce marketing benchmarks are key metrics and performance standards that help your business measure success against industry averages and competitors.
You can use them to add context to your company’s performance, reveal areas for improvement, and set more realistic goals.
What are the most important ecommerce KPIs to track?
The most important key performance indicators (KPIs) to track in ecommerce include:
- Cost per lead (CPL)
- Customer acquisition cost (CAC)
- Return on ad spend (ROAS)
Keeping track of these metrics will allow you to determine how well your ecommerce business is performing compared to the industry average.
What qualifies as good ecommerce marketing performance?
Good ecommerce marketing performance is when your company’s metrics meet or exceed the specific ROAS targets for your business model and marketing channels.
Good performance for the various ecommerce business models includes:
- Marketplace Seller: 4:1+ ROAS
- Direct-to-Consumer (DTC): 3:1+ ROAS
- B2B Ecommerce: 5:1+ ROAS
- Luxury/Premium: 6:1+ ROAS
Good performance for the different marketing channels includes:
- Paid Search: 4-6x ROAS
- Social Media Advertising: 3-5x ROAS
- Influencer marketing: 2-4x ROAS
- Email Marketing: 6-10x ROAS
- Affiliate Programs: 3-7x ROAS
What are the average email marketing benchmarks for ecommerce?
One of the most notable email marketing benchmarks for ecommerce companies is an ROAS of 6-10x.
You can reach this benchmark by building an email list of your most engaged customers and using your email campaign to announce new products, run exclusive sales, and recover abandoned carts.
What are the typical social media marketing benchmarks for ecommerce businesses?
For social media advertising, the typical ecommerce benchmark is an ROAS of 3-5x.
You can achieve this benchmark by strategically using the channel to discover new audiences based on their interests, demographics, and online behavior. You should then get relevant social media content and ads in front of them with compelling video content and images. For a more granular breakdown of these metrics across Facebook and Instagram, see our Meta marketing benchmarks guide.
How can I improve my ecommerce conversion rate to exceed benchmarks?
To improve your company’s performance and exceed industry benchmarks, you need to establish your baseline. Compare your company’s current metrics, such as CAC and ROAS, against the channel and industry vertical averages in this benchmarks report.
This enables you to identify your biggest opportunities for improvement and form an actionable strategy. Once you know where you stand, focus your efforts on the most impactful areas:
- High ROI channels: Prioritize building your owned channels, such as email and SMS lists, to nurture your most engaged customers.
- Content and partner spend: To lower costs without sacrificing an authentic voice, consider implementing the 70/30 AI-to-human content mix and shifting influencer collaborations to performance-based affiliate models.
- Strategic SEO gaps: Focus your content on low-competition, high-demand topics to attract high-intent users at a lower cost.
Maximize your company’s performance with WebFX
To drive results in ecommerce in 2026, you need to aim for the right benchmarks based on your company’s needs, goals, and current performance.
Working with a digital marketing company like WebFX can help you drive those results. Our team of experts has worked 179,000+ hours in retail ecommerce and driven over $10 billion in revenue for clients.
Learn more about our ecommerce marketing services or contact an expert to hear more about how our team can help you reach key ecommerce benchmarks.
Data sources and methodology
This report combines proprietary performance data with advanced competitive intelligence and real-world practitioner insights to provide a comprehensive analysis of ecommerce marketing benchmarks. We compiled these benchmarks using:
- Proprietary cost data: We analyzed nine e-commerce verticals with verified B2B/B2C cost per lead, customer acquisition costs, and performance metrics representing over $50 million in annual marketing spend.
- Search intelligence: We conducted a comprehensive search analysis using Ahrefs and DataForSEO.
- Community research: We analyzed 50+ recent discussions from r/ecommerce, r/marketing covering cost pressures, technology adoption, and strategic challenges affecting businesses from startup to $10M+ revenue.
- Competitive intelligence: We conducted a deep analysis of platform dominance patterns, keyword economics, and market positioning strategies across consumer and business e-commerce segments.
The data primarily represents North American markets, and the luxury segment sample size is limited. The international regulatory impacts mentioned are also based on the EU DSA’s early enforcement patterns.
-
 Thaakirah Abrahams is a Marketing Editor at WebFX, where she leverages her years of experience to craft compelling website content. With a background in Journalism and Media studies and certifications in inbound marketing, she holds a keen eye for detail and a talent for breaking down complex topics for numerous sectors, including the legal and finance industries. When she’s not writing or optimizing content, Thaakirah enjoys the simple pleasures of reading in her garden and spending quality time with her family during game nights.
 -

WebFX is a full-service marketing agency with 1,100+ client reviews and a 4.9-star rating on Clutch! Find out how our expert team and revenue-accelerating tech can drive results for you! Learn more
Try our free Marketing Calculator
Craft a tailored online marketing strategy! Utilize our free Internet marketing calculator for a custom plan based on your location, reach, timeframe, and budget.
Plan Your Marketing Budget
Share this article

Proven Marketing Strategies
Try our free Marketing Calculator
Craft a tailored online marketing strategy! Utilize our free Internet marketing calculator for a custom plan based on your location, reach, timeframe, and budget.
Plan Your Marketing Budget
What to read next