How Much Does Social Media Advertising Cost in 2024?
Methodology: We asked 270 US-based marketers to share how much they spend on social media advertising.
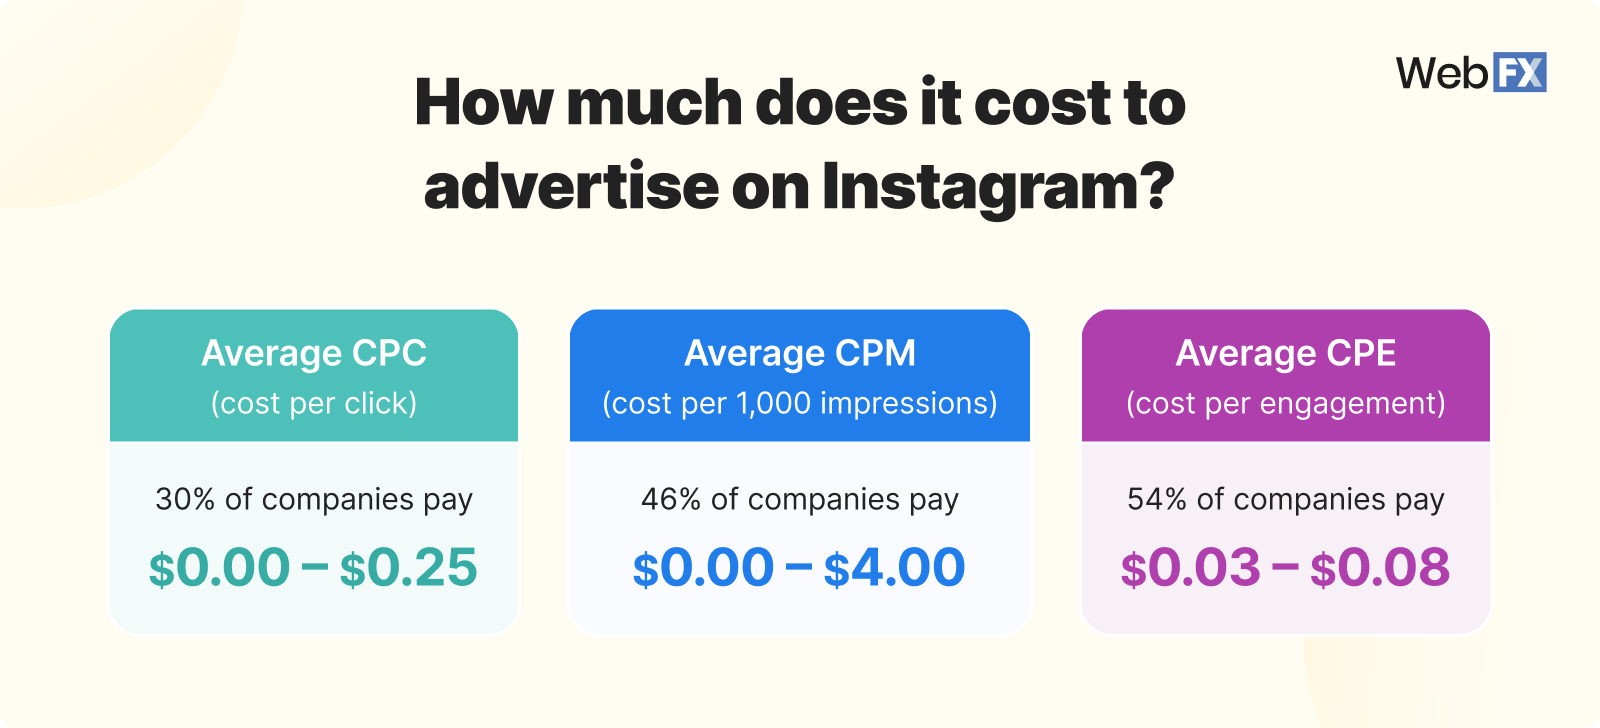
How much social media advertising costs will vary greatly depending on your chosen platform. You can usually expect to pay around $0 – $4 per action on Instagram ads, $0 – $5 per action on Facebook ads, $0.26 – $8 per action on LinkedIn ads, $0 – $2 per action on Pinterest ads, $0.31 – $0.40 per view on YouTube ads, $0.26 – $2.00 per action on Twitter ads.
Social media advertising costs in 2024
How much does social media advertising cost?
That answer depends on the social media network, which is why this guide looks at social media advertising costs by platform, as well as bid type.
This guide features a helpful breakdown of bid types, like cost-per-click (CPC), straight from US-based marketing professionals who advertise on the platforms every day to give your business the information it needs to build an accurate ad budget.
If you’re looking for professional help with your social media advertising campaign, our award-winning team of more than 500 digital marketing specialists can help. With our custom strategies, as well as advanced artificial intelligence (AI) software, we can maximize the results of your ad campaign.
Tell us about your business by contacting us online or calling us at 888-601-5359!
Ready to Grow? Get your FREE Quote Today!
“We measure our success by how much we WOW our clients.”
Bill Craig
WebFX President
Social Media Advertising Cost FAQs
Looking for more about how much social media ads cost? Check out these FAQs on the cost of advertising on social media:
What is the average cost of social media advertising?
The cost of social media advertising depends on many factors, including platform. Depending on which platforms you’re advertising on, you can usually expect to pay on average:
- $0 – $4 per action on Instagram ads
- $0 – $5 per action on Facebook ads
- $0.26 – $8 per action on LinkedIn ads
- $0 – $2 per action on Pinterest ads
- $0.31 – $0.40 per view on YouTube ads
- $0.26 – $2.00 per action on Twitter ads
What is the average overall cost of social media advertising?
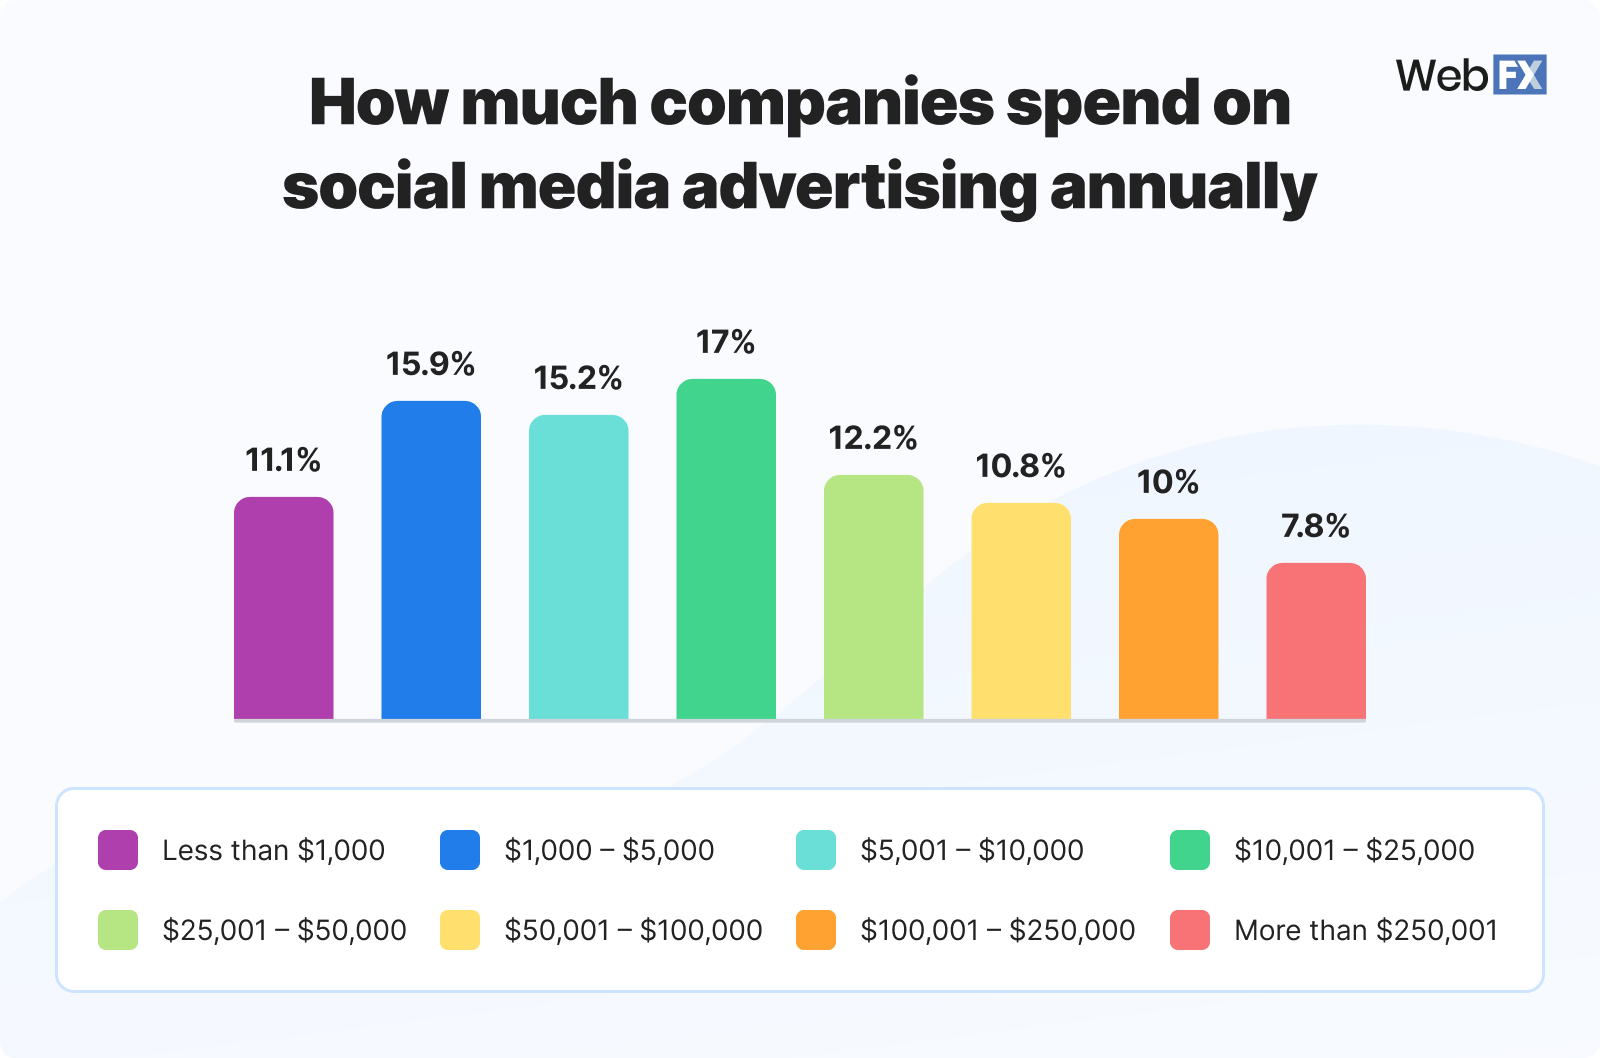
The average cost of social media advertising ranges from $1000 – $25,000 per year. This amount includes advertising on multiple networks, as well as expenses related to technology, talent, and professional management.
For professional social media advertising services, prices range from $850 to $2750 per month. This rate does not include ad spend. Agencies like WebFX, however, recommend an ad spend of $200 to $1000 or more to maximize the results and performance of your campaign.
How does social media ad pricing work?
With social media pricing, there are several factors to consider, including:
- Ad spend: Your ad spend is how much you pay to each social media platform. For example, you may have an advertising budget of $800, which includes a $500 ad spend. The remaining $300 goes to other social media advertising costs, like hiring a freelance graphic designer.
- Ad management: Your ad management generally refers to what you pay an agency to manage your social media advertising campaign. This cost is optional. Agencies, however, can offer significant value in the quality and performance of your ad strategy.
- Technology: Your technology is what you spend on software for managing and monitoring your social media ad campaign. Companies often use free and paid applications. In some cases, your agency, like WebFX, provides you access to exclusive and advanced marketing software.
- Talent: Your talent can include in-house and outsourced labor. For example, your team may hire a freelance copywriter to develop your ad copy. Or, you may hire a social media agency to lead and manage your campaign.
It’s also worth mentioning that social media pricing can include marketing and advertising costs.
What’s the difference between a social media advertising budget and bid?
To understand the difference between a budget and a bid, you need to know ad hierarchy.
When you advertise online, you have your campaign, which includes a set of ad groups. Each ad group contains ads. For example, you may have a campaign for red shoes, with an ad group for red sneakers and an ad group for red heels.
Now, when you create a campaign for social media, you set a budget. A budget is what you’re willing to spend each month on your campaign. In some cases, you may not use your entire monthly budget, due to campaign performance.

Once you determine your campaign budget, as well as build your ad groups, you set your bids. A bid is what you’re willing to pay for a user to complete an action on your ad, like following your page or viewing your video.
Keep in mind that your company doesn’t always pay your full bid amount.
Depending on the quality of your ad, as well as additional factors, you may pay less — you will never pay more than your bid. That’s why companies try to achieve high ad quality scores because it can help maximize their social media advertising costs.
What are the different social media ad bidding options?
When you advertise on social media, you have access to several bidding options, including:
- Cost-per-click (CPC): You pay every time someone clicks on your ad.
- Cost-per-impressions (CPM): You pay for every 1000 ad impressions or views.
A few bidding options specific to different platforms include:
- Cost-per-like (CPL): You pay for every Facebook like resulting from your ad.
- Cost-per-action (CPA): You pay for every action generated from your Facebook ad.
YouTube
- Cost-per-view (CPV): You pay for every view on your YouTube ad.
- Cost-per-send (CPS): You pay for every LinkedIn Sponsored mail sent.
- Cost-per-open (CPO): You pay for every LinkedIn Sponsored mail opened.
- Cost-per-engagement (CPE): You pay for every Twitter ad
- Cost-per-follow (CPF): You pay for every follower resulting from your Twitter ad.
- Cost-per-download (CPD): You pay for every download generated from your Twitter ad.
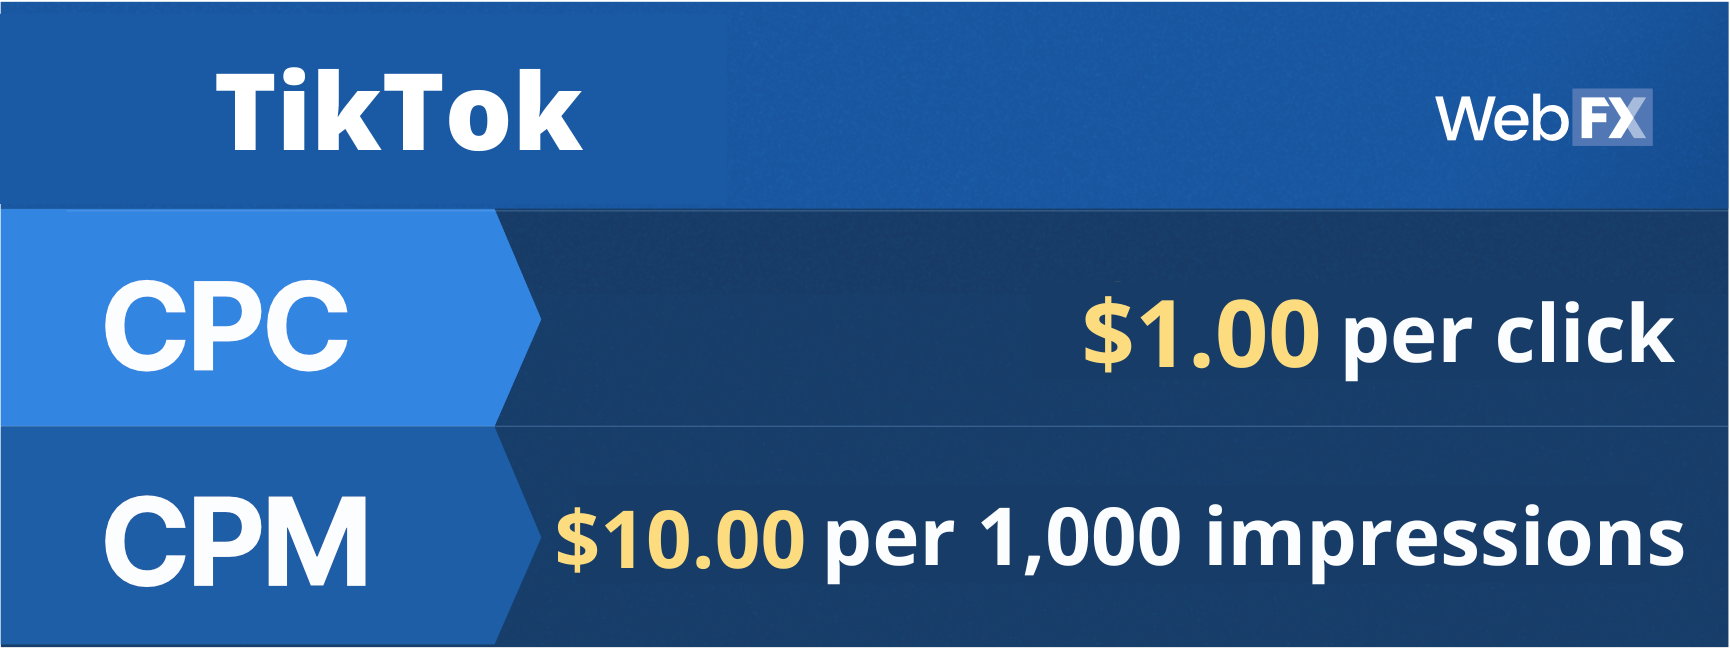
TikTok
- Optimized CPM (oCPM): You pay for every 1000 impressions, but oCPM targets users most likely to complete a conversion or similar advertising goal.
- Cost-per-thousand views (CPV): You pay for every 1000 video views. Your views can be either 2-second or 6-second views.
How much of your advertising budget should you allocate to social media ads?
Most businesses typically allocate 5% – 40% of their overall advertising budget to social media ads (63% of respondents). How much you allocate to social media ads will depend on your company’s unique needs and goals, as well as the return you receive from your ad campaign.

Why do companies advertise on social media?
The majority of businesses advertise on social media to build brand awareness (39% of respondents) and drive sales (31% of respondents). While 17% of businesses use social media ads to generate leads while 12% of businesses advertise on social media to drive web traffic.

Is advertising on social media worth the cost?
Yes! In fact, 74% of businesses say that social media advertising is effective. With the right campaign, ad creatives, and audience targeting, you can drive a positive return from social media ads to drive more revenue for your business.

Wondering how happy businesses are with the ROI they receive from different social media platforms? Check out the graphic below:

WebFX social media advertising prices
Want to work with one of the best social media advertising agencies? Check out our prices!
| Features | Pro | Enterprise |
|---|---|---|
| Included Networks | ||
| Number of additional networks included | Pick up to 2 in addition to AdTechFX programmatic campaigns | Pick up to 3 in addition to AdTechFX programmatic campaigns |
| Facebook Advertising Campaigns | ||
| Instagram Advertising Campaigns | ||
| LinkedIn Advertising Campaigns | ||
| Twitter Advertising Campaigns | ||
| TikTok Advertising Campaigns | Available with Ongoing FuelFX Assets | Available with Ongoing FuelFX Assets |
| Pinterest Advertising Campaigns | Available with Ongoing FuelFX Assets | |
| AdTechFX Programmtic Channel | Access Included | Access Included |
| Management Deliverables | ||
| Dedicated Social Media advertising account manager | ||
| 500+ SMEs behind campaign driving results | ||
| Initial campaign strategy development | ||
| Number of advertising campaigns | Up to 8 | Up to 10 |
| Audience analysis | ||
| Ad campaign copywriting | ||
| Ad copy and design performance testing | ||
| Ongoing campaign testing and optimization | ||
| Dynamic ad format testing | ||
| Consultations per month | Up to 2 | Up to 4 |
| International campaign management (networks dependent on international policy – addtl. fees may apply) | Upon request | |
| All social assets managed through client-owned accounts | ||
| Monitoring clicks, conversions and fraud activity | ||
| Monitoring of social ad comments | Add $300/month | Add $600/month |
| Social Platform Targeting Capabilities (Specifics Vary By Platform) | ||
| – Interests | ||
| – Demographics | ||
| – Professional Characteristics | ||
| – Custom Audiences | ||
| – Lookalike Audiences | ||
| AdTechFX Programmatic Targeting Capabilities | ||
| – 3rd Party Audience Targeting | ||
| – Account-Based Retargeting | ||
| – CRM Pipeline Retargeting | ||
| Social Platform Creative Deliverables | ||
| Social Ad Creatives – Copywriting & Design | Up to 2 sets | Up to 4 sets |
| AdTechFX Programmatic Creative Deliverables | ||
| Display Ad Creatives (One Time) | One Time: Up to 2 sets of rapid display creatives – 16 ads total (8 per set) | One Time: Up to 3 Sets of Custom Layout Display Ads – 24 Ads Total (8 images per set) |
| Connected TV Commercial Ads (One Time) | One Time: 1 15-second rapid ConnectedTV ad | One Time: 1 Set of Rapid CTV Ads 15 + 30 Seconds (2 videos total) |
| Ongoing AdTechFX Programmatic Advertising Creative | Add 1 FuelFX Asset | Add 1 FuelFX Asset |
| Audio Commercial | Coming Soon | Coming Soon |
| FunnelsFX Landing Pages | ||
| Setup of 1 FunnelsFX Landing Page template (One Time) | ||
| Performance Reporting | ||
| Monthly performance & analysis reporting | ||
| Website conversion analysis reporting | ||
| IntegrationsFX: Conversion Based Smart Bidding | Included with MarketingCloudFX License | Included with MarketingCloudFX License |
| IntegrationsFX: Automated Lookalike + Custom Audiences | Included with MarketingCloudFX License | Included with MarketingCloudFX License |
| Initial Campaign Investment (Month 1) | $1,975 | $4,250 |
| Ongoing Monthly Campaign Investment (Months 2+) | $975 or 15% of ad spend, whichever is greater | $4,500 or 12% of ad spend, whichever is greater |
| Required Ad Spend Range | $1,000 – $30,000 | $30,000+ |
Want better results from your social media ad campaign?
If you’re looking for a performance-driven campaign that provides your business with actual, tangible results, choose WebFX. Our advertising agency has decades of experience, custom strategies, and a team of more than 500 digital marketing specialists, we can help your business improve its brand awareness and more.
Discover how we can grow your company by contacting us online or calling us at 888-601-5359 today!
Source data
Why companies advertise on social media
| WHY ADVERTISE ON SOCIAL MEDIA | % OF MARKETERS |
| To build awareness | 39.26% |
| To generate leads | 17.41% |
| To drive sales | 31.11% |
| To increase website traffic | 12.22% |
Social media advertising cost per year
| COST PER YEAR | % OF MARKETERS |
| Less than $1000 | 11.11% |
| $1000 – $5000 | 15.93% |
| $5001 – $10,000 | 15.19% |
| $10,001 – $25,000 | 17.04% |
| $25,001 – $50,000 | 12.22% |
| $50,001 – $100,000 | 10.74% |
| $100,001 – $250,000 | 10.00% |
| More than $250,000 | 7.78% |
Percentage of advertising budget allocated to social media advertising
| % OF ADVERTISING BUDGET ALLOCATED TO SOCIAL MEDIA ADS | % OF MARKETERS |
| Less than 5% | 11.11% |
| 5% – 10% | 19.63% |
| 11% – 25% | 27.04% |
| 26% – 40% | 17.04% |
| 41% – 60% | 11.11% |
| 61% – 75% | 9.26% |
| More than 76% | 4.81% |
Effectiveness of social media advertising
| EFFECTIVENESS OF SOCIAL MEDIA ADVERTISING | % OF MARKETERS |
| Very effective | 37.78% |
| Somewhat effective | 37.04% |
| Not very effective | 13.70% |
| Not effective at all | 11.48% |
Monthly Facebook advertising costs
| MONTHLY FACEBOOK ADVERTISING COST | % OF MARKETERS |
| $0.00 | 10.11% |
| $1.00 – $50.00 | 13.48% |
| $51.00 – $100.00 | 20.79% |
| $101.00 – $500.00 | 28.65% |
| $501.00 – $1,000.00 | 12.92% |
| $1,001.00 – $3,000.00 | 7.30% |
| Over $3,000.00 | 6.74% |
Facebook advertising costs per click
| COST PER CLICK | % OF MARKETERS |
| $0.00 – $0.25 | 18.95% |
| $0.26 – $0.50 | 22.11% |
| $0.51 – $1.00 | 17.89% |
| $1.01 – $1.50 | 9.47% |
| $1.51 – $2.00 | 8.42% |
| $2.01 – $2.50 | 7.37% |
| $2.51 – $3.00 | 3.16% |
| $3.01 – $3.51 | 7.37% |
| $3.51 – $4.00 | 1.05% |
| More than $4.00 | 4.21% |
Facebook advertising costs per 1000 impressions
| COST PER 1000 IMPRESSIONS | % OF MARKETERS |
| $0.00 – $1.00 | 9.30% |
| $1.01 – $3.00 | 26.74% |
| $3.01 – $5.00 | 22.09% |
| $5.01 – $7.00 | 9.30% |
| $7.01 – $10.00 | 10.47% |
| $10.01 – $13.00 | 8.14% |
| $13.01 – $16.00 | 6.98% |
| $16.01 – $20.00 | 2.33% |
| More than $20.00 | 4.65% |
Facebook advertising costs per like
| COST PER LIKE | % OF MARKETERS |
| $0.00 – $0.25 | 23.75% |
| $0.26 – $0.50% | 13.75% |
| $0.51 – $0.75% | 12.50% |
| $0.76 – $1.00 | 12.50% |
| $1.01 – $1.25 | 7.50% |
| $1.26 – $1.50 | 10.00% |
| $1.51 – $2.00 | 5.00% |
| $2.01 – $2.50 | 8.75% |
| More than $2.50 | 6.25% |
Facebook advertising costs per download
| COST PER DOWNLOAD | % OF MARKETERS |
| $0.00 – $1.00 | 19.15% |
| $1.01 – $2.00 | 12.77% |
| $2.01 – $3.00 | 8.51% |
| $3.01 – $4.00 | 12.77% |
| $4.01 – $5.00 | 19.15% |
| $5.01 – $6.00 | 8.51% |
| $6.01 – $8.00 | 8.51% |
| $8.01 – $10.00 | 8.51% |
| More than $10.00 | 2.13% |
Percentage of advertising budget allocated to Facebook ads
| PERCENTAGE OF OVERALL ADVERTISING BUDGET | % OF MARKETERS |
| 0% – 5% | 19.10% |
| 6% – 10% | 16.29% |
| 11% – 15% | 17.98% |
| 16% – 20% | 15.73% |
| 21% – 30% | 11.80% |
| 31% – 40% | 4.49% |
| 41% – 50% | 5.06% |
| 51% – 60% | 5.62% |
| 61% – 70% | 2.25% |
| 71% or more | 1.69% |
ROI satisfaction from Facebook ads
| SATISFIED WITH FACEBOOK ROI | % OF MARKETERS |
| Yes | 81% |
| No | 19% |
Monthly Instagram advertising costs
| MONTHLY INSTAGRAM ADVERTISING COST | % OF MARKETERS |
| $0.00 – $100.00 | 23.03% |
| $101.00 – $500.00 | 30.26% |
| $501.00 – $1000.00 | 21.05% |
| $1001.00 – $5000.00 | 14.47% |
| $5001.00 – $10,000.00 | 6.58% |
| More than $10,000.00 | 4.61% |
Instagram advertising costs per click
| COST PER CLICK | % OF MARKETERS |
| $0.00 – $0.25 | 30.34% |
| $0.26 – $0.50 | 19.10% |
| $0.51% – $0.75% | 10.11% |
| $0.76% – $1.00 | 8.99% |
| $1.01 – $1.50 | 5.62% |
| $1.51 – $2.00 | 6.74% |
| $2.01 – $2.50 | 4.49% |
| $2.51 – $3.00 | 7.87% |
| More than $3.00 | 6.74% |
Instagram advertising costs per 1000 impressions
| COST PER 1000 IMPRESSIONS | % OF MARKETERS |
| $0.00 – $2.00 | 23.40% |
| $2.01 – $4.00 | 23.40% |
| $4.01 – $6.00 | 19.15% |
| $6.01 – $8.00 | 18.09% |
| $8.01 – $10.00 | 5.32% |
| More than $10.00 | 10.64% |
Instagram advertising costs per engagement
| COST PER ENGAGEMENT | % OF MARKETERS |
| $0.00 – $0.02 | 10.61% |
| $0.03 – $0.05 | 27.27% |
| $0.06 – $0.08 | 27.27% |
| $0.09 – $0.11 | 15.15% |
| More than $0.11 | 19.70% |
Percentage of advertising budget allocated to Instagram ads
| PERCENTAGE OF OVERALL ADVERTISING BUDGET | % OF MARKETERS |
| 0% – 5% | 15.13% |
| 6% – 10% | 16.45% |
| 11% – 20% | 18.42% |
| 21% – 30% | 14.47% |
| 31% – 40% | 9.87% |
| 41% – 50% | 5.92% |
| 51% – 60% | 7.89% |
| 61% – 70% | 3.29% |
| 71% – 80% | 5.26% |
| More than 80% | 3.29% |
ROI satisfaction from Instagram ads
| SATISFIED WITH INSTAGRAM ADVERTISING ROI | % OF MARKETERS |
| Yes | 76% |
| No | 24% |
Monthly LinkedIn advertising costs
| MONTHLY LINKEDIN ADVERTISING COST | % OF MARKETERS |
| $0.00 – $100.00 | 25.00% |
| $101.00 – $500.00 | 23.08% |
| $501.00 – $1000.00 | 18.27% |
| $1001.00 – $5000.00 | 16.35% |
| $5001.00 – $10,000.00 | 7.69% |
| More than $10,000.00 | 9.62% |
LinkedIn advertising costs per click
| COST PER CLICK | % OF MARKETERS |
| $2.00 – $3.00 | 29.85% |
| $3.01 – $4.00 | 19.40% |
| $4.01 – $5.00 | 10.45% |
| $5.01 – $6.00 | 7.46% |
| $6.01 – $7.00 | 10.45% |
| $7.01 – $8.00 | 4.48% |
| $8.01 – $10.00 | 4.48% |
| $10.01 – $15.00 | 5.97% |
| More than $15.00 | 7.46% |
LinkedIn advertising costs per 1000 impressions
| COST PER 1000 IMPRESSIONS | % OF MARKETERS |
| $0.00 – $3.00 | 16.39% |
| $3.01 – $5.00 | 14.75% |
| $5.01 – $8.00 | 18.03% |
| $8.01 – $10.00 | 14.75% |
| $10.01 – $15.00 | 4.92% |
| $15.01 – $20.00 | 4.92% |
| $20.01 – $30.00 | 11.48% |
| $30.01 – $40.00 | 3.28% |
| $40.01 – $50.00 | 3.28% |
| More than $50.00 | 8.20% |
LinkedIn advertising costs per send for Sponsored InMail campaigns
| COST PER SEND | % OF MARKETERS |
| $0.00 – $0.25 | 5.36% |
| $0.26 – $0.50 | 25.00% |
| $0.51 – $0.75 | 16.07% |
| $0.76 – $1.00 | 5.36% |
| $1.01 – $1.25 | 10.71% |
| $1.26 – $1.50 | 3.57% |
| $1.51 – $1.75 | 8.93% |
| $1.76 – $2.00 | 10.71% |
| $2.01 – $3.00 | 5.36% |
| More than $3.00 | 8.93% |
Percentage of advertising budget allocated to LinkedIn advertising
| % OF OVERALL ADVERTISING BUDGET | % OF MARKETERS |
| 0% – 5% | 19.23% |
| 6% – 10% | 18.27% |
| 11% – 20% | 20.19% |
| 21% – 30% | 7.69% |
| 31% – 40% | 4.81% |
| 41% – 50% | 7.69% |
| 51% – 60% | 5.77% |
| 61% – 70% | 2.88% |
| 71% – 80% | 6.73% |
| More than 80% | 6.73% |
ROI satisfaction from LinkedIn advertising
| SATISFIED WITH LINKEDIN ADVERTISING ROI | % OF MARKETERS |
| Yes | 57% |
| No | 43% |
Monthly Pinterest advertising costs
| MONTHLY PINTEREST ADVERTISING COST | % OF MARKETERS |
| $0.00 – $100.00 | 37.70% |
| $101.00 – $500.00 | 22.13% |
| $501.00 – $1000.00 | 13.11% |
| $1001.00 – $5000.00 | 7.38% |
| $5001.00 – $10,000.00 | 9.02% |
| More than $10,000.00 | 10.66% |
Pinterest advertising costs per click
| COST PER CLICK | % OF MARKETERS |
| $0.00 – $0.10 | 25.93% |
| $0.11 – $0.20 | 17.28% |
| $0.21 – $0.30 | 6.17% |
| $0.31 – $0.50 | 9.88% |
| $0.51 – $1.00 | 11.11% |
| $1.01 – $1.50 | 8.64% |
| $1.51 – $2.00 | 3.70% |
| $2.01 – $3.00 | 6.17% |
| More than $3.00 | 11.11% |
Pinterest advertising costs per 1000 impressions
| COST PER 1000 IMPRESSIONS | % OF MARKETERS |
| $0.00 – $0.50 | 18.84% |
| $0.51 – $1.00 | 14.49% |
| $1.01 – $1.50 | 18.84% |
| $1.51 – $2.00 | 14.49% |
| $2.01 – $3.00 | 10.14% |
| $3.01 – $4.00 | 4.35% |
| $4.01 – $5.00 | 2.90% |
| $5.01 – $7.00 | 5.80% |
| $7.01 – $9.00 | 8.70% |
| More than $9.00 | 1.45% |
Pinterest advertising costs per conversion
| COST PER CONVERSION | % OF MARKETERS |
| $0.00 – $2.00 | 27.42% |
| $2.01 – $4.00 | 14.52% |
| $4.01 – $6.00 | 6.45% |
| $6.01 – $8.00 | 17.74% |
| $8.01 – $10.00 | 3.23% |
| $10.01 – $12.00 | 11.29% |
| $12.01 – $14.00 | 1.61% |
| $14.01 – $16.00 | 4.84% |
| More than $16.00 | 12.90% |
Percentage of advertising budget allocated to Pinterest advertising
| % OF OVERALL ADVERTISING BUDGET | % OF MARKETERS |
| 0% – 5% | 32.79% |
| 6% – 10% | 14.75% |
| 11% – 20% | 9.02% |
| 21% – 30% | 11.48% |
| 31% – 40% | 7.38% |
| 41% – 50% | 4.92% |
| 51% – 60% | 4.10% |
| 61% – 70% | 6.56% |
| 71% – 80% | 4.10% |
| More than 80% | 4.92% |
ROI satisfaction from Pinterest advertising
| SATISFIED WITH PINTEREST ADVERTISING ROI | % OF MARKETERS |
| Yes | 57% |
| No | 43% |
Monthly Twitter advertising costs
| MONTHLY TWITTER ADVERTISING COST | % OF MARKETERS |
| $0 – $100 | 15.83% |
| $101 – $500 | 35.00% |
| $501- $1000 | 18.33% |
| $1001- $5000 | 11.67% |
| $5001 – $10,000 | 8.33% |
| More than $10,000 | 10.83% |
Twitter advertising costs per first action
| COST PER FIRST ACTION | % OF MARKETERS |
| $0 – $0.25 | 15.00% |
| $0.26 – $0.50 | 17.50% |
| $0.51 – $0.75 | 15.00% |
| $0.76 – $1 | 12.50% |
| $1.01 – $1.50 | 9.17% |
| $1.51 – $2 | 8.33% |
| $2.01 – $2.50 | 6.67% |
| $2.51 – $3 | 8.33% |
| More than $3 | 5.00% |
| Not applicable | 2.50% |
Twitter advertising costs per follow
| COST PER FOLLOW | % OF MARKETERS |
| $0 – $1 | 13.33% |
| $1.01 – $2 | 25.00% |
| $2.01 – $3 | 11.67% |
| $3.01 – $4 | 11.67% |
| $4.01 – $5 | 7.50% |
| $5.01 – $6 | 6.67% |
| $6.01 – $7 | 8.33% |
| More than $7 | 5.00% |
| Not applicable | 10.83% |
Percentage of advertising budget allocated to Twitter advertising
| % OF OVERALL ADVERTISING BUDGET | % OF MARKETERS |
| 0% – 5% | 14.17% |
| 6% – 10% | 16.67% |
| 11% – 20% | 20.83% |
| 21% – 30% | 14.17% |
| 31% – 40% | 9.17% |
| 41% – 50% | 4.17% |
| 51% – 60% | 8.33% |
| 61% – 70% | 2.50% |
| 71% – 80% | 5.00% |
| More than 80% | 5.00% |
ROI satisfaction from Twitter advertising
| SATISFIED WITH TWITTER ADVERTISING ROI | % OF MARKETERS |
| Yes | 60% |
| No | 40% |
Monthly YouTube advertising costs
| MONTHLY YOUTUBE ADVERTISING COST | % OF MARKETERS |
| $0 – $100 | 14.97% |
| $101 – $500 | 25.17% |
| $501 – $1000 | 28.57% |
| $1001 – $5000 | 14.29% |
| $5001 – $10,000 | 8.84% |
| More than $10,000 | 8.16% |
YouTube advertising cost per view
| COST PER VIEW | % OF MARKETERS |
| $0 – $0.10 | 11.56% |
| $0.11 – $0.20 | 13.61% |
| $0.21 – $0.30 | 12.93% |
| $0.31 – $0.40 | 17.01% |
| $0.41 – $0.50 | 11.56% |
| $0.51 – $0.70 | 14.97% |
| $0.71 – $1.00 | 10.20% |
| More than $1.00 | 8.16% |
Percentage of advertising budget allocated to YouTube ads
| PERCENTAGE OF OVERALL ADVERTISING BUDGET | % OF MARKETERS |
| 0% – 5% | 12.24% |
| 6% – 10% | 15.65% |
| 11% – 20% | 17.69% |
| 21% – 30% | 15.65% |
| 31% – 40% | 8.16% |
| 41% – 50% | 6.80% |
| 51% – 60% | 9.52% |
| 61% – 70% | 6.12% |
| 71% – 80% | 4.76% |
| More than 80% | 3.40% |
ROI satisfaction from YouTube advertising
| SATISFIED WITH YOUTUBE ADVERTISING ROI | % OF MARKETERS |
| Yes | 75% |
| No | 25% |

