

TL;DR: 2026 home services marketing benchmarks
- CPL averages $181 (B2B) and $144 (B2C): Lead costs sit lower than other industries, but waste adds up fast. Track CPL against job value to ensure every lead stays profitable.
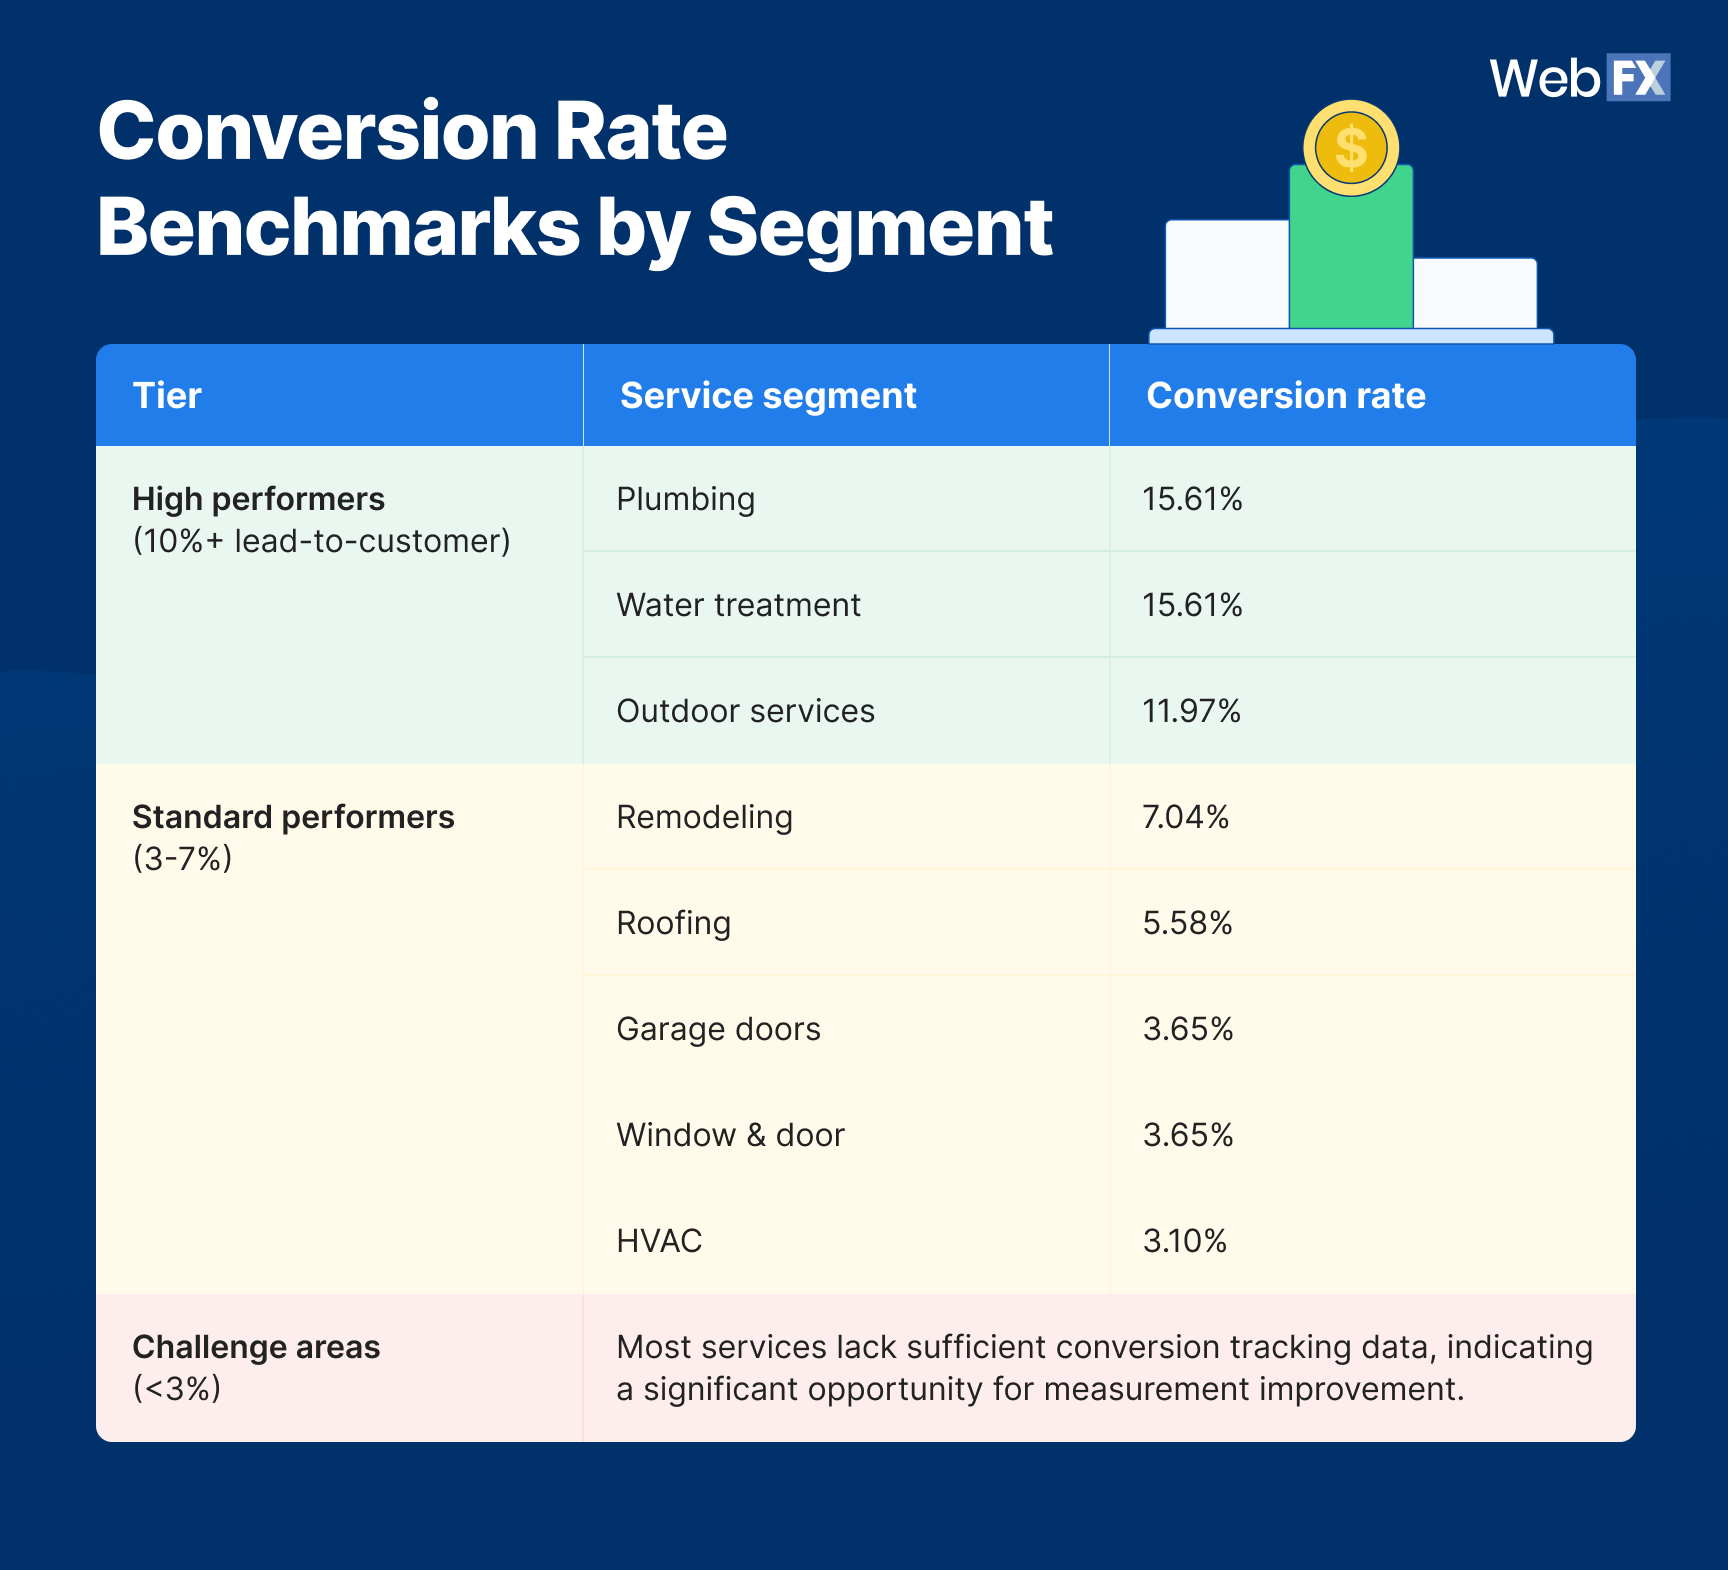
- Conversion rates hold at 7.8% industry-wide: Plumbing, water treatment, and outdoor services convert strongest at 12–16%, while HVAC, roofing, and remodeling sit in the mid-tier range (3–7%). Use reviews, financing offers, and urgency messaging to lift close rates.
- Sales cycles average ~60 days: Emergency jobs close same-day, but big installs and renovations stretch weeks. Nurture long-cycle leads with reminders, seasonal promos, and follow-ups.
- CPC averages $3.50 across search: Geo-specific emergency keywords convert strongest, while premium installs face stiffer competition. Bid smart on local, high-intent terms to stretch ad spend.
- Gross margins average 33%: Margins leave little room for waste. Tighten spend on underperforming channels and reinvest in referral, review, and local SEO tactics that compound ROI.
You know the drill: Phones go silent in the off-season, ad spend burns faster than it earns, and competitors with bigger budgets steal jobs you should’ve won. In the home services industry, survival isn’t about working harder. It’s about working smarter. That’s why tracking home services marketing benchmarks is a must for every service provider.
These benchmarks give you a clear, data-backed picture of how your home services marketing performance stacks up against industry standards. Instead of guessing whether your cost per lead is “good” or if your sales cycle is too long, you’ll know. With the right home services marketing metrics in hand, you can stop wasting money, spot hidden growth opportunities, and build a pipeline that keeps your crews busy year-round.
What are home services marketing benchmarks (and why do they matter)?
Home services marketing benchmarks are industry performance metrics that show how effectively your business attracts leads, converts jobs, and generates revenue compared to other providers. Think of them as your scorecard. Instead of wondering whether your ad spend is paying off or if your sales cycle is dragging, benchmarks tell you exactly where you stand.
Tracking home services industry benchmarks helps you:
- Set smarter goals based on industry data instead of gut feel.
- Reveal inefficiencies in your sales funnel before they drain your pipeline.
- Prove ROI when you need to justify your spend or secure a bigger budget.
- Stay competitive in a crowded market where one missed call or slow quote response can hand the job to your competitor.
At the end of the day, these home services marketing metrics give you clarity. Instead of chasing leads blindly, you’ll know which strategies earn you more jobs and which ones waste cash.
Key home services marketing benchmarks providers must track
Not every number in your dashboard deserves your attention. The reality is, only a few home services marketing benchmarks truly reveal whether your business is earning jobs efficiently or leaking revenue.
By focusing on the right home services industry benchmarks, you’ll see how your performance stacks up, where you’re leaving money on the table, and which channels drive the biggest ROI.
In 2026, the home services marketing metrics worth tracking are:
- 2026 home services marketing benchmarks snapshot
- Lead generation & cost benchmarks
- Conversion & performance benchmarks
- Search landscape & keyword insights
- Community insights & market reality
- Competitive landscape analysis
- Strategic recommendations & budget allocation
2026 home services marketing benchmarks snapshot
Want to know if your marketing is pulling its weight? This snapshot gives you the high-level perspective of home services marketing benchmarks, helping you see if your business is operating within the norm, outperforming competitors, or slipping behind.
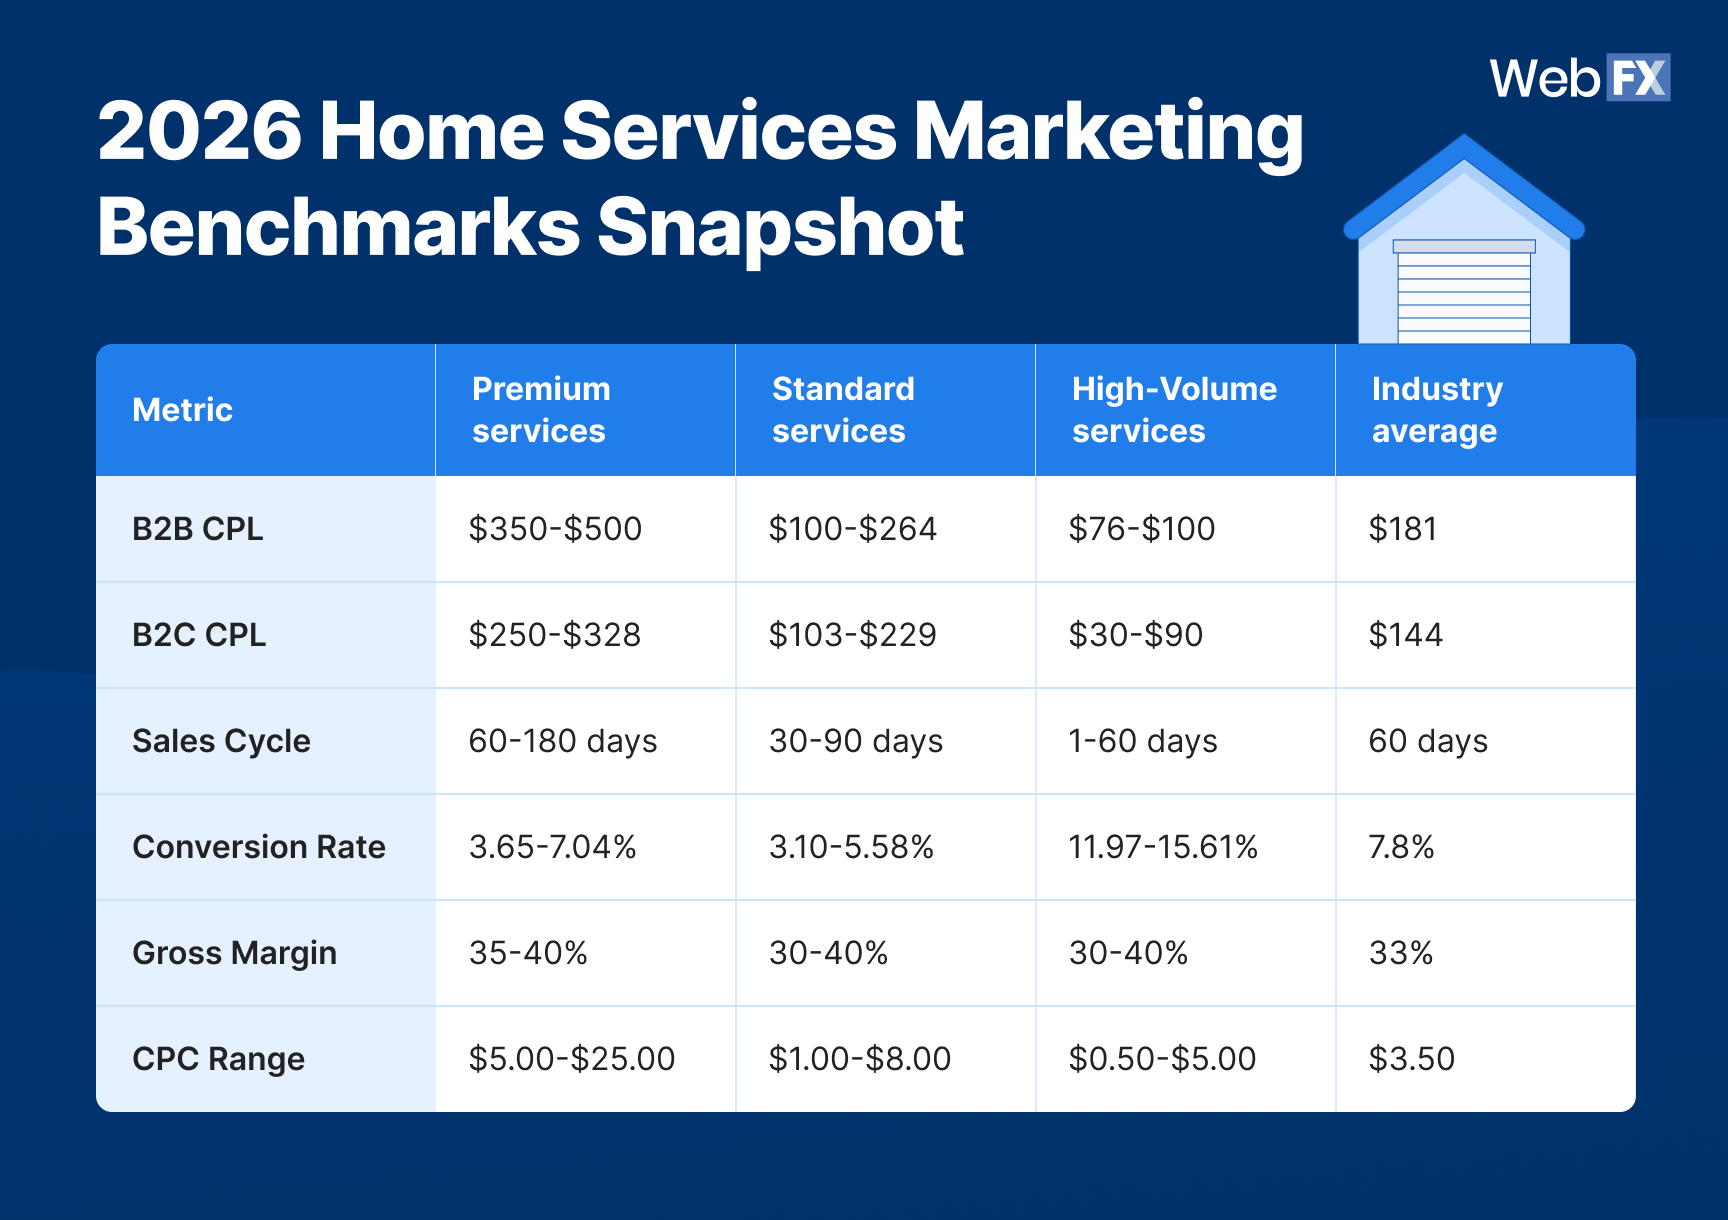
🔎 Quick takeaways:
- Premium jobs are pricey but profitable: Kitchen, bath, and roofing leads run $350–$500 CPL but deliver 35–40% margins.
- High-volume services convert fast: Plumbing and pest control average 12–15% conversion rates with sales cycles measured in days, not months.
- Standard services sit in the middle: HVAC, landscaping, and electricians average $100–$250 CPL with 30–90 day cycles.
- Local CPC inflation is real: Competitive metro areas (Dallas, Atlanta, Houston) push CPCs 2–4x higher than national averages.
- CPC ranges reflect localized keyword premiums in competitive markets.
Lead generation & cost benchmarks
Filling your job pipeline isn’t cheap. In the home services industry, cost per lead (CPL) and cost per click (CPC) can swing wildly depending on whether you’re selling high-ticket remodels or handling emergency calls at 2 a.m.
Tracking CPL and CPC together shows the full cost picture: How much you spend to get prospects through the door and what it really takes to turn them into booked jobs.
CPC ranges by market segment
| Market segment | CPC range | Examples |
| Premium | $5.00–$25.00+ | Emergency plumber + location: $15-25+ (high urgency, major metros)
Plumber near me: $10.00 (broad match, increasing with location specificity) Bathroom remodeling + city: $10-20+ (high-value projects, competitive markets) Solar installation + location: $8-15+ (government incentives driving competition) |
| Standard | $2.00–$8.00 | HVAC repair + location: $3-8+ (seasonal spikes in summer/winter)
Roof repair + city: $2-6+ (storm season premium pricing) Window replacement + location: $4-10+ (home improvement boom impact) Carpet cleaning + area: $2-5+ (recurring service value) |
| Competitive | $1.00–$4.00 | Pest control + location: $1-4+ (seasonal variation)
Landscaping + city: $2-6+ (spring/summer premium) House cleaning + area: $1-3+ (high competition, recurring revenue) |
📊 What the data tells you
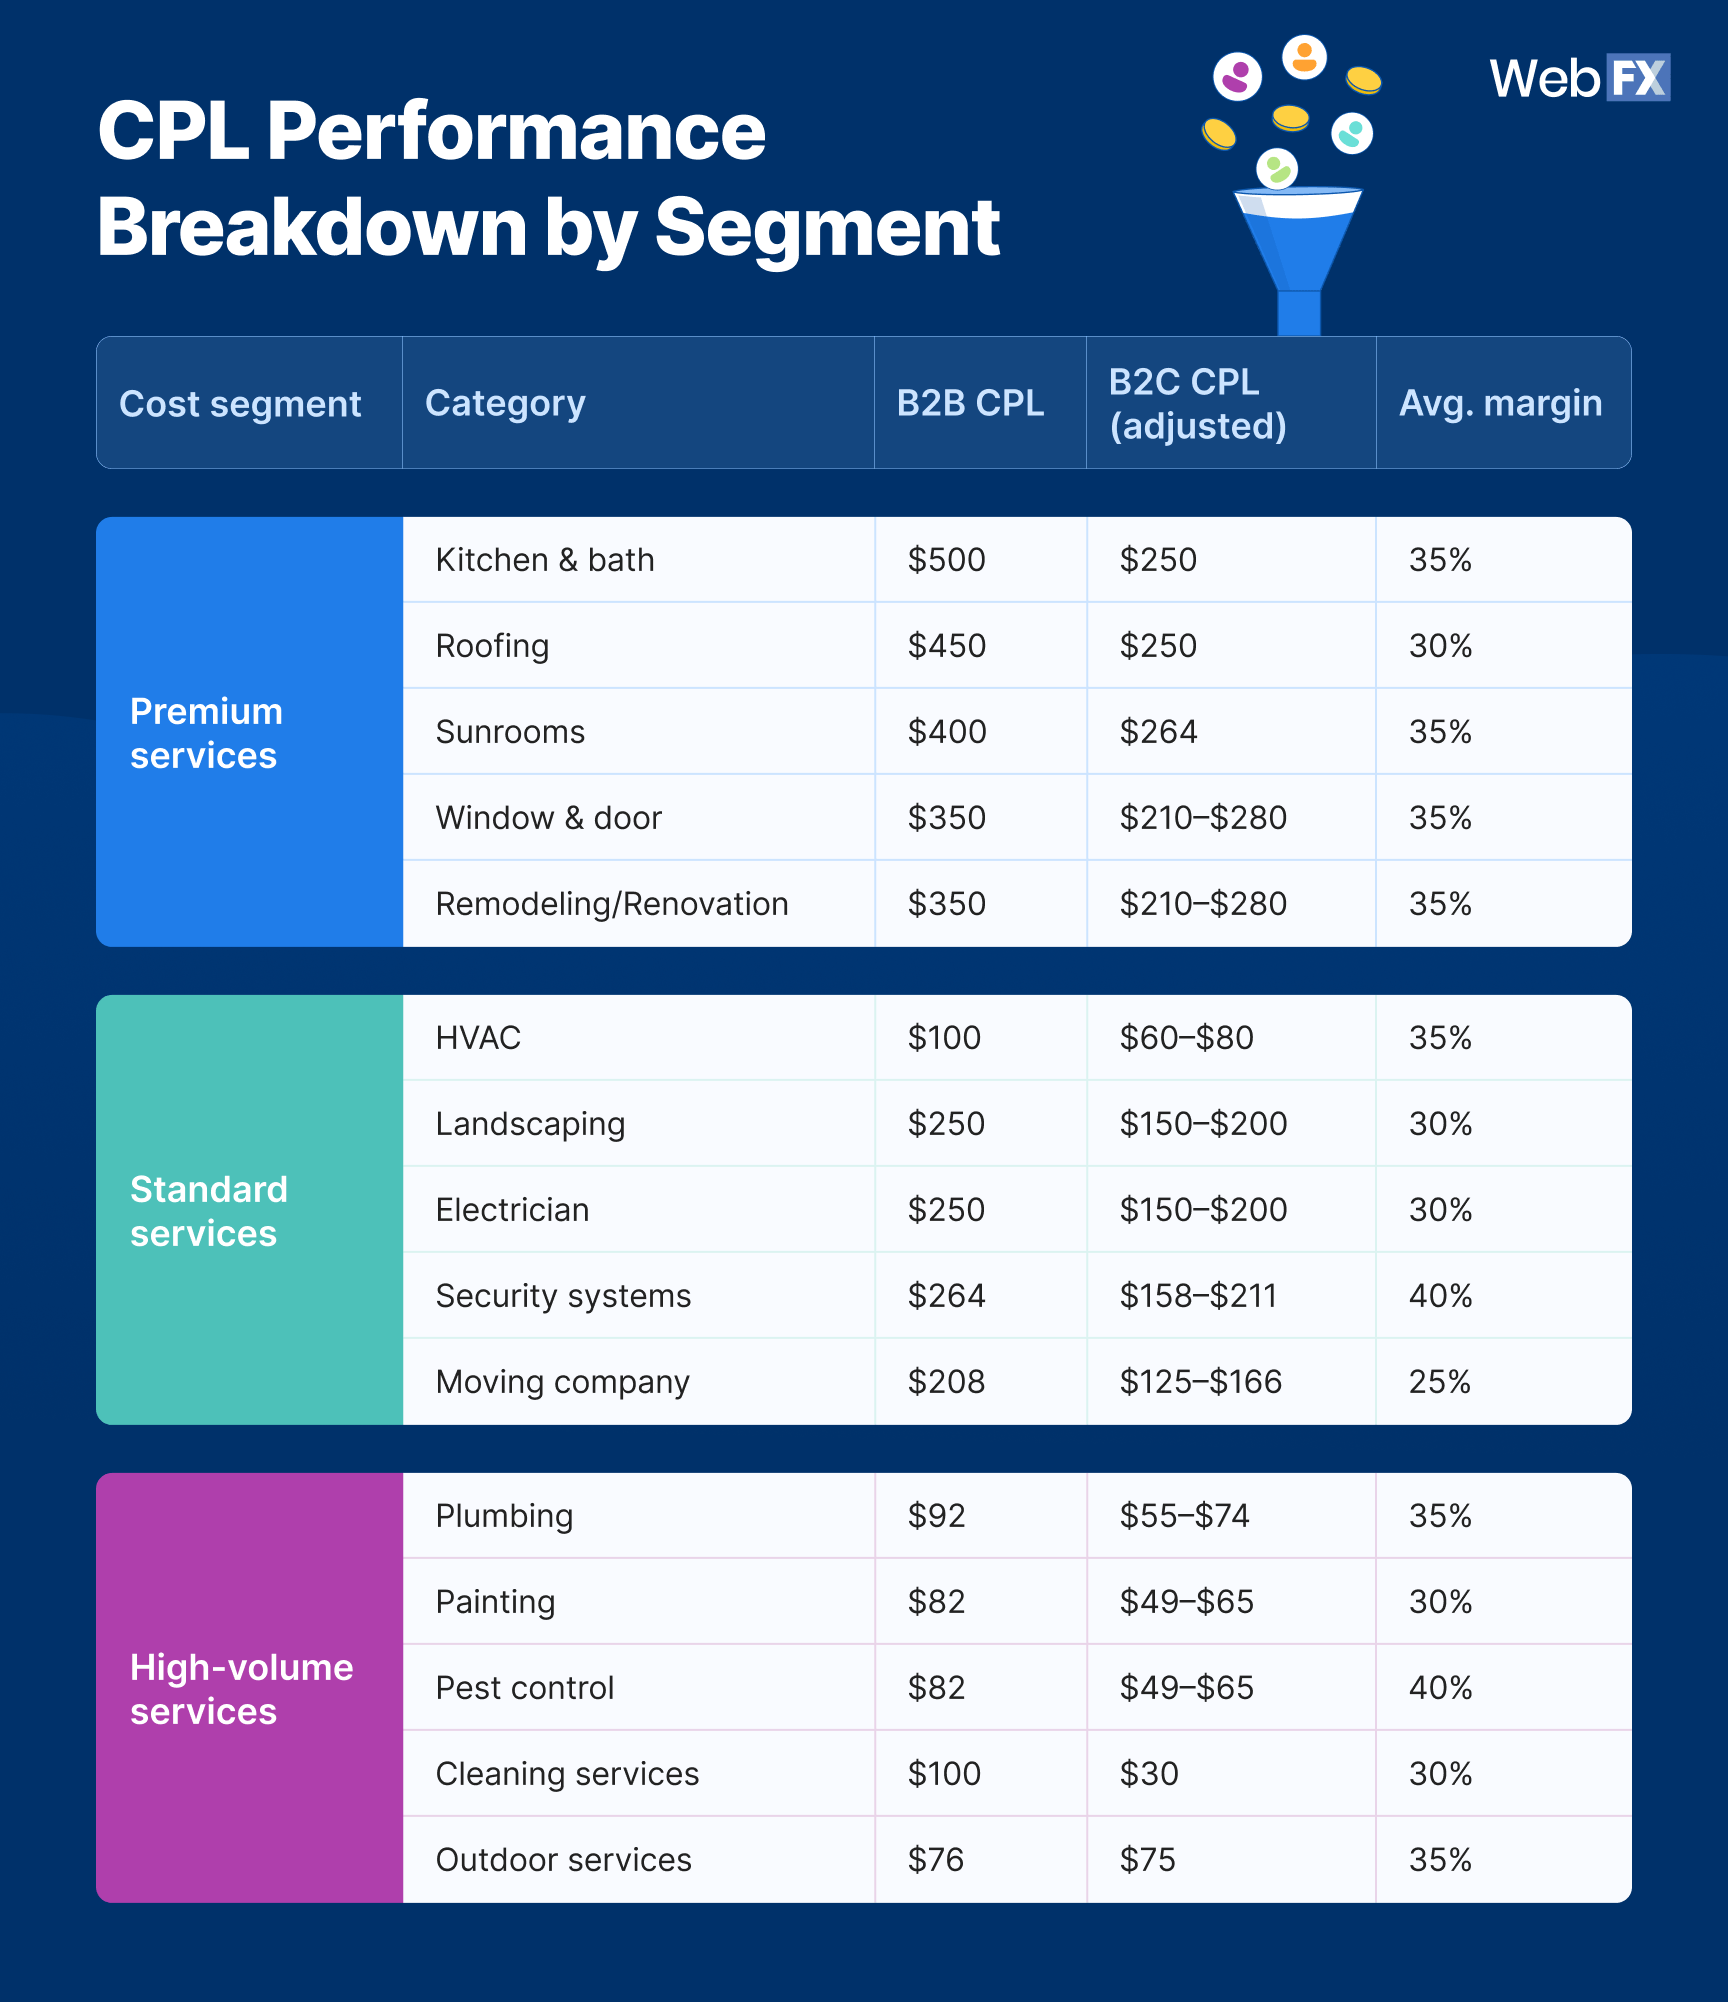
- 67% of home services subcategories fall in the $200–$400 B2B CPL range, showing standardization around premium pricing.
- B2C leads consistently cost 20–40% less than B2B across all segments, with some exceptions like Cleaning ($30 CPL) and Outdoor Services ($75 CPL).
- CPCs remain low for basic consumer services (under $3.50) but spike to $15+ in B2B markets, where competition and deal sizes are larger.
- CPCs shown represent broad keyword averages. Localized versions typically command 2–4x higher rates.
- Major metros like Dallas, Houston, and Atlanta see 50–100% CPC premiums.
- Emergency keywords during peak seasons can exceed $30+ CPC.
- Local business competition drives CPCs significantly above national averages.
💡 How you can act on it
- Prioritize high-LTV jobs: Justify higher CPLs in premium services (kitchens, roofing, sunrooms) by focusing on projects with $10K–$20K lifetime revenue.
- Refine paid search targeting: Shift budget from broad national keywords to geo-specific, high-intent searches like “emergency plumber [city],” where conversion rates spike.
- Invest in call tracking + attribution: Use tools like RevenueCloudFX to connect clicks to booked jobs, exposing wasted spend and improving ROI.
- Strengthen offers: Boost conversion rates and offset high CPLs with free inspections, financing, seasonal discounts, or bundled services.
Conversion & performance benchmarks
Leads mean nothing if they don’t turn into jobs. In the home services industry, conversion rate (CVR), sales cycle length, and gross margin benchmarks reveal whether your marketing delivers profitable work or just burns cash.
These home services marketing metrics show how fast leads close, how much revenue they generate, and where providers either dominate or drag their feet.
Sales cycle length benchmarks
| Service type | Category | Sales cycle length |
| Premium services | Kitchen & bath | 180 days |
| Roofing | 30 days | |
| Sunrooms | 60 days | |
| Window & door | 60 days | |
| Remodeling/Renovation | 60 days | |
| Standard services | HVAC | 90 days |
| Landscaping | 60 days | |
| Electrician | 30 days | |
| Security systems | 30 days | |
| Moving company | 30 days | |
| High-volume services | Plumbing | 1 day |
| Painting | 60 days | |
| Pest control | 7 days | |
| Cleaning services | 60 days | |
| Outdoor services | 30 days | |
| Industry average | ~60 days | |
Gross margin benchmarks
| Segment type | Margin range |
| Premium services | 35–40% |
| Standard services | 30–40% |
| High-volume services | 30–40% |
| Industry average | 33% |
📊 What the data tells you
- High-volume services like plumbing and outdoor services close fastest, with 12–15% CVRs and shorter sales cycles of 1–30 days.
- Premium projects take longer (up to six months) but deliver higher margins (35–40%).
- Standard services (HVAC, landscaping, electrical) sit in the middle, with moderate sales cycles (30–90 days) and 30–40% margins.
- Providers with no conversion tracking risk underestimating both close rates and lost revenue.
- Across the board, the industry average sits at a 7.8% CVR, ~60-day sales cycle length, and 33% gross margin, making them the baseline providers should measure against.
💡 How you can act on it
- Streamline follow-ups: Speed matters. Emergency services win when providers respond in minutes, not hours.
- Nurture long-cycle leads: Use email, remarketing, and financing offers to keep high-ticket prospects engaged through 90–180 day cycles.
- Build trust drivers: Case studies, reviews, and guarantees can lift mid-tier CVRs by 1–2 percentage points.
- Track every conversion: Missed calls and untracked forms are silent revenue killers. Tie attribution to actual booked jobs.
Search landscape & keyword insights
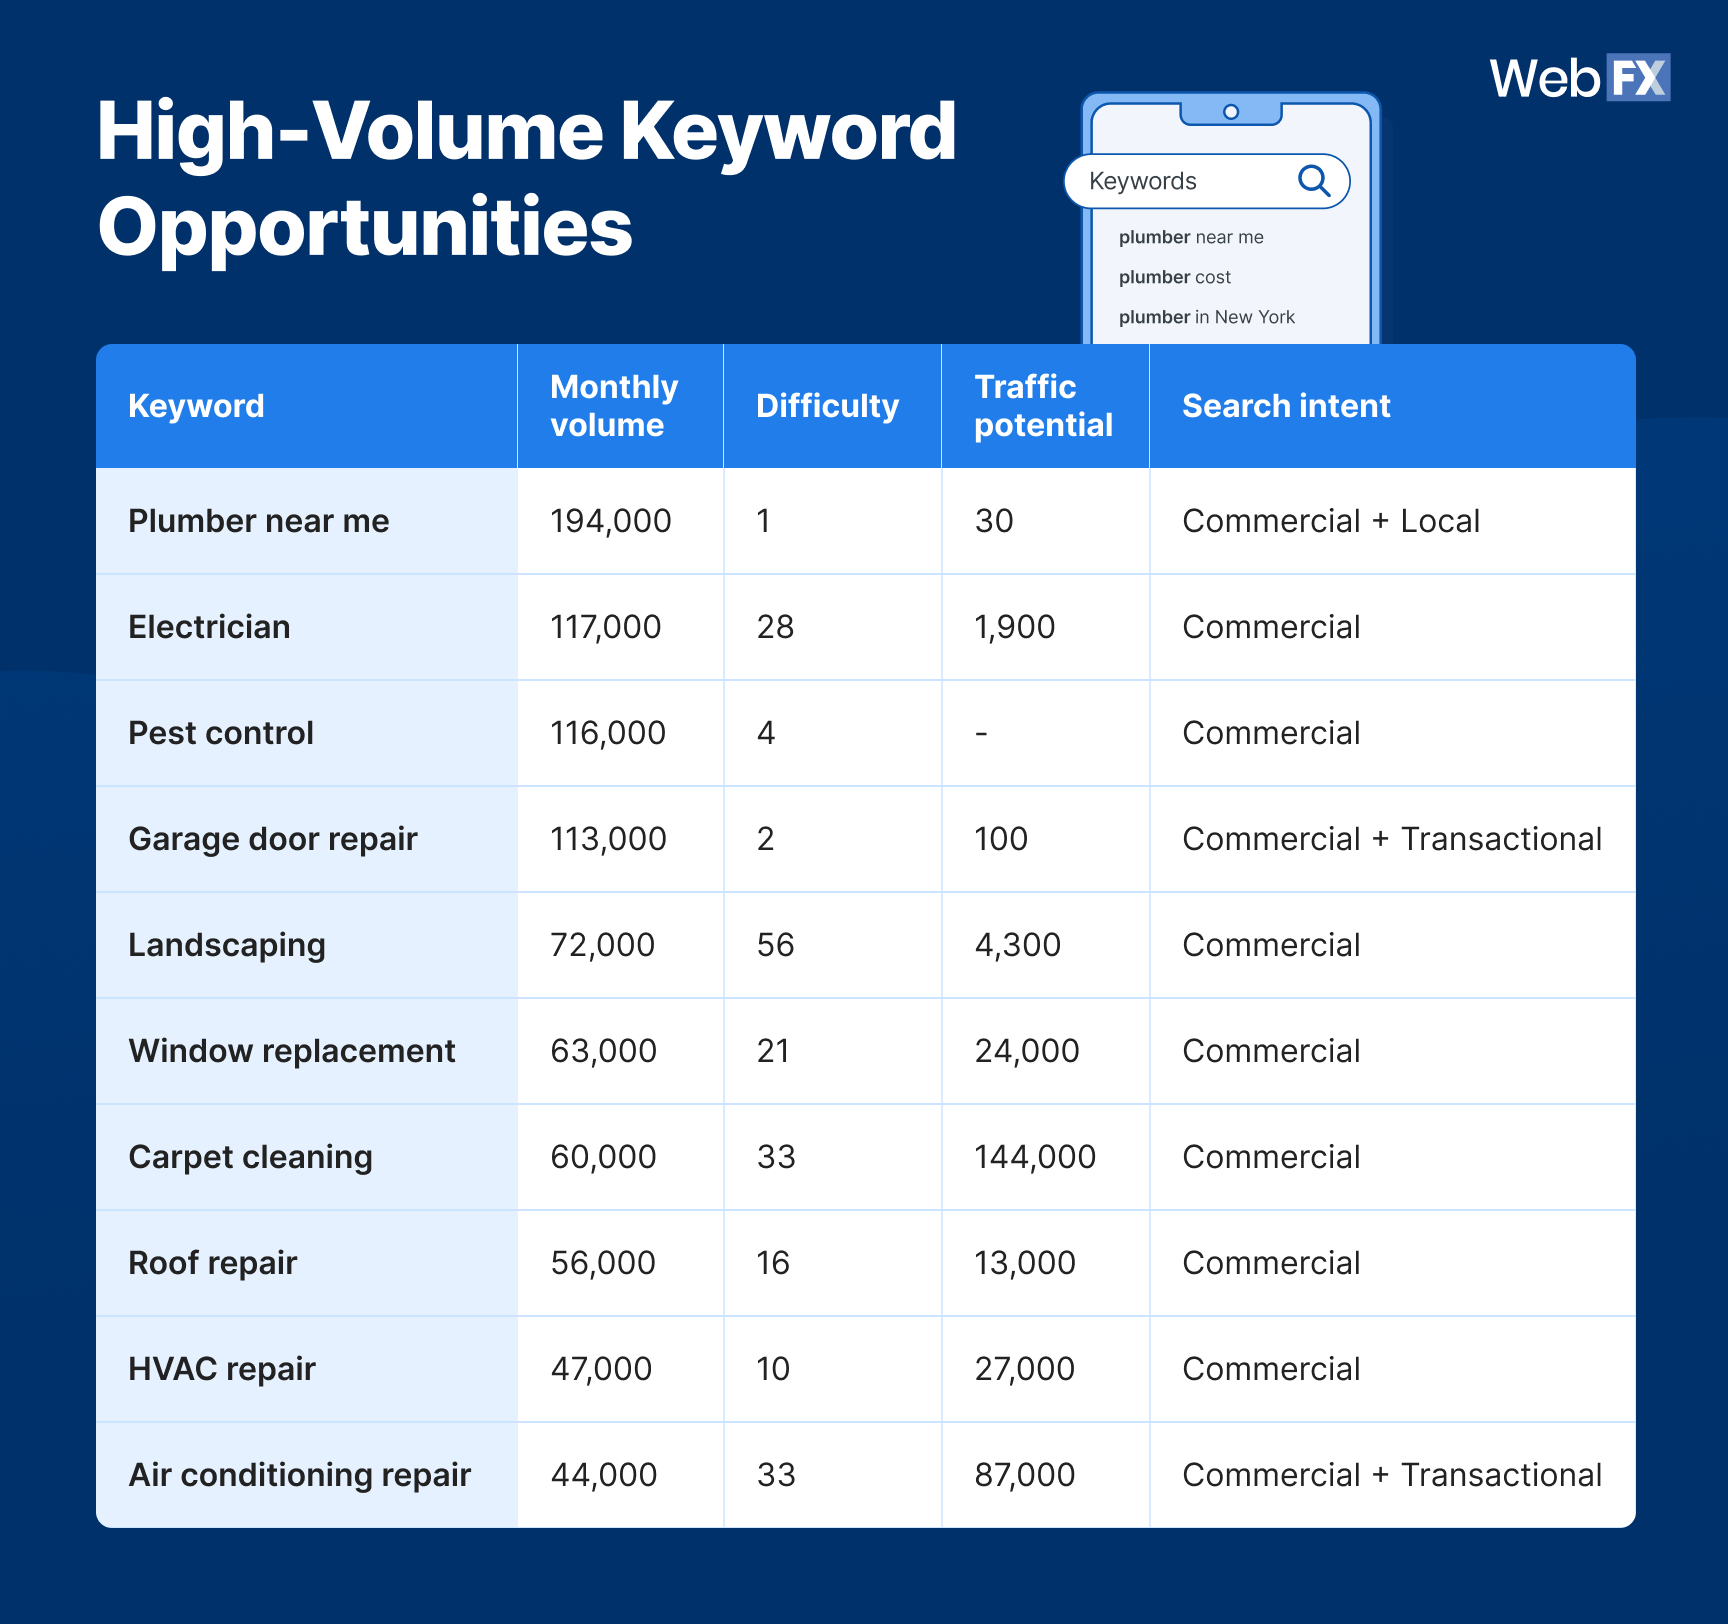
Most home services jobs start the same way: With a search. Search demand reveals where homeowners put their money, whether they’re looking for a “plumber near me” at midnight or “bathroom remodel cost” during spring planning. Tracking search trends shows where opportunity lies and where competition drives prices through the roof.
Keyword difficulty analysis
| Competition tier | Keyword | Difficulty score |
| Low (0–10) | Emergency plumber | 1 |
| Plumber near me | 1 | |
| Garage door repair | 2 | |
| Concrete repair | 3 | |
| Pest control | 4 | |
| Gutter cleaning | 8 | |
| HVAC repair | 10 | |
| Bathroom remodeling | 10 | |
| Moderate (11–40) | Roof repair | 16 |
| Window replacement | 21 | |
| Electrician | 28 | |
| Carpet cleaning | 33 | |
| Air conditioning repair | 33 | |
| High (40+) | Landscaping | 56 |
| Moving company | 85 |
📊 What the data tells you
- Commercial intent dominance: 95% of analyzed keywords show strong commercial intent, indicating high purchase consideration.
- Local intent strength: Keywords with “near me” and location modifiers consistently show lower competition scores, higher conversion potential, and strong SERP feature presence (local map pack, featured snippet, People Also Ask).
- Competition tiers are clear: Providers in low-difficulty niches (like garage door repair or pest control) have fast-win opportunities, while high-difficulty services like landscaping and moving require heavier investment.
- Seasonality shapes demand: Emergency-driven terms (plumber, HVAC repair) spike during peak seasons, creating both opportunity and budget risk.
💡 How you can act on it
- Dominate local intent: Prioritize “near me” and geo-modified searches with optimized Google Business Profiles and localized content.
- Win quick with low-difficulty terms: Target garage door repair, pest control, and HVAC repair keywords to earn affordable leads.
- Play the long game in high-competition markets: Focus on niche modifiers (“eco-friendly landscaping,” “long-distance moving company”) to stand out.
- Plan for seasonal swings: Budget extra for emergency service terms during peak demand periods.
Community insights & market reality
The numbers only tell half the story. To understand real-world home services marketing performance, you have to listen to providers themselves. Community discussions (like Reddit) reveal the on-the-ground challenges, and the scrappy strategies service businesses use to keep leads flowing despite budget pressures, platform changes, and seasonal demand swings.
Key challenges identified from Reddit analysis
| Challenge | What providers report | Benchmark insight |
| Google Business Profile dependency | Local SEO accounts for 60%+ of leads for most home service businesses
Google verification requirements have become increasingly strict
A cleaning company lost 40% of its business when GBP was suspended |
Over-reliance on GBP is risky, but still the primary lead driver for home services. |
| Meta ads performance decline | Facebook ad costs increased 80%+ for many businesses (from $30 to $55 CPL)
Small businesses are reporting better results from organic content than paid ads
Practitioners achieving 2x sales growth after reducing ad spend by 90% |
Paid ads are losing efficiency. Organic, local-first strategies are outperforming. |
| Organic content success stories | Daily video posting across TikTok, Instagram, and YouTube showing strong ROI
“Spray and pray” content approach: 12 posts daily across platforms
Even 5K views videos generating sales for niche home services
Quiz-format content performing well for educational/comparison topics |
Video + educational content are proven revenue drivers in home services. |
| Seasonal demand patterns | Three pay period months (like August) create cash flow challenges
Emergency services are maintaining a consistent demand
Renovation services are showing longer decision cycles, requiring nurture sequences |
Benchmarks must factor seasonality into pipeline planning and ad budgets. |
Content publishing frequency benchmarks
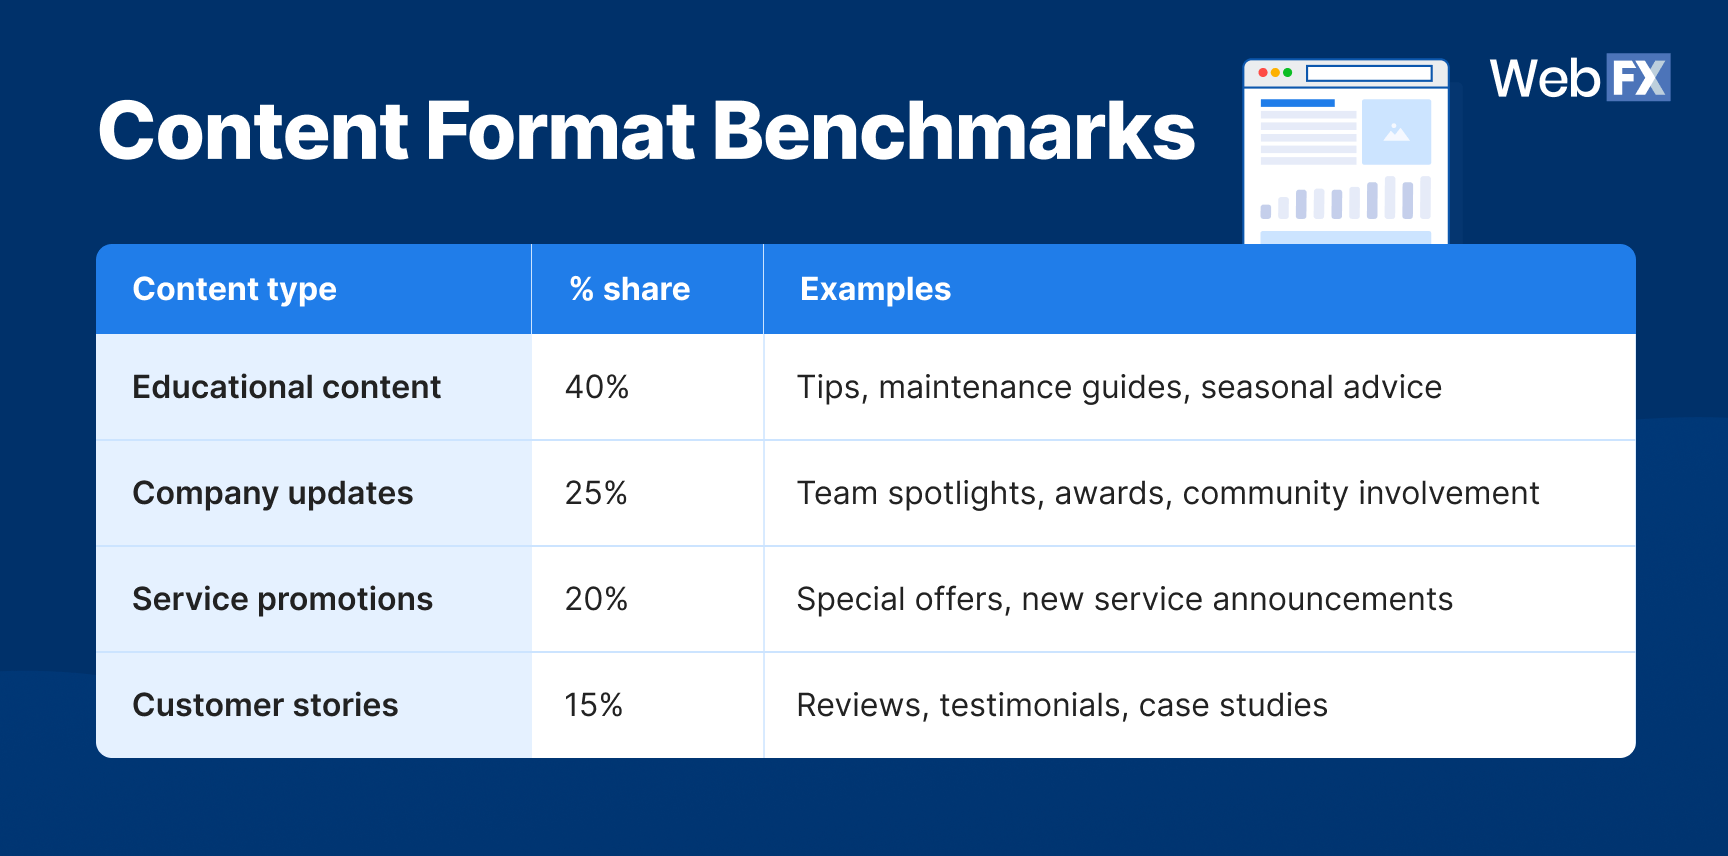
| Business size | Publishing cadence | Content focus |
| Enterprise companies (ServiceMaster, Molly Maid) | 8–12 blogs/month | Focus on company news, franchise spotlights, and thought leadership
Maintain consistent monthly publishing schedules
Emphasize brand authority and corporate communications |
| Mid-size companies ($2M–$10M revenue) | 2–4 blogs/month | Mix of educational content and service promotion
Seasonal content aligned with demand cycles
Local market and customer success stories |
| Small companies (<$2M revenue) | 1–2 blogs/month or quarterly | Primarily educational “how-to” content
Heavy focus on local SEO and Google Business Profile updates
Social media posting 3-5 times per week on average |
Successful strategies being discussed
| Strategy type | Key tactics |
| Multi-platform organic strategy | Daily content creation across all major platforms
Reaction videos and trend adaptation show high engagement
Focus on educational content, building trust before selling |
| Local market dominance | Google Business Profile optimization as the primary focus
Review generation systems are becoming critical
Local keyword targeting over broad national terms |
| Emergency service positioning | 24/7 availability messaging
Quick response time guarantees
Mobile-optimized booking systems |
Technology adoption patterns
| Adoption stage | Examples |
| High adoption | Online booking and scheduling systems
CRM integration for lead management
Review management platforms |
| Emerging trends | AI-powered customer service chat
Video-based estimates and consultations
Mobile payment processing |
| Resistance areas | Complex marketing automation
Multi-channel attribution tracking
Advanced analytics implementation |
📊 What the data tells you
- Local SEO is non-negotiable. With 60%+ of leads tied to Google Business Profiles, a single suspension can tank revenue.
- Paid ads are losing ground. Many providers report 2x sales growth after slashing Meta ad spend and leaning into organic content.
- Content consistency matters more than volume. Enterprises dominate with 8–12 posts a month, but even small businesses posting 1–2 times per month gain traction if they align with seasonal demand.
- Multi-platform organic and review-driven strategies consistently outperform “spray-and-pray” ad campaigns.
- Seasonality shapes demand. Emergency services thrive year-round, while remodeling and renovation require long-term nurture campaigns.
- Technology adoption is uneven. While booking and CRM tools are standard, advanced analytics and multi-channel attribution remain underused, leaving ROI visibility limited.
💡 How you can act on it
- Lock down local visibility: Prioritize GBP optimization and proactive review management to safeguard your #1 lead source.
- Shift budget strategically: Reduce dependence on paid social where CPLs have spiked 80%+, and double down on organic channels proven to drive ROI.
- Match content to capacity: Whether you can post twice a month or 12 times, keep it consistent and align with seasonal demand cycles.
- Adopt smart tech, not all tech: Start with high-adoption tools (CRM, online booking, review platforms) before moving into complex attribution systems.
- Plan around seasonality: Use financing offers, maintenance packages, and nurture sequences to stay top of mind during slower periods.
- Lean into education + trust: Use TikTok, YouTube, and blogs to teach, not just sell. Homeowner trust is the lever that turns views into booked jobs.
Competitive landscape analysis
The home services market is crowded, but not all segments fight the same battles. Some categories are oversaturated with competition and sky-high costs, while others remain underdeveloped, leaving room for smart providers to carve out market share.
Benchmarking your competitive landscape helps you decide whether to double down on crowded terms or pivot into niche opportunities where your marketing dollars stretch further.
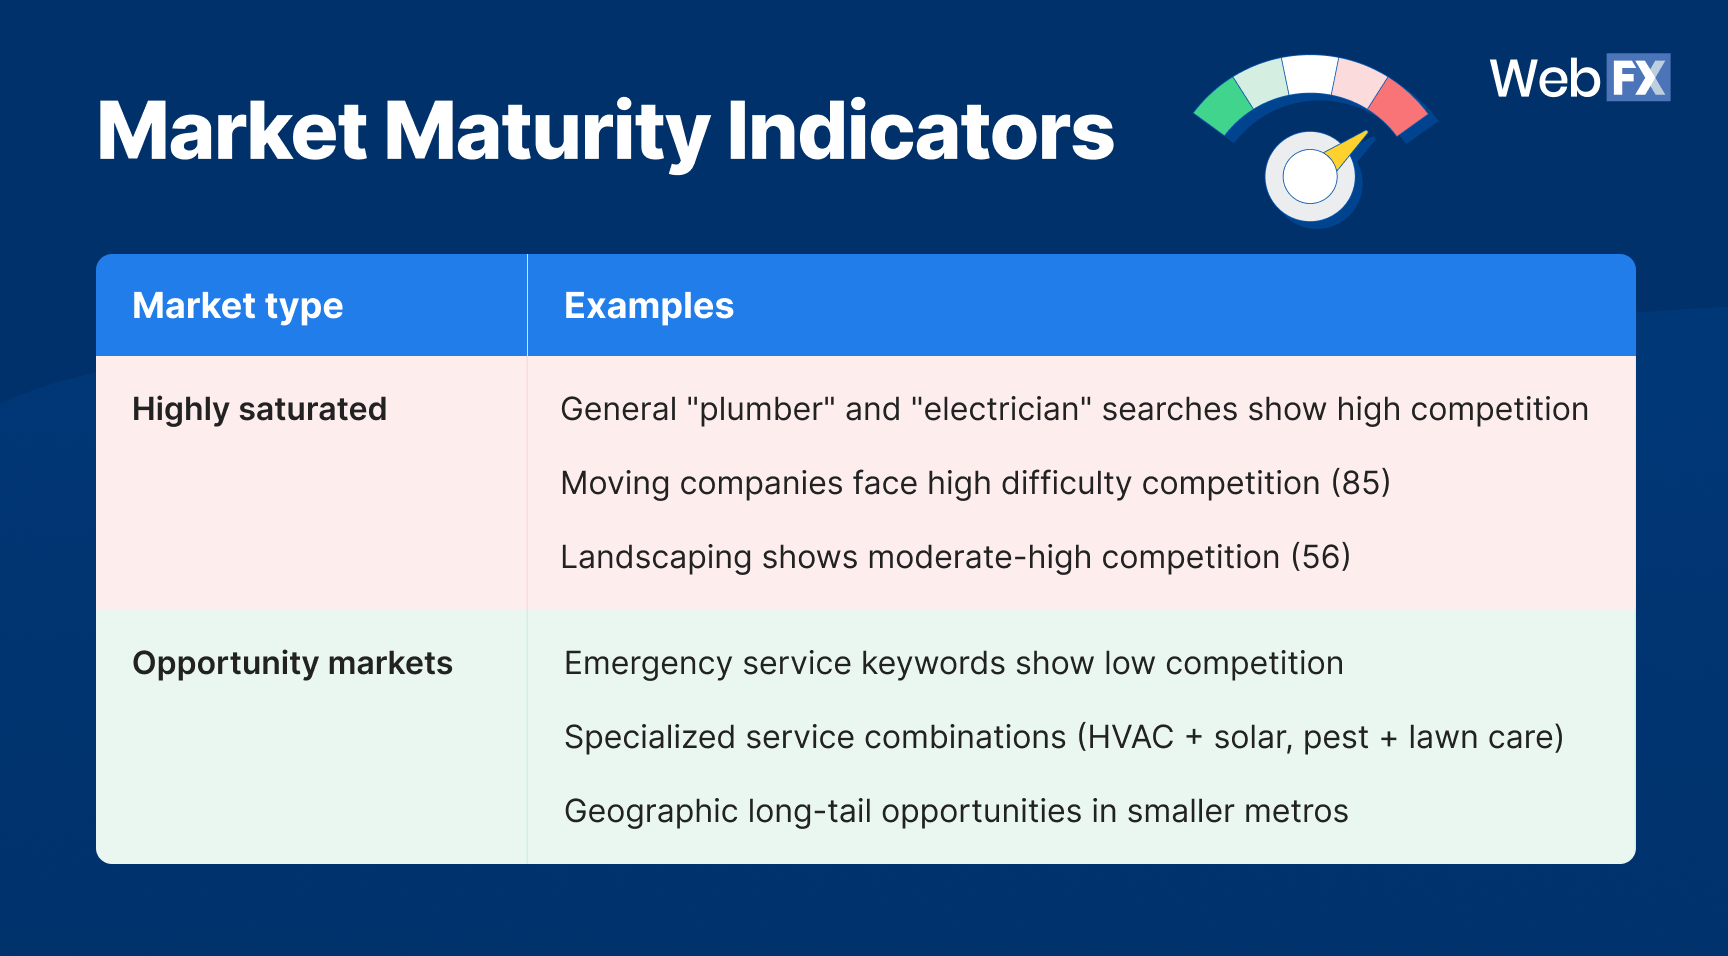
Competition levels by sub-sector
| Competition level | Service types |
| Low | Concrete repair
Gutter cleaning
Driveway repair
Deck repair
Emergency services |
| Moderate | Window replacement
Carpet cleaning
Kitchen remodeling
Bathroom remodeling |
| High | General landscaping
Moving services
Solar installation (77 difficulty) |
📊 What the data tells you
- Local competition is fierce. “plumber near me” and “electrician” dominate searches, especially in metros like Dallas, Houston, and Atlanta, where CPCs spike 50–100%.
- Premium segments like roofing and remodeling carry higher CPLs ($350–$500) and sit in moderate-to-high competition brackets, making efficiency crucial to stay profitable.
- Broad keywords are often dominated by lead-gen platforms and directories, making it harder for small providers to rank without niche targeting.
- Emergency and urgent services (plumbing, HVAC repair, pest control) are opportunity markets, pairing low keyword difficulty with conversion rates above 12%.
- Specialized service combinations (HVAC + solar, pest + lawn care) and neighborhood-level keywords offer untapped competitive edges.
💡 How you can act on it
- Pick your fights: Don’t chase oversaturated generic terms. Focus on geo-specific or service-combo keywords for faster ROI.
- Dominate locally: Invest in Google Business Profile, service-area pages, and review management to win high-intent local searches.
- Outrank directories: Target long-tail “service + suburb” queries with optimized content to sidestep big lead-gen sites.
- Capitalize on urgency: Build pay-per-click (PPC) campaigns around emergency keywords where CPLs are low, conversions are high, and timing matters.
- Bundle for demand: Highlight hybrid offerings (like HVAC + solar) to stand out in markets with growing cross-service needs.
Strategic recommendations & budget allocation
Benchmarks only matter if you act on them. For home services providers, the smartest moves balance quick wins with long-term scalability, while budget allocation shifts as your business grows.
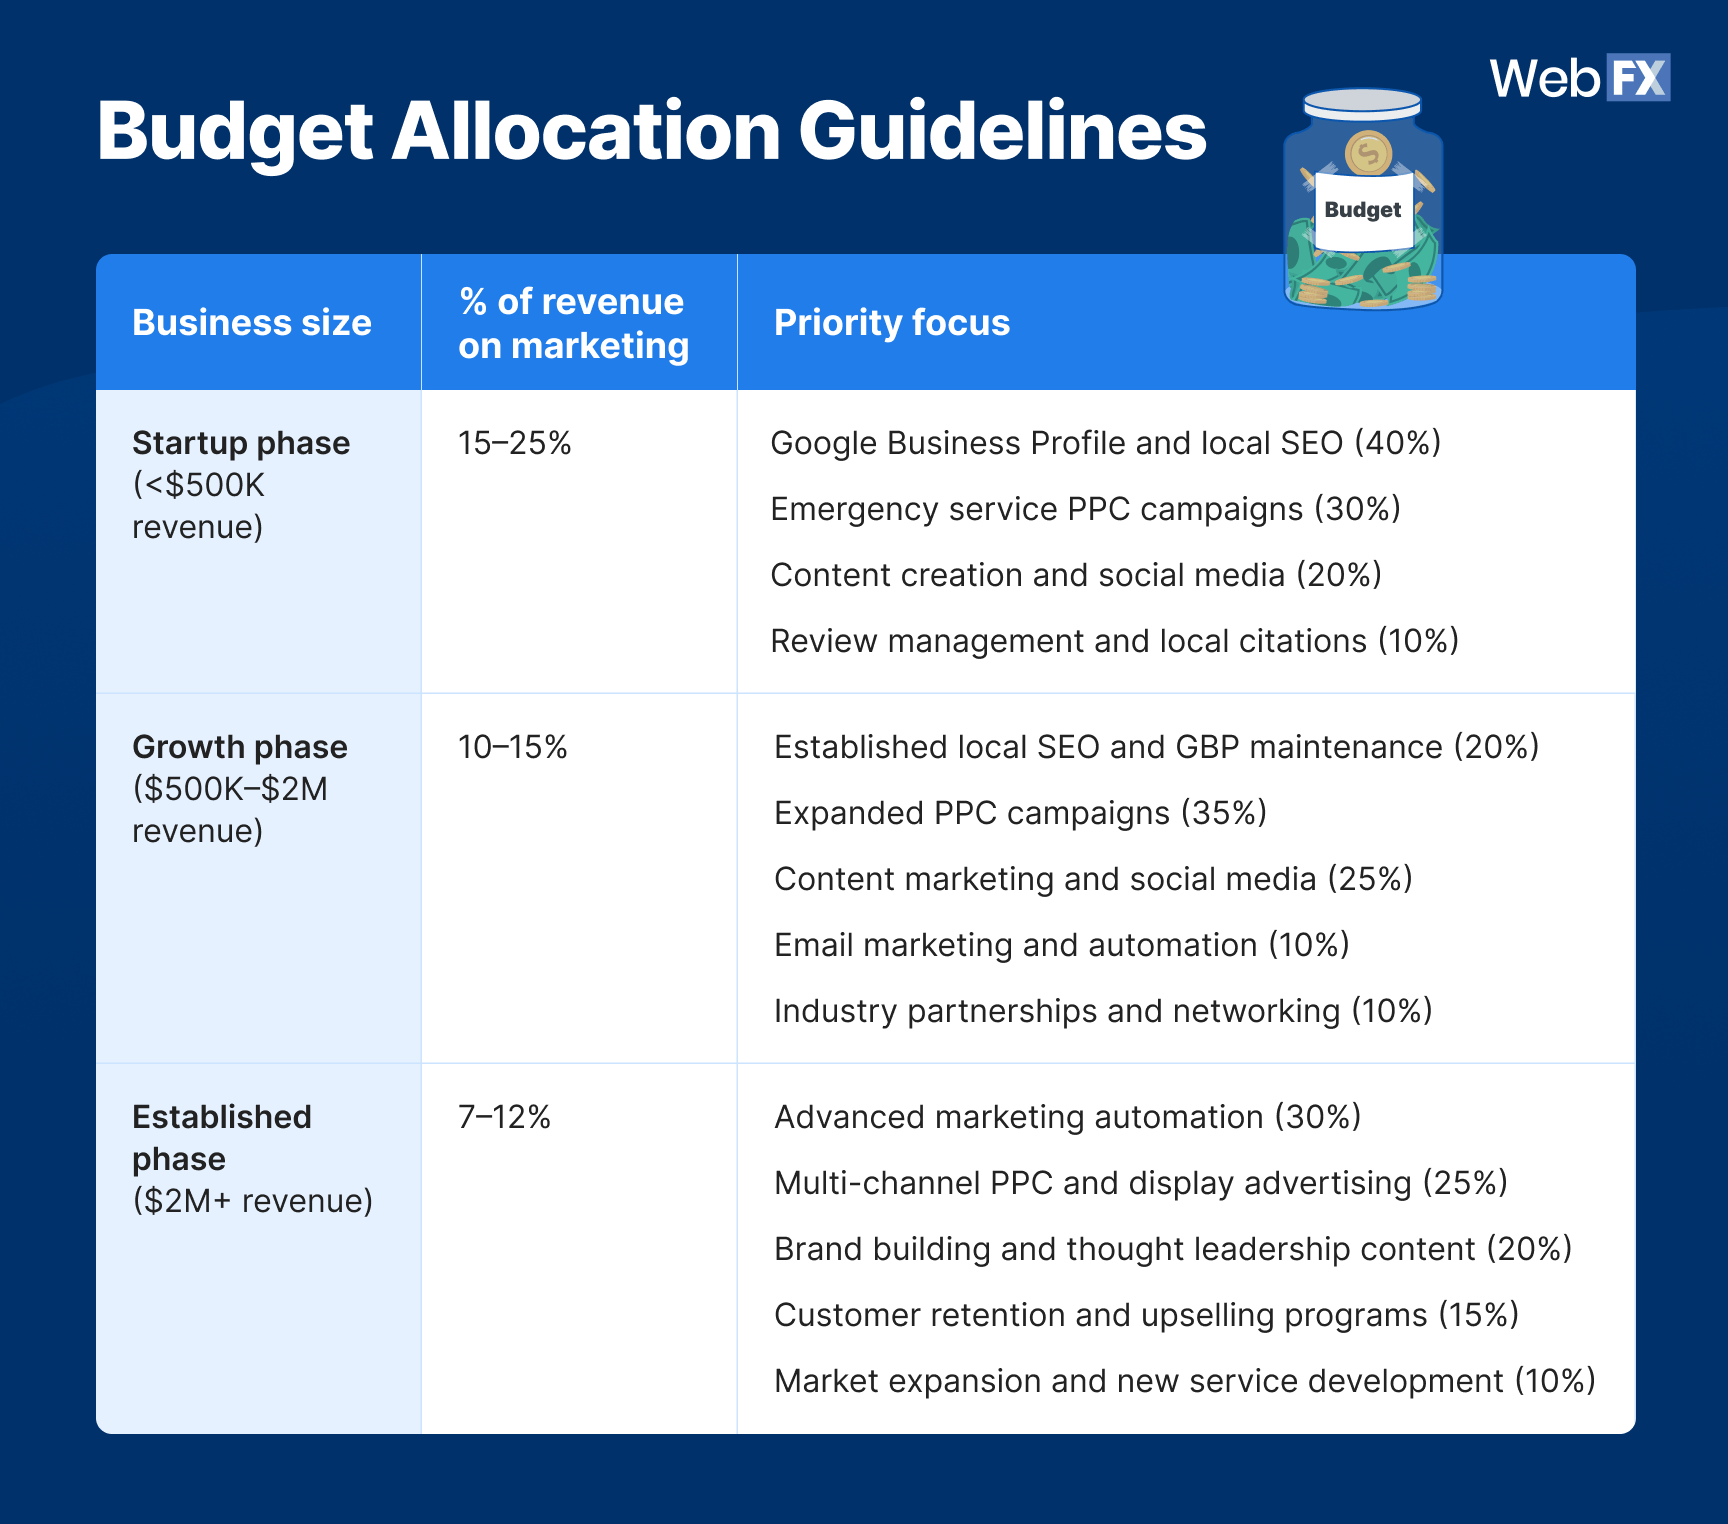
Recommended actions by priority
| Priority | Focus areas | Key actions tied to benchmarks & insights |
| Immediate | Local visibility & lead tracking | Lock down your Google Business Profile (GBP), 60%+ of leads depend on it.
Set up call tracking and attribution to avoid silent revenue leaks.
Test PPC around emergency + geo-specific keywords (“emergency plumber Dallas”), where CPCs are lower and conversions top 12%. |
| Mid-term | Reputation & content consistency | Launch review generation and management systems.
Post consistently on social media, even 1–2 times per month, drives traction for small providers. |
| Long-term | Market expansion & advanced strategies | Target opportunity niches (e.g., HVAC + solar, pest + lawn care).
Expand into new neighborhoods/suburbs with localized service pages.
Experiment with emerging tech like AI-powered chat, video estimates, and mobile payments once foundational systems are in place. |
Positioning strategies
| Strategy type | Key recommendations |
| Specialization | Focus on specific service combinations rather than broad categories (e.g., “emergency HVAC repair” vs. “HVAC services”) |
| Geographic | Target specific neighborhoods and suburbs rather than entire metro areas |
| Service timing | Emphasize emergency, weekend, and off-hours availability |
📊 What the data tells you
- Smaller providers must over-invest in local SEO, reviews, and referrals to stay competitive.
- Mid-sized businesses see the strongest ROI when layering automation with content hubs.
- Established companies can scale by investing in advanced analytics and digital transformation.
- Positioning around specialization, geography, and timing helps cut through saturated markets.
- Across the board, digital-first spend dominates (40–60%), but events, referrals, and reputation-building remain critical.
💡 How you can act on it
- Balance spend to size: Don’t stretch thin. Prioritize marketing channels that align with your business stage.
- Automate smartly: Use CRM + automation to nurture leads without burning out small teams.
- Build a content library: Educational + seasonal content doubles as SEO fuel and trust builder.
- Diversify channels: Leave room for events, referrals, and reputation-building to reinforce digital efforts.
- Own your niche: Highlight specialized services and hybrid offerings to stand out from competitors.
- Win locally: Prioritize GBP optimization, service-area pages, and review generation to dominate “near me” searches.
- Plan for seasonality: Keep cash flow steady with financing offers, maintenance packages, and nurture campaigns during off-peak months.
FAQs about home services marketing benchmarks
What are home services marketing benchmarks?
Home services marketing benchmarks are performance metrics that show how effectively providers generate leads, convert jobs, and earn revenue compared to industry standards.
In 2026, the key home services marketing metrics to track include:
- Cost per lead (CPL): $181 B2B average / $144 B2C average
- Conversion rate (CVR): 7.8% industry average
- Sales cycle length: ~60 days industry average
- Cost per click (CPC): $3.50 average
- Gross margin: 33% industry average
Tracking these benchmarks helps providers identify where spend is wasted, where ROI is strongest, and how their performance stacks up against the industry.
How often should providers review their benchmarks?
At a minimum, providers should review their marketing benchmarks quarterly to spot leaks, optimize budget allocation, and adjust to seasonal swings.
For emergency-driven services like plumbing and HVAC repair, monthly reviews are smarter since demand and CPCs can spike overnight.
Do smaller home services businesses need to track benchmarks?
Absolutely. Benchmarks aren’t just for big franchises. They’re especially critical for small and mid-sized providers with tighter budgets.
For lean teams, benchmarks help you:
- Prioritize low-cost, high-intent keywords (like “emergency plumber near me”).
- Optimize CPL with smarter geo-targeting.
- Build a repeatable system that reduces reliance on word-of-mouth referrals or Angi leads.
What’s a good cost per lead (CPL) for home services?
The “good” CPL depends on the service category:
- Premium services (kitchen, bath, roofing): $350–$500 B2B / $250–$328 B2C
- Standard services (HVAC, landscaping, electrician): $100–$264 B2B / $60–$229 B2C
- High-volume services (plumbing, pest control, cleaning): $76–$100 B2B / $30–$98 B2C
Higher CPLs aren’t always bad. If a kitchen remodel nets $15K+, paying $500 for a lead is profitable.
How can providers lower their CPL without losing quality?
You can cut CPL while keeping lead quality high by:
- Tightening paid search targeting (geo-specific + negative keywords).
- Investing in SEO for long-tail “service + suburb” terms.
- Using fast-loading, persuasive landing pages.
- Adding remarketing campaigns for warm visitors.
- Aligning with sales, so every qualified lead gets closed.
How do sales cycles differ across services?
Sales cycles range widely in home services:
- Emergency services (plumbing, pest control): 1–7 days
- Standard services (HVAC, landscaping, security): 30–90 days
- Premium projects (kitchens, sunrooms, remodels): 60–180 days
That’s why benchmarks matter. A “long” cycle is expected for premium projects, while delays in emergency jobs mean missed revenue.
Can benchmarks help compete in high-CPC markets?
Yes. In markets like Dallas or Houston, where CPCs spike 50–100% above average, benchmarks help determine if your costs align with profitability.
By comparing your CPC, CPL, and CVR against industry averages, you’ll know if it’s worth competing in that market or pivoting to geo-specific niche keywords where ROI is stronger.
Ready to surpass the benchmarks? We’ll make sure you do.
Every missed call, overpriced lead, or slow follow-up is lost revenue. By aligning with proven home services marketing benchmarks, you’ll know exactly where your marketing is working, where it’s leaking, and how to keep your crews booked solid.
At WebFX, we help home services providers turn every marketing dollar into measurable ROI. With 6.7M+ qualified leads delivered and $607M+ generated for businesses like yours, our benchmark-driven strategies consistently raise the bar.
Don’t just chase benchmarks. Set them with us. Get your free proposal or call 888-601-5359 to speak with a home services marketing strategist today!
Data sources & methodology
- Proprietary data: Analysis of 24 home services sub-industries from a verified marketing performance database, including verified CPL, conversion rates, margins, and sales cycle data.
- Ahrefs keyword research: Analysis of 25+ high-volume commercial intent keywords with search volume, competition, and CPC data for the US market.
- Community insights: Analysis of practitioner discussions on Reddit and other professional forums, surfacing real-world challenges and successful strategies.
- Report limitations: Data reflects primarily US market conditions. Individual business results may vary based on local competition, service quality, and execution effectiveness. CPC ranges are averages and can fluctuate significantly based on seasonality and market conditions.
-
 Albert Dandy Velasquez blends SEO strategy with compelling storytelling to help businesses boost their visibility and revenue online. With a B.A. in English and certifications from HubSpot, Semrush, and Google Analytics, he has written and optimized hundreds of articles on organic SEO, content strategy, and user experience. He regularly contributes to the WebFX blog and SEO.com, creating content that helps readers turn marketing goals into measurable results. When he’s off the clock, he’s usually exploring new neighborhoods on two wheels, filming travel content, or chasing golden hour with a coffee in hand.
 -

WebFX is a full-service marketing agency with 1,100+ client reviews and a 4.9-star rating on Clutch! Find out how our expert team and revenue-accelerating tech can drive results for you! Learn more
Try our free Marketing Calculator
Craft a tailored online marketing strategy! Utilize our free Internet marketing calculator for a custom plan based on your location, reach, timeframe, and budget.
Plan Your Marketing Budget
Table of Contents
- What are home services marketing benchmarks (and why do they matter)?
- Key home services marketing benchmarks providers must track
- 2026 home services marketing benchmarks snapshot
- Lead generation & cost benchmarks
- Conversion & performance benchmarks
- Search landscape & keyword insights
- Community insights & market reality
- Competitive landscape analysis
- Strategic recommendations & budget allocation
- FAQs about home services marketing benchmarks
- Ready to surpass the benchmarks? We’ll make sure you do.
Share this article

Looking for More?
Get expert ideas, industry updates, case studies, and more straight to your inbox to help you level up and get ahead.
"*" indicates required fields

Try our free Marketing Calculator
Craft a tailored online marketing strategy! Utilize our free Internet marketing calculator for a custom plan based on your location, reach, timeframe, and budget.
Plan Your Marketing Budget