

Table of Contents
- Seasonal search trends by service category
- 1. HVAC services seasonality patterns
- 2. Plumbing services seasonality patterns
- 3. Electrical services seasonality patterns
- 4. Roofing services seasonality patterns
- How seasonality shapes the home services market (across categories)
- HVAC dominates the extremes
- Plumbing runs on weather pressure, not just usage
- Electrical demand stays steady and reliable
- Roofing remains the most predictable category
- Turning seasonal search data into a year-round marketing plan
- 1. Use seasonal data to set your marketing calendar
- 2. Balance short-term PPC with long-term SEO
- 3. Automate with real-time triggers
- 4. Localize campaigns for regional climates
- 5. Keep off-season revenue flowing
- FAQs on seasonal search trends in home services
- Make every season your peak season
- Data source & methodology
- How does HVAC demand vary by season? HVAC services show the sharpest seasonal swings (250–600% variance), with AC repair surging 266% in July during heatwaves and furnace repair peaking 137% in January during cold snaps, making weather-triggered campaigns essential.
- When do plumbing searches peak throughout the year? Plumbing demand spikes twice annually — mid-summer due to heavy usage (emergency plumber searches up 191%) and winter when frozen pipe repair searches skyrocket 609% in January, requiring flexible budgets for both seasons.
- Why is electrical service demand more stable? Electrical services maintain the most consistent search patterns with only 20–34% variance year-round, making keywords like “electrician near me” and “electrical panel upgrade” ideal for always-on SEO strategies rather than seasonal PPC campaigns.
- How should contractors prepare for seasonal shifts? Launch campaigns 30–45 days before peak seasons (AC ads by March, heating by September), automate bid adjustments based on weather triggers (85°F+ for AC, below 40°F for heating), and use evergreen content to maintain off-season revenue.
- What’s the key to year-round home services revenue? Balance high-volatility emergency keywords in short PPC bursts during peak seasons with steady SEO investment in consistent performers, while offering maintenance bundles and pre-season inspections to fill calendars during slow months.
Fast facts: Seasonal search trends in home services demand
- HVAC swings hardest: “AC repair” climbs +266% from February to July, while “heating system repair” spikes +594% in fall, so plan campaigns around weather, not the calendar.
- Plumbing peaks twice: “Plumber near me” jumps +36% in summer and “frozen pipe repair” surges +609% in winter. Budgeting for both extremes is ideal to capture high-intent leads.
- Electrical stays steady: “Electrical panel upgrade” (+23%) and “outlet not working” (+34%) searches barely move. Invest in evergreen SEO and educational content here.
- Roofing fluctuates moderately: With most queries shifting under 70% and “roof repair near me” peaking +24% in September, roofing may look less volatile, but it’s not immune to seasonality. Keep SEO steady and run seasonal PPC to stay booked.
Your phone rings nonstop in July. By October, it barely buzzes.
If you run a home services business, this pattern might be familiar to you. One month, you’re turning down HVAC jobs because you’re booked solid. The next, you’re scrambling to fill the calendar. This isn’t bad luck or poor planning. It’s just the reality of seasonal demand patterns in home services.
You already know the drill. When demand peaks, so does everything else (clicks, conversions, and competition). When it drops, so does your revenue. So how do you break the cycle? Simple. By aligning your marketing with real homeowner search behavior.
If you want to escape this feast-or-famine rollercoaster and start earning more jobs year-round, this comprehensive analysis is for you. We’ll break down seasonal search shifts in home services demand to help you understand:
- When home service keywords in HVAC, roofing, electrical, and plumbing actually peak
- How home services seasonality trends should influence your marketing strategy
- How you can plan campaigns that keep your crews busy (even in the slow seasons)
Keep reading to find out what spikes when, why timing is everything in home services marketing, and how you can turn seasonality into a steady stream of leads all year long.
🎥 Video: How to beat the home services seasonal slump with your marketing
Seasonal search trends by service category
Not every home service follows the same calendar. Some spike with the weather. Others surge on pure panic. To figure out exactly when homeowners are searching, we analyzed the top U.S. home service queries over the past year using Ahrefs Keywords Explorer. Here’s what we found for each category:
1. HVAC services seasonality patterns
HVAC demand swings sharply between cooling and heating seasons. This chart shows how searches for top HVAC services rise and fall throughout the year, revealing exactly when homeowners are searching for repairs, maintenance, or emergency help.
HVAC services seasonality patterns
| Label | AC Repair | Furnace Repair | HVAC Repair | Emergency AC Repair |
|---|---|---|---|---|
| Jan 2023 | 24816 | 58523 | 19637 | 2087 |
| Feb 2023 | 26597 | 54120 | 18576 | 1475 |
| Mar 2023 | 28453 | 44896 | 17540 | 1778 |
| Apr 2023 | 39818 | 37646 | 19960 | 2326 |
| May 2023 | 56641 | 31358 | 22269 | 2991 |
| Jun 2023 | 72781 | 28865 | 25471 | 4103 |
| Jul 2023 | 94937 | 36630 | 32296 | 7468 |
| Aug 2023 | 69747 | 30855 | 25546 | 5223 |
| Sep 2023 | 39730 | 35960 | 19919 | 4081 |
| Oct 2023 | 30430 | 47270 | 19944 | 2916 |
| Nov 2023 | 25331 | 61712 | 19216 | 2443 |
| Dec 2023 | 22137 | 53332 | 16916 | 1615 |
| Jan 2024 | 27597 | 66261 | 24331 | 1741 |
| Feb 2024 | 23456 | 38505 | 18445 | 2196 |
| Mar 2024 | 29953 | 40173 | 18401 | 2754 |
| Apr 2024 | 40912 | 29250 | 19829 | 2382 |
| May 2024 | 62288 | 21398 | 26926 | 4267 |
| Jun 2024 | 84216 | 24432 | 34423 | 7418 |
| Jul 2024 | 88442 | 22976 | 36438 | 7419 |
| Aug 2024 | 70353 | 22971 | 35169 | 5944 |
| Sep 2024 | 51226 | 32556 | 36059 | 4508 |
| Oct 2024 | 35338 | 41943 | 30475 | 7090 |
| Nov 2024 | 35144 | 48102 | 27885 | 15671 |
| Dec 2024 | 33573 | 61397 | 29045 | 3724 |
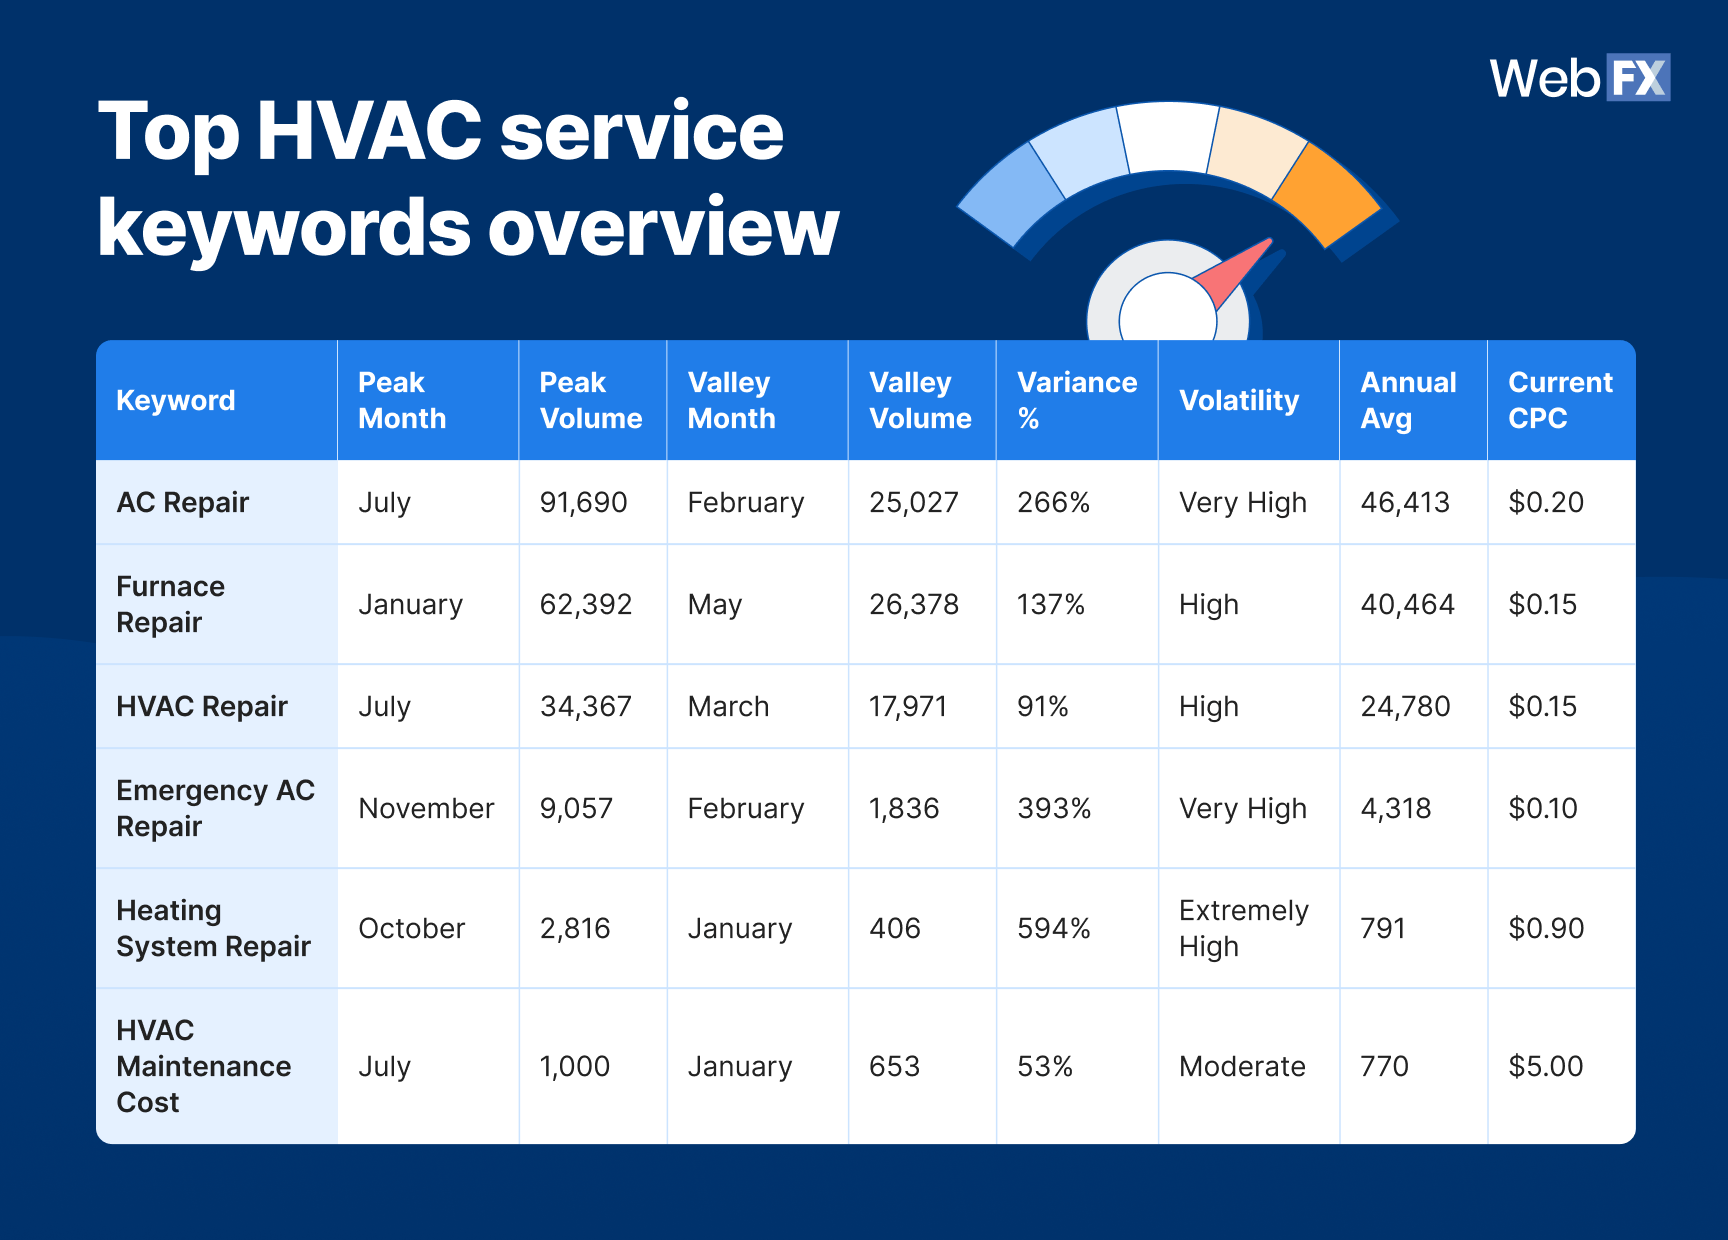
Top HVAC service keywords overview
Source data
| Keyword | Peak Month | Peak Volume | Valley Month | Valley Volume | Variance % | Volatility | Annual Avg | Current CPC |
| AC Repair | July | 91,690 | February | 25,027 | 266% | Very High | 46,413 | $0.20 |
| Furnace Repair | January | 62,392 | May | 26,378 | 137% | High | 40,464 | $0.15 |
| HVAC Repair | July | 34,367 | March | 17,971 | 91% | High | 24,780 | $0.15 |
| Emergency AC Repair | November | 9,057 | February | 1,836 | 393% | Very High | 4,318 | $0.10 |
| Heating System Repair | October | 2,816 | January | 406 | 594% | Extremely High | 791 | $0.90 |
| HVAC Maintenance Cost | July | 1,000 | January | 653 | 53% | Moderate | 770 | $5.00 |
HVAC services seasonality index comparison
Key insights
- Dual weather extremes shape demand: “AC repair surges” +266% in July, while “furnace repair” dominates January with +137% variance, proving HVAC demand still revolves around temperature spikes and drops.
- “Heating system repair” shows the sharpest volatility: With a massive +594% variance between October highs and January lows, it’s the most weather-sensitive term, perfect for reactive campaigns tied to cold snaps.
- Emergency searches remain high-converting: “Emergency AC repair” jumps nearly +400% from winter to late fall, capturing urgent, ready-to-book intent that benefits from Local Service Ads and same-day pay-per-click (PPC) offers.
- “HVAC repair” and maintenance terms steady the baseline: Their moderate-to-high stability (53–91% range) provides a reliable year-round search engine optimization (SEO) foundation for evergreen guides, tune-up pages, and retainer content.
Actionable takeaways
- Pre-season wins early leads: Launch cooling-related campaigns in March–April and pivot to heating-focused ones by September–October to catch both demand waves ahead of the curve.
- Segment by volatility for smarter spend: Use high-volatility keywords (“AC repair”, “emergency AC repair”, “heating system repair”) in short, weather-triggered PPC bursts. Anchor organic visibility on steady performers (“HVAC repair”, “HVAC maintenance cost”) for long-term ROI.
- Automate campaigns around weather data: Integrate bid adjustments or CRM triggers based on local temperature thresholds (e.g., +85°F for AC ads, below 45°F for furnace promos).
- Use off-season to cross-sell and retain: Offer tune-up specials and “comfort check” bundles in mild months (April/October) through email campaigns and social posts to smooth revenue dips and fill tech schedules.
2. Plumbing services seasonality patterns
When it comes to seasonal search trends in home services for plumbers, plumbing searches follow the weather, peaking during heavy summer usage and again in winter when pipes freeze and burst. This chart illustrates how searches for key plumbing services surge and dip throughout the year.
Plumbing services seasonality patterns
| Label | Plumber Near Me | Water Heater Repair | Emergency Plumber | Frozen Pipe Repair |
|---|---|---|---|---|
| Jan 2023 | 189143 | 28268 | 16373 | 419 |
| Feb 2023 | 179369 | 24750 | 18312 | 691 |
| Mar 2023 | 198589 | 24847 | 16476 | 364 |
| Apr 2023 | 190478 | 26060 | 15130 | 299 |
| May 2023 | 226013 | 26571 | 17488 | 245 |
| Jun 2023 | 216698 | 28353 | 18565 | 186 |
| Jul 2023 | 257442 | 31727 | 67795 | 162 |
| Aug 2023 | 196992 | 30649 | 18595 | 113 |
| Sep 2023 | 153884 | 30470 | 15552 | 124 |
| Oct 2023 | 168188 | 24808 | 16549 | 147 |
| Nov 2023 | 166202 | 27037 | 21553 | 259 |
| Dec 2023 | 149265 | 29260 | 22501 | 413 |
| Jan 2024 | 171472 | 34658 | 23665 | 1893 |
| Feb 2024 | 137613 | 26781 | 16563 | 238 |
| Mar 2024 | 135879 | 25630 | 19101 | 283 |
| Apr 2024 | 138616 | 26966 | 16064 | 282 |
| May 2024 | 132551 | 26277 | 16084 | 195 |
| Jun 2024 | 153511 | 26186 | 19562 | 230 |
| Jul 2024 | 165197 | 32742 | 22940 | 204 |
| Aug 2024 | 159171 | 31646 | 23553 | 212 |
| Sep 2024 | 156025 | 29481 | 23568 | 276 |
| Oct 2024 | 159779 | 31796 | 27523 | 566 |
| Nov 2024 | 157498 | 39395 | 33729 | 456 |
| Dec 2024 | 160439 | 41661 | 28629 | 651 |
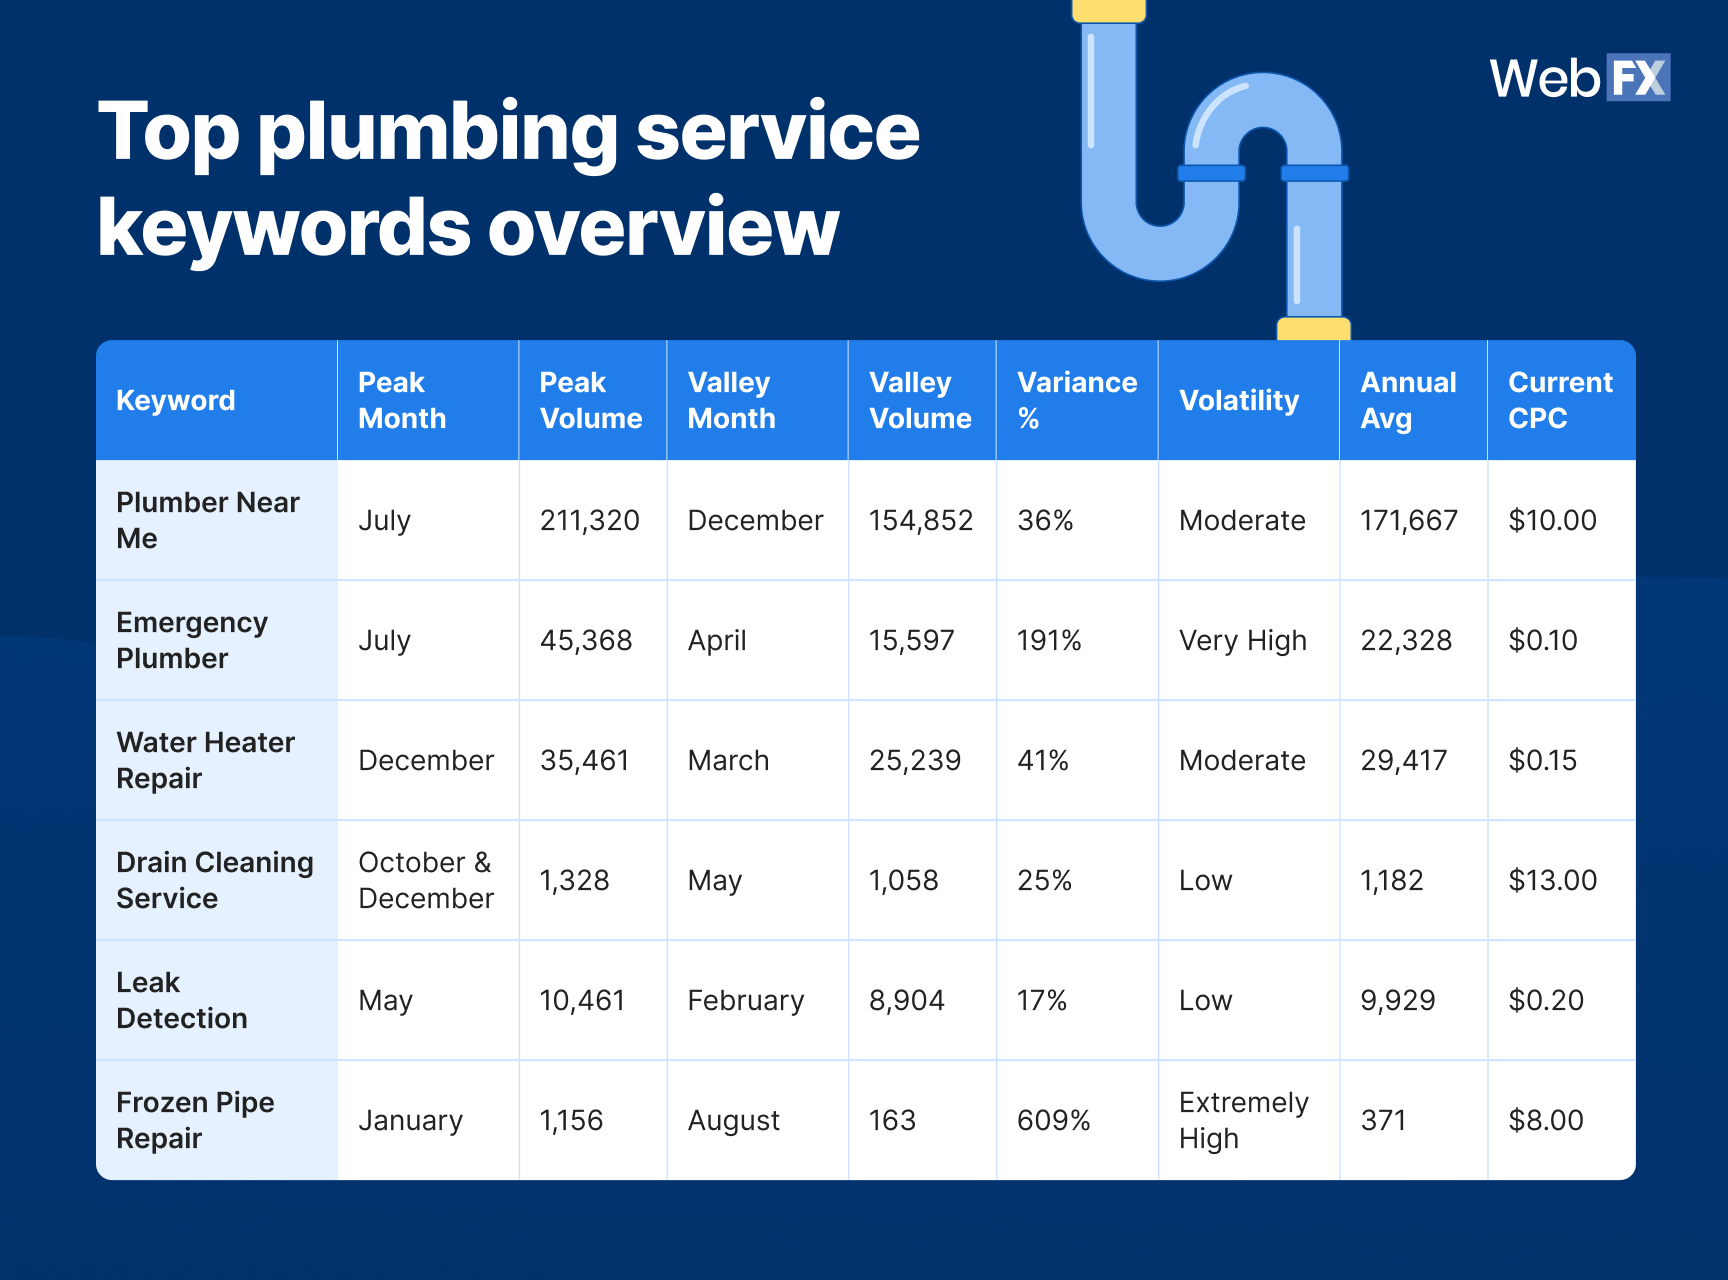
Top plumbing service keywords overview
Source data
| Keyword | Peak Month | Peak Volume | Valley Month | Valley Volume | Variance % | Volatility | Annual Avg | Current CPC |
| Plumber Near Me | July | 211,320 | December | 154,852 | 36% | Moderate | 171,667 | $10.00 |
| Emergency Plumber | July | 45,368 | April | 15,597 | 191% | Very High | 22,328 | $0.10 |
| Water Heater Repair | December | 35,461 | March | 25,239 | 41% | Moderate | 29,417 | $0.15 |
| Drain Cleaning Service | October & December | 1,328 | May | 1,058 | 25% | Low | 1,182 | $13.00 |
| Leak Detection | May | 10,461 | February | 8,904 | 17% | Low | 9,929 | $0.20 |
| Frozen Pipe Repair | January | 1,156 | August | 163 | 609% | Extremely High | 371 | $8.00 |
Plumbing services seasonality index comparison
Key insights
- Two weather-driven surges dominate plumbing search: “Plumber near me” peaks mid-summer (+36%), while “frozen pipe repair” skyrockets +609% in January, showing how both heat and freezing temps stress plumbing systems differently.
- Emergency queries remain the high-intent driver: “Emergency plumber” searches soar +191% from April to July, representing real-time service calls with the fastest conversion potential for PPC or Google Local Services Ads.
- Utility-based keywords show winter resilience: “Water heater repair” maintains steady demand through colder months (only 41% variance), ideal for evergreen service visibility and retargeting.
- Evergreen maintenance terms support SEO consistency: “Leak detection” and “drain cleaning service” maintain the lowest volatility (≤25%), providing steady, low-season organic traffic anchors for plumbing businesses.
Actionable takeaways
- Sync ad spend with seasonal extremes: Boost “frozen pipe repair” and “water heater repair” bids in November–January. Push “emergency plumber” and “plumber near me” campaigns between June–August when summer pipe strain peaks.
- Build evergreen content pillars: Create optimized landing pages or blogs around “drain cleaning service” and “leak detection” to maintain visibility during slow months and strengthen topical authority.
- Capitalize on urgency with automation: Set up weather-triggered PPC scripts to elevate emergency plumbing bids when local temperatures fall below freezing or spike above 90°F.
- Diversify revenue in shoulder months: Offer pre-winter inspections or spring tune-ups to smooth revenue dips, promote maintenance plans, and keep crews booked year-round. Use short social videos or newsletters highlighting winter plumbing tips to drive engagement during slow months.
3. Electrical services seasonality patterns
What about seasonal search trends in home services for electricians?Electrical demand stays fairly steady year-round, but spikes during renovation season and winter power outages. Here’s how homeowner searches for common electrical services shift across the calendar.
Electrical services seasonality patterns
| Label | Electrician Near Me | Emergency Electrician | Electrical Panel Upgrade | Circuit Breaker Repair |
|---|---|---|---|---|
| Jan 2023 | 100332 | 2912 | 4304 | 361 |
| Feb 2023 | 94953 | 2948 | 4525 | 299 |
| Mar 2023 | 95858 | 2754 | 4044 | 1977 |
| Apr 2023 | 92345 | 2524 | 4139 | 388 |
| May 2023 | 103886 | 3352 | 3817 | 3565 |
| Jun 2023 | 108733 | 3580 | 3851 | 2493 |
| Jul 2023 | 116693 | 4332 | 4246 | 2973 |
| Aug 2023 | 110574 | 3527 | 4215 | 2802 |
| Sep 2023 | 100815 | 3494 | 3530 | 2275 |
| Oct 2023 | 95978 | 3102 | 3274 | 2490 |
| Nov 2023 | 102176 | 3917 | 3649 | 1904 |
| Dec 2023 | 93718 | 4345 | 3644 | 3905 |
| Jan 2024 | 100797 | 4789 | 4033 | 2683 |
| Feb 2024 | 95125 | 5374 | 3353 | 2865 |
| Mar 2024 | 90703 | 4708 | 3652 | 385 |
| Apr 2024 | 97757 | 4213 | 3934 | 1570 |
| May 2024 | 102951 | 4694 | 3731 | 2679 |
| Jun 2024 | 112425 | 5225 | 4010 | 2620 |
| Jul 2024 | 119169 | 5256 | 4699 | 2901 |
| Aug 2024 | 114489 | 5499 | 4212 | 2458 |
| Sep 2024 | 109347 | 5525 | 3725 | 1928 |
| Oct 2024 | 104933 | 6006 | 4643 | 1559 |
| Nov 2024 | 104722 | 13303 | 4924 | 1367 |
| Dec 2024 | 99113 | 13205 | 4143 | 1943 |
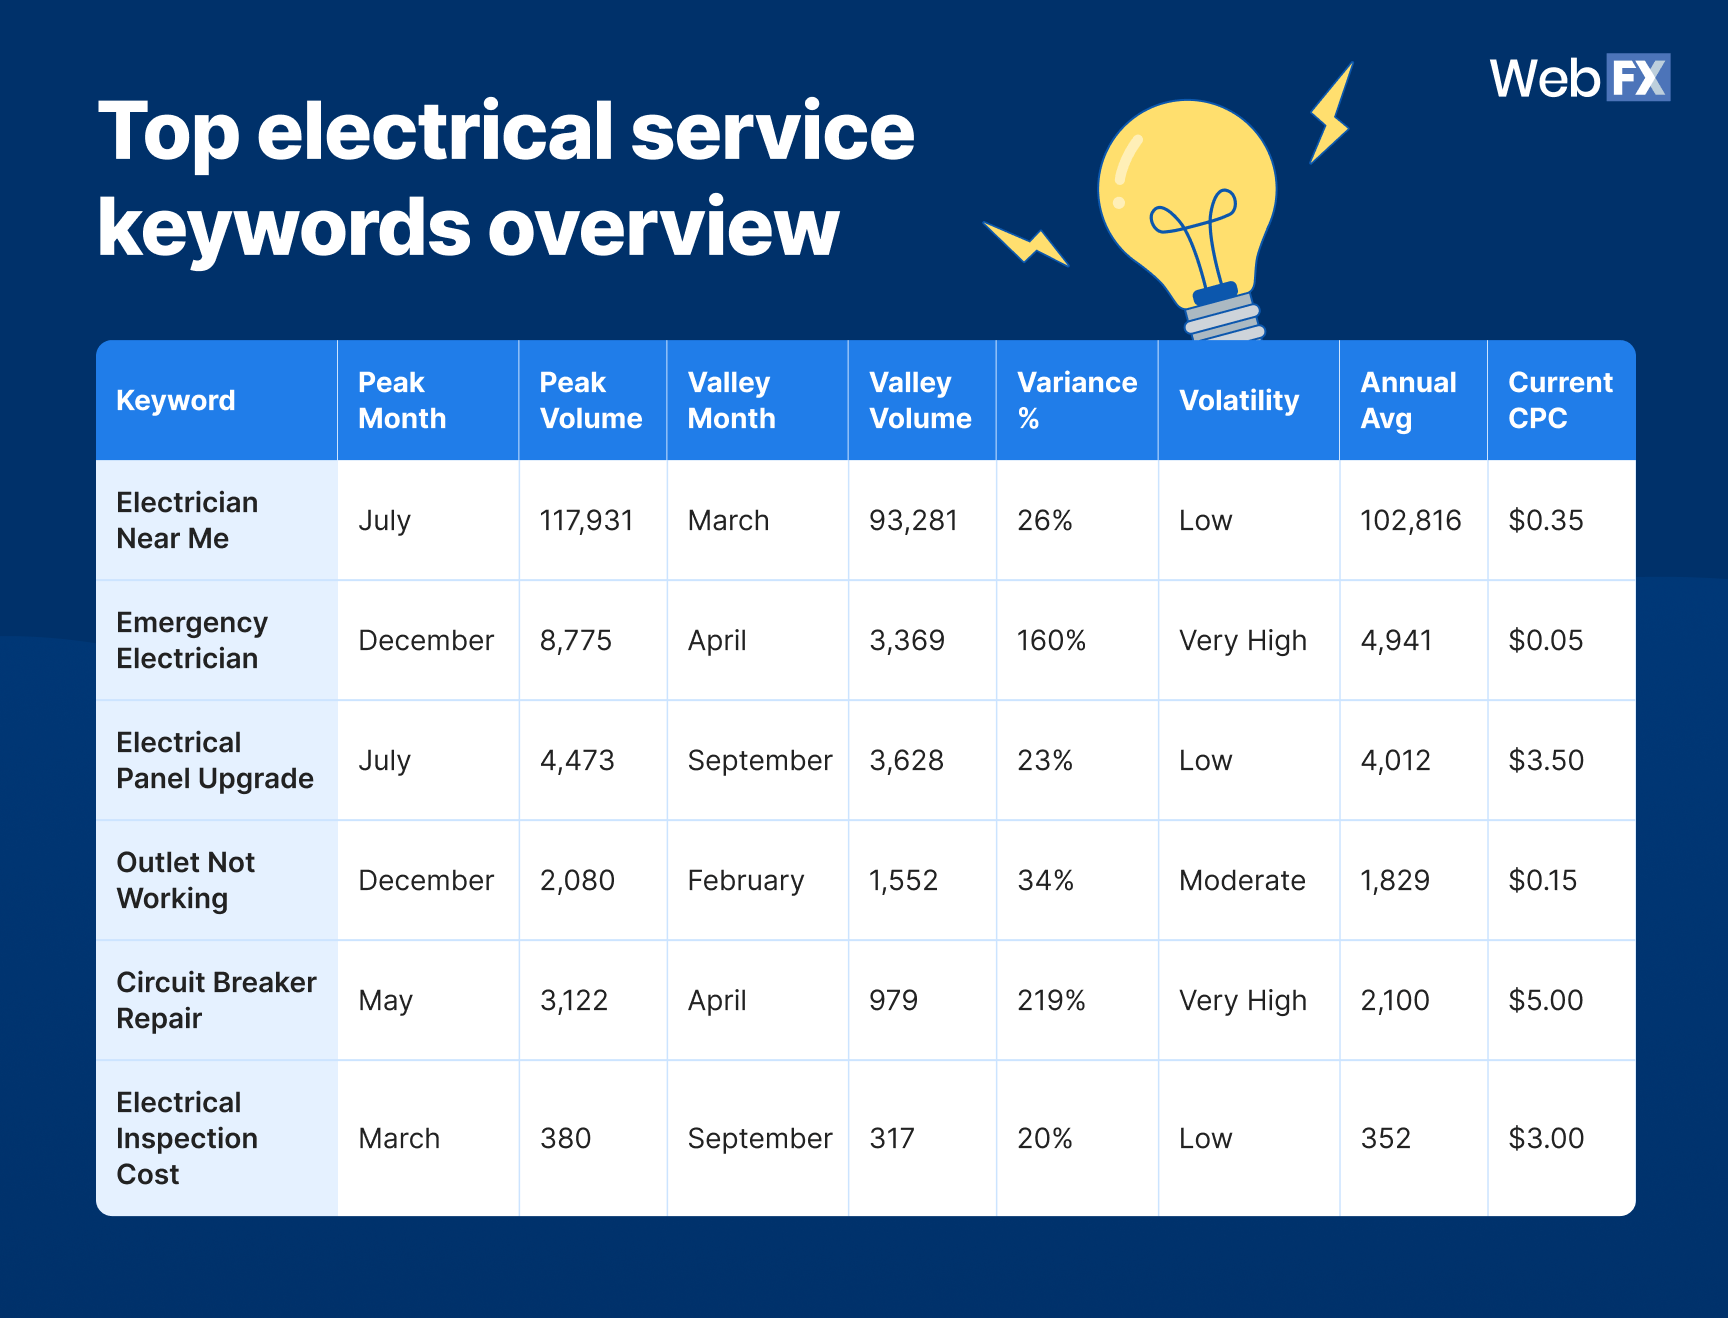
Top electrical service keywords overview
Souce data
| Keyword | Peak Month | Peak Volume | Valley Month | Valley Volume | Variance % | Volatility | Annual Avg | Current CPC |
| Electrician Near Me | July | 117,931 | March | 93,281 | 26% | Low | 102,816 | $0.35 |
| Emergency Electrician | December | 8,775 | April | 3,369 | 160% | Very High | 4,941 | $0.05 |
| Electrical Panel Upgrade | July | 4,473 | September | 3,628 | 23% | Low | 4,012 | $3.50 |
| Outlet Not Working | December | 2,080 | February | 1,552 | 34% | Moderate | 1,829 | $0.15 |
| Circuit Breaker Repair | May | 3,122 | April | 979 | 219% | Very High | 2,100 | $5.00 |
| Electrical Inspection Cost | March | 380 | September | 317 | 20% | Low | 352 | $3.00 |
Electrical services seasonality index comparison
Key insights
- Mid-summer demand peaks for core electrical services: “Electrician near me” sees its highest search activity in July (+26%), aligning with increased renovation and repair needs during hot-weather months.
- Emergency and circuit-related searches surge under pressure: “Emergency electrician” (+160%) and “circuit breaker repair” (+219%) experience sharp spikes, indicating outage-driven intent, moments where users are ready to book instantly.
- Panel and outlet queries remain steady and SEO-friendly: With low-to-moderate volatility (20–34%), “electrical panel upgrade” and “outlet not working” offer stable, year-round traffic potential, ideal for blog guides or troubleshooting pages.
- Inspection-related interest is consistently low but reliable: “Electrical inspection cost” maintains nearly flat seasonality, making it a strong evergreen SEO target for informational and awareness-stage queries.
Actionable takeaways
- Prioritize high-intent campaigns during peak stress months: Run “emergency electrician” and “circuit breaker repair” PPC campaigns during late spring to early winter (May–December) to capture storm and overload season demand. Keep ad copy urgency-focused (“24/7 service,” “licensed emergency electrician near you”).
- Balance your SEO with stability: Develop evergreen blog and service pages for “electrical panel upgrade” and “outlet not working” to maintain consistent organic visibility and support conversions year-round.
- Capitalize on inspection intent before busy months: Promote “electrical inspection cost” content or offers during February–April, when homeowners prep for renovation or compliance checks. Pair steady SEO with educational email campaigns like safety checklists before storm season.
- Automate campaign triggers for outages: Use weather or power grid alerts to raise bids on emergency-related keywords, especially valuable during peak storm or summer heatwave periods.
4. Roofing services seasonality patterns
Roofing demand rises with weather extremes, including storm damage in spring and fall, and maintenance before winter. This chart shows how interest in key roofing services has fluctuated over the past year.
Roofing services seasonality patterns
| Label | Roof Repair Near Me | Roof Replacement Cost | Roof Leak Repair | Storm Damage Roof Repair |
|---|---|---|---|---|
| Jan 2023 | 17840 | 10248 | 12373 | 867 |
| Feb 2023 | 15247 | 10427 | 7495 | 739 |
| Mar 2023 | 19148 | 12090 | 8288 | 744 |
| Apr 2023 | 19113 | 12894 | 7027 | 698 |
| May 2023 | 17163 | 12456 | 6212 | 1024 |
| Jun 2023 | 16698 | 12246 | 5805 | 652 |
| Jul 2023 | 19068 | 12255 | 7168 | 1004 |
| Aug 2023 | 17688 | 11854 | 8209 | 1400 |
| Sep 2023 | 17640 | 10494 | 7252 | 1006 |
| Oct 2023 | 16703 | 10251 | 7043 | 1027 |
| Nov 2023 | 16727 | 8118 | 7572 | 1348 |
| Dec 2023 | 16679 | 8113 | 8839 | 1347 |
| Jan 2024 | 21896 | 10609 | 9479 | 1270 |
| Feb 2024 | 17367 | 11565 | 8513 | 1161 |
| Mar 2024 | 19767 | 12244 | 8665 | 1007 |
| Apr 2024 | 19653 | 12635 | 7885 | 1197 |
| May 2024 | 15894 | 13023 | 7389 | 1249 |
| Jun 2024 | 19422 | 12399 | 7138 | 1411 |
| Jul 2024 | 19824 | 14443 | 8902 | 1566 |
| Aug 2024 | 22608 | 13223 | 9796 | 1418 |
| Sep 2024 | 22830 | 12009 | 9292 | 1488 |
| Oct 2024 | 20442 | 12020 | 8974 | 1250 |
| Nov 2024 | 19751 | 9695 | 11281 | 1056 |
| Dec 2024 | 19698 | 9077 | 9469 | 1296 |
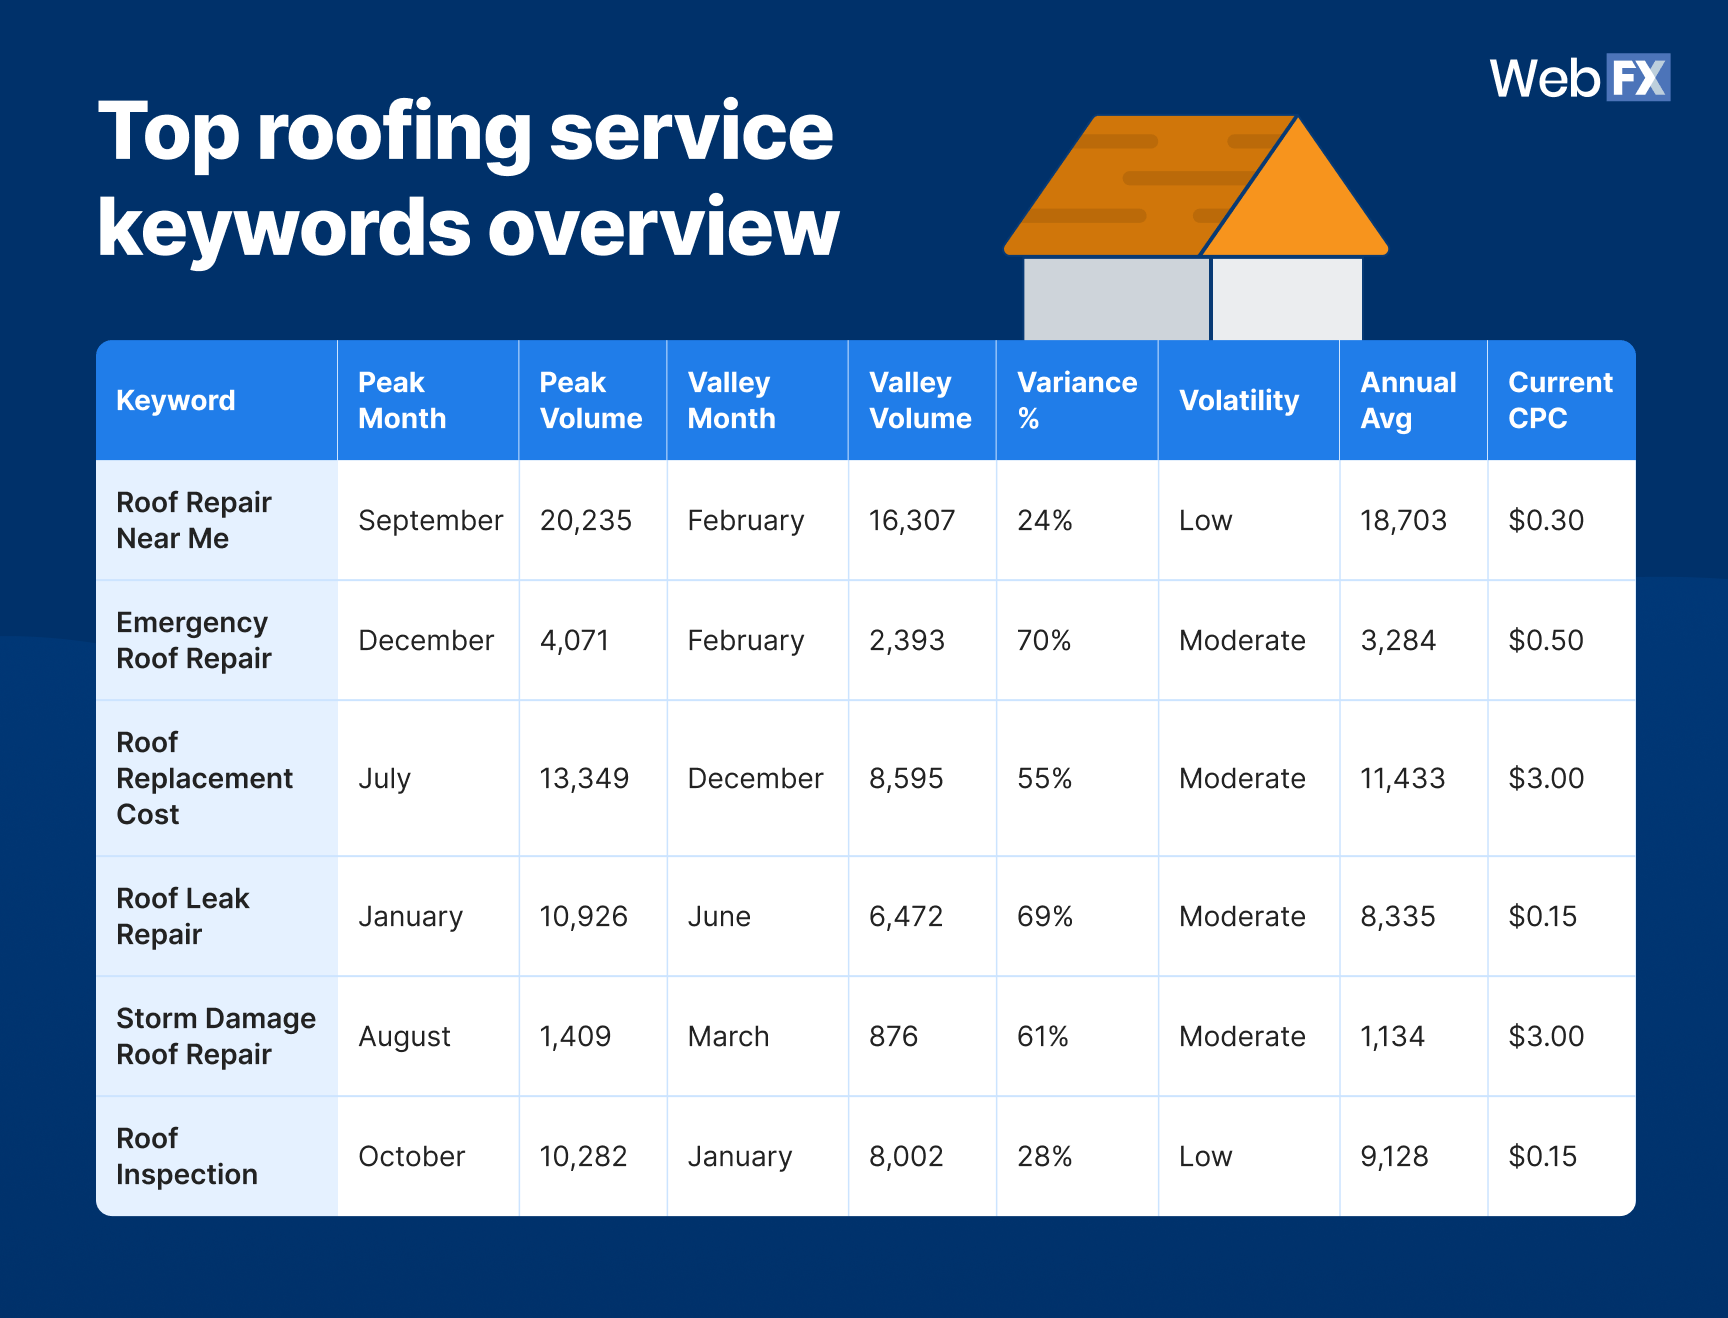
Top roofing service keywords overview
Source data
| Keyword | Peak Month | Peak Volume | Valley Month | Valley Volume | Variance % | Volatility | Annual Avg | Current CPC |
| Roof Repair Near Me | September | 20,235 | February | 16,307 | 24% | Low | 18,703 | $0.30 |
| Emergency Roof Repair | December | 4,071 | February | 2,393 | 70% | Moderate | 3,284 | $0.50 |
| Roof Replacement Cost | July | 13,349 | December | 8,595 | 55% | Moderate | 11,433 | $3.00 |
| Roof Leak Repair | January | 10,926 | June | 6,472 | 69% | Moderate | 8,335 | $0.15 |
| Storm Damage Roof Repair | August | 1,409 | March | 876 | 61% | Moderate | 1,134 | $3.00 |
| Roof Inspection | October | 10,282 | January | 8,002 | 28% | Low | 9,128 | $0.15 |
Roofing services seasonality index comparison
Key insights
- Volatility remains low to moderate overall: Unlike HVAC or plumbing, roofing demand is less extreme, with most keywords fluctuating under 70% variance. This steady behavior supports year-round SEO and consistent retargeting opportunities.
- Roofing searches cluster around maintenance and storm seasons: “Roof repair near me” peaks at +24% variance in September, aligning with post-summer wear and pre-winter prep, while “emergency roof repair” and “storm damage roof repair” both spike after seasonal storms, especially late summer through early winter.
- Repair and leak-related terms reveal urgency trends: “Roof leak repair” (+69%) and “emergency roof repair” (+70%) show consistent seasonal surges driven by heavy rain or storm activity. These users are typically high-intent and ready to call.
- Replacement and inspection keywords show stable, recurring cycles: “Roof replacement cost” (+55%) and “roof inspection” (+28%) fluctuate modestly, reflecting planned projects or annual maintenance, ideal for organic campaigns.
Actionable takeaways
- Plan around storm season spikes: Increase PPC bids for “emergency roof repair” and “roof leak repair” from November–January, when cold-weather conditions and winter storms drive urgent service requests. Share before-and-after visuals or client testimonials on social or email pre- and post-storm to boost trust and referral traffic.
- Use evergreen content for steady leads: Build “roof inspection” and “roof replacement cost” guides with internal links to service pages. These steady performers ensure off-season lead flow and higher SEO authority.
- Leverage retargeting for planned projects: Retarget users who searched “roof inspection” or “replacement cost” with promotional offers (“$500 off roof install”) during mild months when project planning is highest.
- Prioritize SEO campaigns for consistent performers: Focus long-term SEO on “roof repair near me” and “roof inspection”, as both maintain stable, low-volatility demand throughout the year. Optimize these pages for local visibility, add FAQ schema, and continuously update seasonal content to sustain organic conversions.
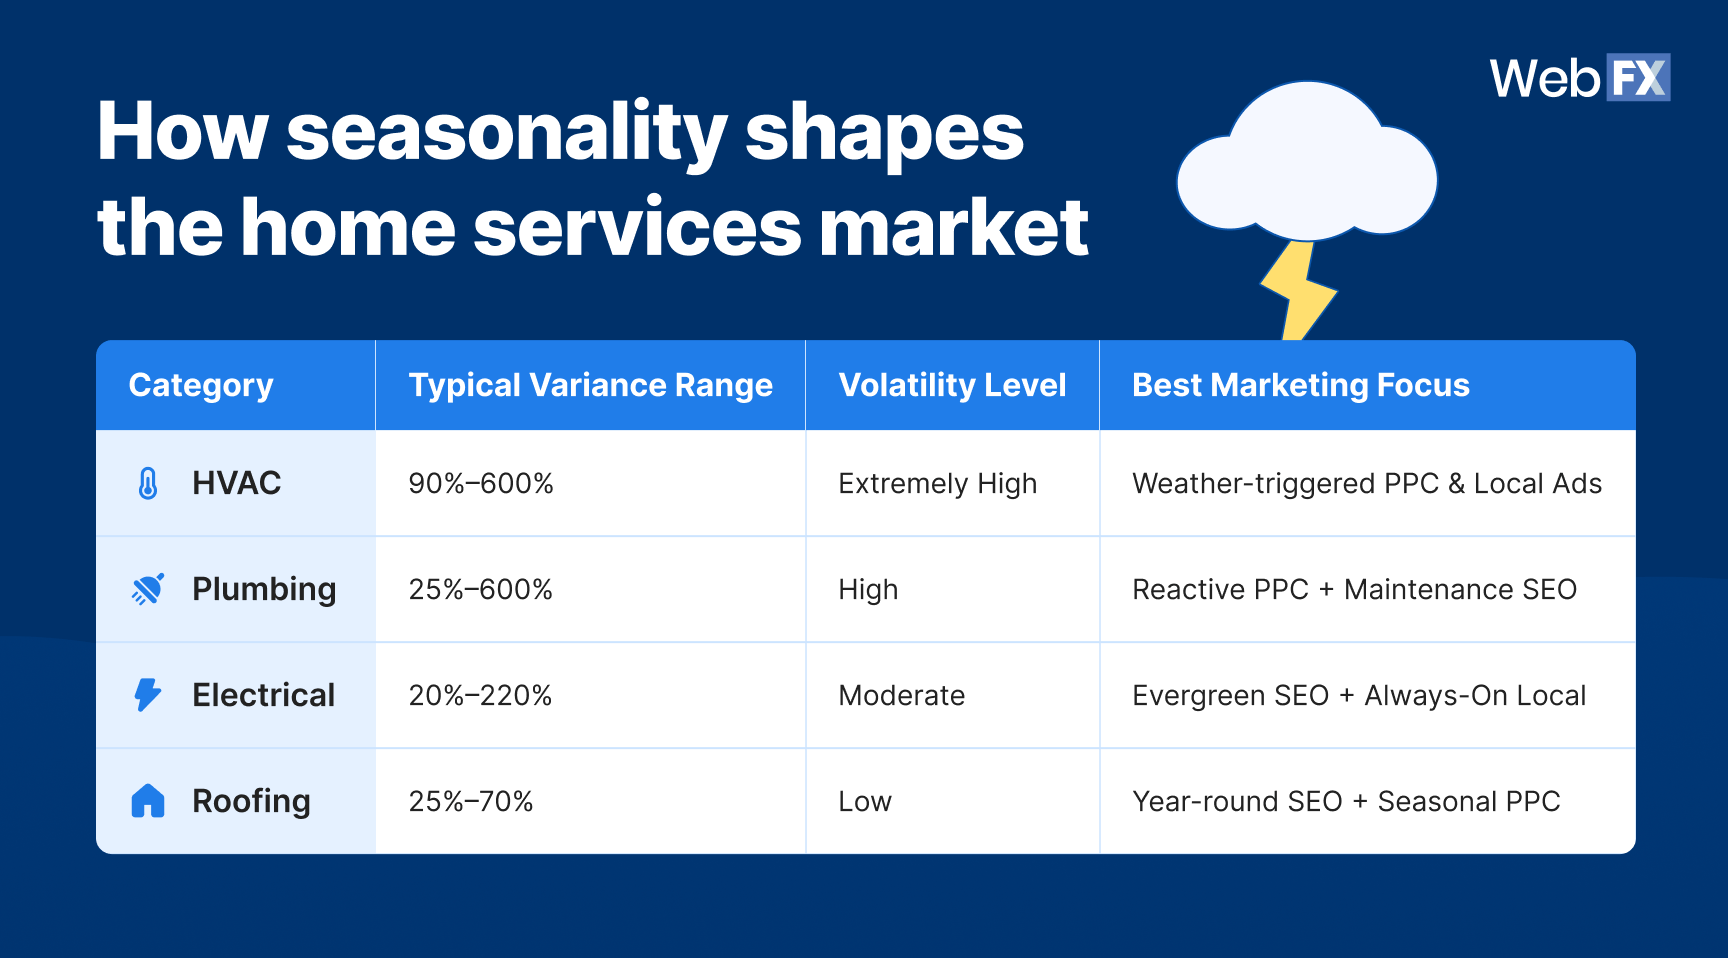
How seasonality shapes the home services market (across categories)
When you step back and look at HVAC, plumbing, electrical, and roofing together, one thing becomes clear: Home services seasonality trends don’t work the same way for everyone. Each trade has its own rhythm, influenced by the weather, how urgent the problem feels, and what’s actually on homeowners’ minds.
Source data
| Category | Typical Variance Range | Volatility Level | Best Marketing Focus |
| HVAC | 90%–600% | Extremely High | Weather-triggered PPC & Local Ads |
| Plumbing | 25%–600% | High | Reactive PPC + Maintenance SEO |
| Electrical | 20%–220% | Moderate | Evergreen SEO + Always-On Local |
| Roofing | 25%–70% | Low | Year-round SEO + Seasonal PPC |
HVAC dominates the extremes
Search demand for heating and cooling services shows the sharpest swings of any category, with peak-to-valley variances regularly exceeding 250–600%. Homeowners don’t wait around when the temperature shifts. Heatwaves send AC repair searches skyrocketing, while cold snaps trigger panic around furnace and heating repairs. HVAC is all about timing, and your ads need to move as fast as the weather.
Plumbing runs on weather pressure, not just usage
Plumbing peaks twice a year, once during heavy summer use, and again when winter freezes pipes. Searches for “emergency plumber” and “frozen pipe repair” spike hard and fast, with high conversion intent but short windows. If your budget can’t flex and your bids aren’t automated, you’ll miss it.
Electrical demand stays steady and reliable
Unlike HVAC and plumbing, electrical services don’t get rattled by the weather. Most searches (from “electrician near me” to “electrical panel upgrades”) fluctuate less than 30%. That consistency makes electrical the perfect category for always-on SEO and long-term local visibility.
Roofing remains the most predictable category
Sure, storms still drive emergency roof repair and storm damage searches, but overall demand stays pretty stable. Roofing peaks usually line up with project planning (spring and late summer), not just emergencies. That gives marketers way more control over timing and budget.
Turning seasonal search data into a year-round marketing plan
Seasonal demand patterns in home services don’t have to mean slow months. The difference between businesses that scramble and those that stay booked year-round comes down to one thing: Planning for the shifts before they happen.
Here’s how to turn this seasonality data into a marketing system that works all year long:
1. Use seasonal data to set your marketing calendar
- Map each service’s peak and valley months from your data.
- Allocate budget before the peak. For example, launch AC repair ads by March, not July.
- Schedule blog content, social pushes, and email sequences to publish 30–45 days before expected surges.
- Put your budget where the pattern is going, not where it’s been.
2. Balance short-term PPC with long-term SEO
- PPC: Focus spend on high-volatility, urgent keywords (“emergency AC repair”, “frozen pipe repair”).
- SEO: Build evergreen visibility around consistent performers (“HVAC repair”, “roof inspection”, “electrical panel upgrade”).
- Combine both: Run branded remarketing campaigns during off-peak months to keep leads warm.
3. Automate with real-time triggers
- Link Google Ads or CRM automations to weather APIs and local temperature data.
- Example: Auto-boost AC repair bids when temps exceed 85°F.
- Trigger furnace or pipe repair ads when temps drop below 40°F.
- Add email workflows for “first cold day” or “heatwave prep” to re-engage customers seasonally.
4. Localize campaigns for regional climates
- Southern markets (e.g., Texas, Florida) may see longer AC demand and shorter heating spikes.
- Northern regions should front-load winter repair and insulation campaigns.
- Use Google Business Profile (GBP) and localized service pages to tailor content to each region’s seasonality.
5. Keep off-season revenue flowing
- Offer maintenance bundles, tune-ups, and pre-season inspections to fill technician calendars.
- Repurpose blog content (“5 Things to Check Before Winter”) into lead magnets and email nurture series.
- Highlight “year-round service” language in ad copy to counter seasonal perception.
Seasonality isn’t a problem. It’s a pattern. When you understand it, you can predict it. When you plan for it, you can profit from it.
FAQs on seasonal search trends in home services
What is seasonality in home services marketing?
Seasonality in home services refers to predictable fluctuations in customer demand that occur at different times of the year, usually tied to weather, climate, and homeowner habits. For example, “AC repair” searches surge in summer while “furnace repair” dominates winter. Understanding these seasonal search trends in home services helps businesses time their SEO, PPC, and staffing decisions around real homeowner intent instead of relying on guesswork.
Which home services are most affected by seasonality?
HVAC tops the list with extreme volatility. Some keywords swing by 500–600% between low and high months. Plumbing comes next, with both summer strain (high water use) and winter pipe bursts driving sharp peaks. Electrical and roofing are steadier, with only 20–70% variance year-round, making them ideal for evergreen SEO and consistent lead generation.
How can I use seasonal data to plan my marketing campaigns?
Start by aligning campaigns with peak search months for your category.
- HVAC pros should launch cooling ads in spring and heating ads in fall.
- Plumbers should push “frozen pipe repair” and “water heater repair” offers in winter.
- Roofers should run “storm damage roof repair” and “roof replacement cost” ads before summer storms.
- Electricians should emphasize “emergency electrician” and “circuit breaker repair” during heavy outage months.
- Balance both: Use short-term PPC bursts alongside evergreen SEO content that keeps your site visible year-round.
How can I stay profitable during slow seasons?
Use your off-season to sell preventive and maintenance services. For instance:
- Offer tune-ups, inspections, or “comfort checks” during mild months (April and October).
- Build evergreen content around stable, low-volatility keywords like “HVAC maintenance cost”, “roof inspection”, or “leak detection”.
- Retarget users who searched peak-season keywords with maintenance reminders or discounts.
This approach smooths your revenue curve and keeps your crews busy all year long.
What’s the best way to automate marketing around seasonal trends?
Use weather-based automations to trigger ads or email campaigns when conditions spike demand. For example:
- Raise bids for “emergency AC repair” when local temperatures hit 85°F+.
- Activate “frozen pipe repair” ads as soon as freeze alerts appear.
- Send SMS marketing or email campaigns promoting inspections right before storms or cold seasons.
Integrating real-time weather data with Google Ads, Meta Ads, or your CRM gives you a first-mover advantage before competitors even react.
Why is seasonality data better than intuition for home service businesses?
Because the data never lies. Most business owners rely on experience to predict busy months, but keyword data reveals exact timing (down to the week) when people start searching. For example, “furnace repair” searches rise weeks before the first frost, and “roof replacement cost” peaks before hurricane season, not after. Using seasonality data transforms your marketing from reactive to predictive, maximizing ROI and scheduling efficiency.

“*” indicates required fields
Make every season your peak season
You shouldn’t have to wait for the AC to break or the pipes to freeze to fill your calendar. The best contractors don’t just react to seasonal spikes; they see them coming, plan around them, and turn predictable patterns into consistent revenue. Because if you’re only making money during the busy months, you’re leaving a lot on the table.
At WebFX, we don’t guess. We use real data and proven strategies to keep your phone ringing year-round. With over 30 years of digital expertise and 380+ home service specialists on our team, we’ve generated 6.7M+ qualified leads and $607M+ in revenue for businesses like yours.
Stop waiting for the busy season to save you. Let’s build one that lasts all year.
Ready to talk strategy? Get your free proposal or call 888-601-5359 to connect with a marketing strategist who actually understands your business.
Data source & methodology
Data Source: Ahrefs Keywords Explorer
Analysis Period: January 2023 – December 2024
Data limitations and considerations:
- All search volumes are U.S. national averages (monthly).
- Values may be rounded for readability; CPC reflects Ahrefs’ current estimates.
- Seasonality insights show aggregate trends; local climate can shift peaks.
-
 Albert Dandy Velasquez blends SEO strategy with compelling storytelling to help businesses boost their visibility and revenue online. With a B.A. in English and certifications from HubSpot, Semrush, and Google Analytics, he has written and optimized hundreds of articles on organic SEO, content strategy, and user experience. He regularly contributes to the WebFX blog and SEO.com, creating content that helps readers turn marketing goals into measurable results. When he’s off the clock, he’s usually exploring new neighborhoods on two wheels, filming travel content, or chasing golden hour with a coffee in hand.
 -

WebFX is a full-service marketing agency with 1,100+ client reviews and a 4.9-star rating on Clutch! Find out how our expert team and revenue-accelerating tech can drive results for you! Learn more
Try our free Marketing Calculator
Craft a tailored online marketing strategy! Utilize our free Internet marketing calculator for a custom plan based on your location, reach, timeframe, and budget.
Plan Your Marketing Budget
Table of Contents
- Seasonal search trends by service category
- 1. HVAC services seasonality patterns
- 2. Plumbing services seasonality patterns
- 3. Electrical services seasonality patterns
- 4. Roofing services seasonality patterns
- How seasonality shapes the home services market (across categories)
- HVAC dominates the extremes
- Plumbing runs on weather pressure, not just usage
- Electrical demand stays steady and reliable
- Roofing remains the most predictable category
- Turning seasonal search data into a year-round marketing plan
- 1. Use seasonal data to set your marketing calendar
- 2. Balance short-term PPC with long-term SEO
- 3. Automate with real-time triggers
- 4. Localize campaigns for regional climates
- 5. Keep off-season revenue flowing
- FAQs on seasonal search trends in home services
- Make every season your peak season
- Data source & methodology
Share this article
Outrank Local Competitors This Season
See how home service pros like you are dominating local Google results and booking more jobs.

Try our free Marketing Calculator
Craft a tailored online marketing strategy! Utilize our free Internet marketing calculator for a custom plan based on your location, reach, timeframe, and budget.
Plan Your Marketing Budget
What to read next