
Table of Contents
- Why Pinterest marketing benchmarks matter for your brand
- 2026 Pinterest marketing benchmarks: The complete breakdown
- Pinterest performance benchmarks
- Pinterest ads benchmarks
- Pinterest visibility benchmarks
- How to turn Pinterest marketing benchmarks into measurable ROI
- 1. Build for longevity, not virality.
- 2. Let cost metrics guide creative strategy.
- 3. Optimize for purchase intent, not engagement vanity.
- FAQs about Pinterest marketing benchmarks
- The benchmarks are pinned. Your strategy needs to be, too.
- Why do Pinterest marketing benchmarks matter for brands? Pinterest benchmarks transform guesswork into strategy by providing competitive intelligence that helps brands distinguish between healthy ad spend and wasted budget, optimize content formats, and turn Pinterest from a content experiment into a predictable revenue channel.
- How do different pin formats affect engagement rates? Idea Pins achieve 0.5–1% engagement rates, outperforming Standard Pins (0.15–0.25%) by up to four times because Pinterest’s algorithm prioritizes native, multi-page storytelling over static images, with niche verticals like food, DIY, and fashion consistently hitting 1–2% save rates.
- What makes Pinterest ads more cost-effective than other platforms? Pinterest ads maintain lower CPCs at $0.50–$1.50 per click compared to Meta’s $1.06–$1.72 and X’s $3–$5 because users actively search for products with purchase intent rather than passively scrolling, resulting in 21–30 day purchase windows and 50% higher average order values.
- How can brands optimize Pinterest content for long-term performance? Brands should audit their last 20 pins to identify the top five with highest save rates, rebuild content around those themes, rotate pin designs weekly to find lowest-CPC winners, and prioritize evergreen content over trending topics for sustained impression growth.
- What visibility metrics indicate successful Pinterest growth? Niche-focused accounts achieve 8–10% monthly follower growth and generate 100k–500k impressions by posting 3–5 high-quality pins that the algorithm redistributes for weeks, with Audience Quality Scores of 60–80 signaling engaged, purchase-ready users rather than passive scrollers.
Pin this: Pinterest marketing benchmarks (fast facts)
- Performance: Pins typically earn a 0.2–0.5% save rate, with food, DIY, and fashion content climbing to 1–2% on average.
- Ads: Expect a $0.50–$1.50 CPC and $0.10–$0.30 CPE, with 2–4% conversion rates from Promoted Pins, and 5–8% for luxury or home goods.
- Visibility: Active accounts hit 100k–500k monthly impressions, while niche brands see 2–5% follower growth monthly (8–10% with consistent pinning).
Your Pinterest ads are running. Your pins are polished and live. But are they actually competitive…or just chaotic?
Most brands treat Pinterest like a guessing game: Pinning whenever inspiration strikes, running ads without knowing their costs, and calling it a win when impressions go up. Meanwhile, they’re watching spend drain on underperforming campaigns and missing conversion opportunities they can’t even measure.
Pinterest performance isn’t subjective. Save rates, cost per click, follower growth, conversion rates: These benchmarks exist, and Pinterest rewards brands that understand the data rather than those just racking up pretty impressions.
Get ready to pin these 2026 Pinterest marketing benchmarks that separate high-converting accounts from forgotten boards. Plus, we’ll arm you with actionable strategies to turn these insights into real returns.
Let’s get to work:
- Why Pinterest marketing benchmarks matter for your brand
- 2026 Pinterest marketing benchmarks: The complete breakdown
- How to turn Pinterest marketing benchmarks into measurable ROI
Don’t miss our Revenue Weekly emails!
Join 200K smart marketers for the hottest marketing news and insights in your inbox.
Inline Subscription Form
“*” indicates required fields

Why Pinterest marketing benchmarks matter for your brand
Pinterest reached an all-time high of 600 million monthly active users in Q3 2025 (up 12% year over year), and 88% of users say they’ve purchased something they discovered on the platform.
Pinterest users don’t scroll merely to kill time. They plan. They research. They curate boards for weddings, home renovations, seasonal wardrobes, and major purchases that take weeks to finalize. That means, when they click through to your site, they’re actually closer to buying than users on any other platform.
That intent-driven behavior creates a massive opportunity, but only if you know how to measure it. Without benchmarks, you can’t tell if your save rate signals strong content or creative fatigue. You can’t distinguish between healthy ad spend and wasted budget. You’re optimizing in the dark.
Benchmarking your Pinterest performance gives you competitive intelligence that turns guesswork into strategy. When you understand which pin formats drive the strongest engagement, you stop wasting creative resources on underperformers. When you know what follower growth looks like for accounts in your niche, you can identify whether your content strategy needs a course correction or just more time to build momentum.
The brands winning on Pinterest don’t rely on gut feelings. They track their metrics against industry standards, spot the gaps, and adjust before those gaps become expensive problems. Benchmarks transform Pinterest from a content experiment into a predictable revenue channel.
2026 Pinterest marketing benchmarks: The complete breakdown
Every successful Pinterest strategy balances three critical areas: How your content performs organically, how efficiently your ads convert, and how effectively you’re growing your audience. The benchmarks below break down exactly where your metrics should land across all three.

Here’s what we’ll cover:
- Pinterest performance benchmarks: Save rate, CTR, engagement by format, and earned engagement rate
- Pinterest ads benchmarks: CPC, CPE, conversion rate, AOV, and time to purchase window
- Pinterest visibility benchmarks: Follower growth rate, monthly impressions, and audience quality score
Pinterest performance benchmarks
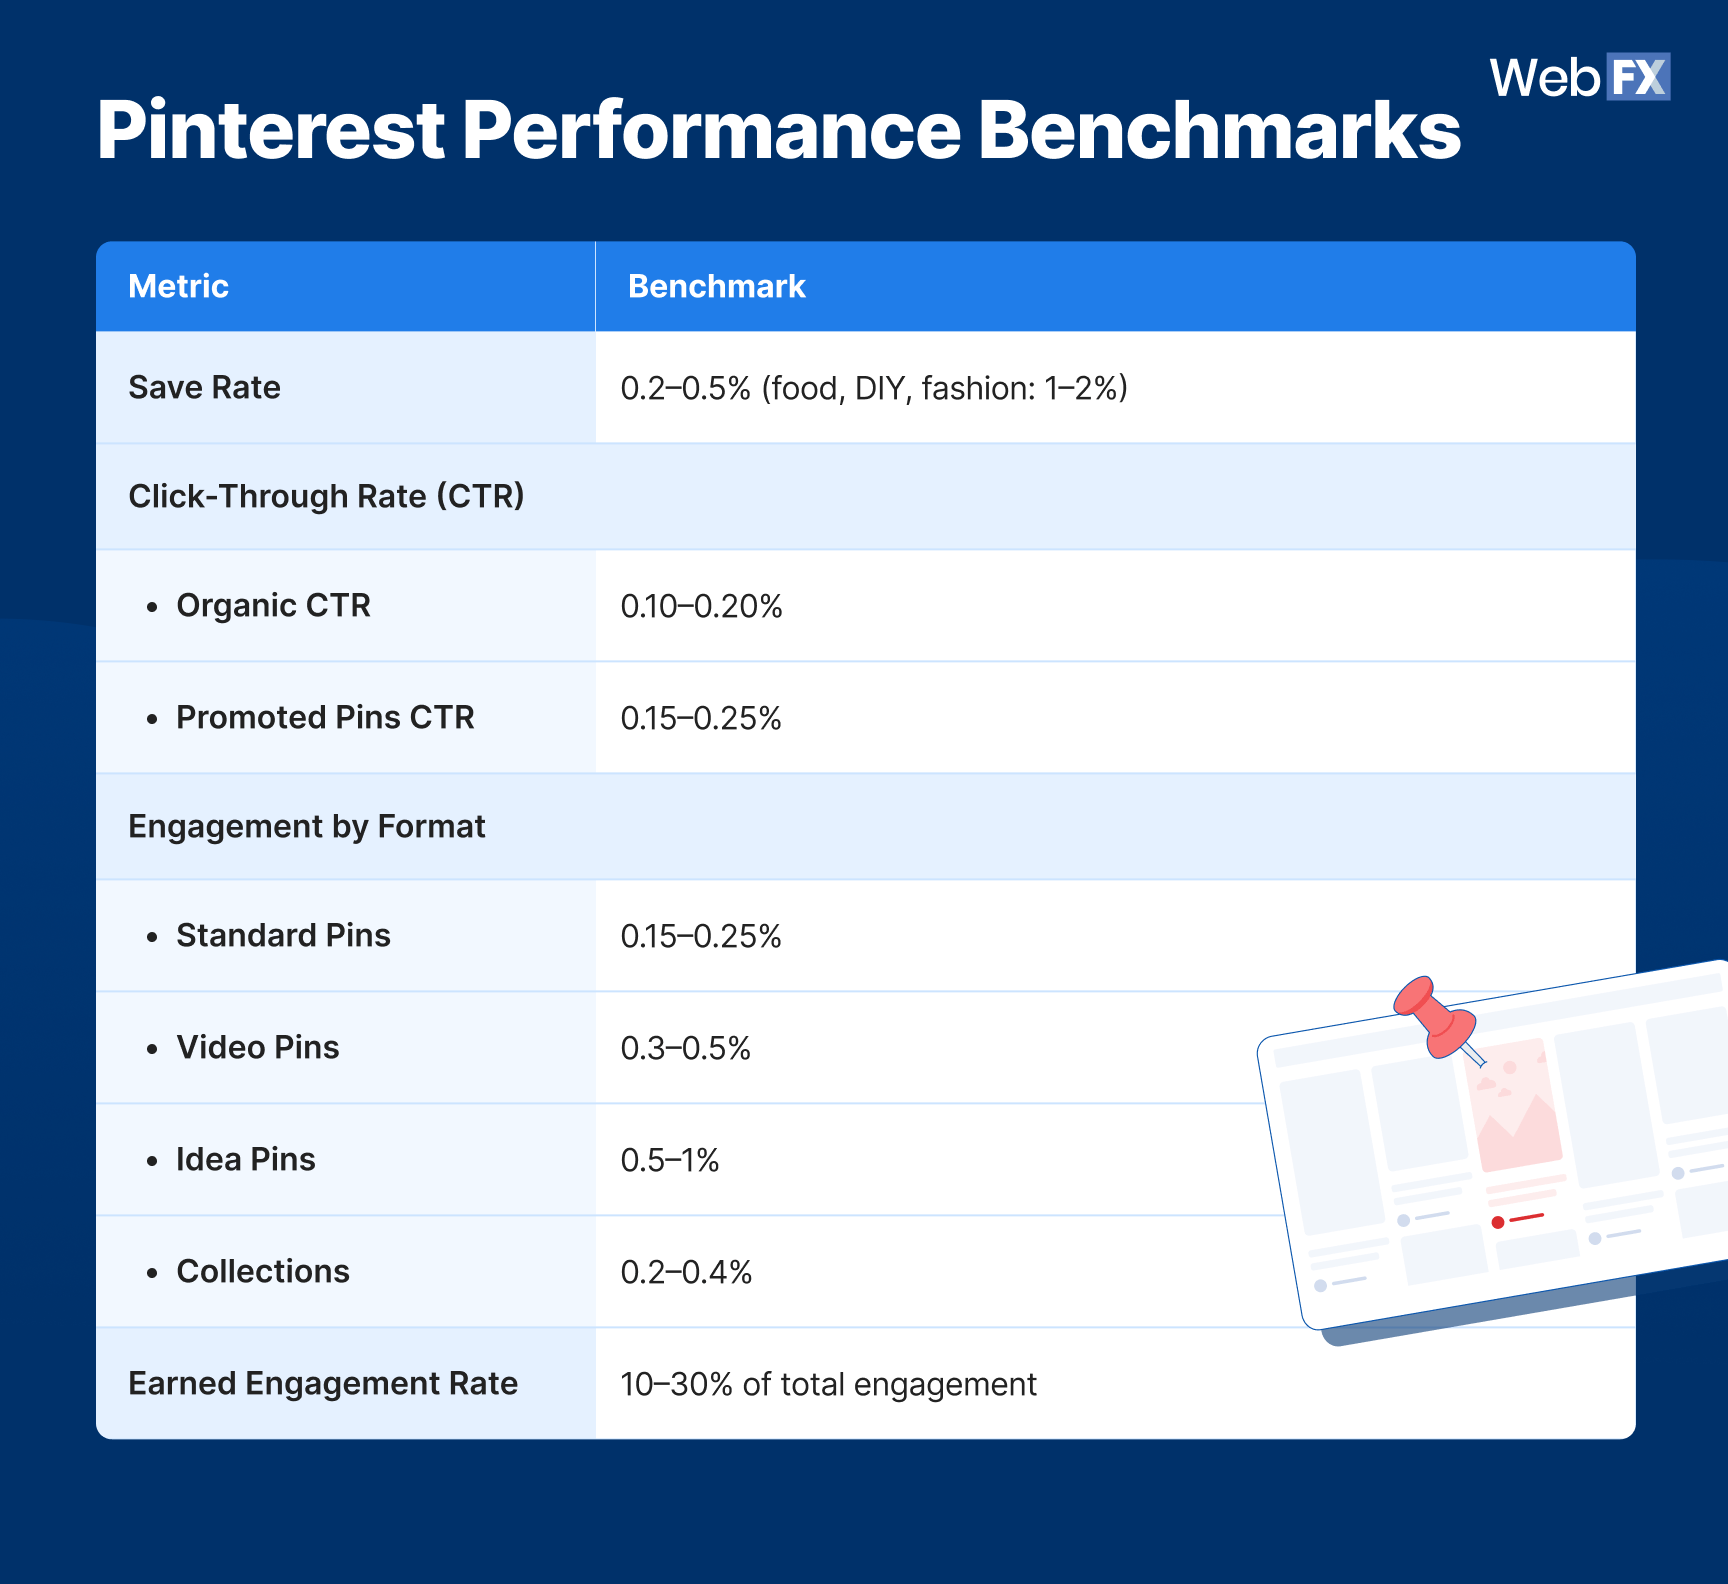
Your organic performance reveals whether your Pinterest pins spark action, earn saves, and build real visibility over time. These Pinterest performance benchmarks give you a clear baseline for evaluating whether your content is driving meaningful engagement or getting lost in the scroll.
Source data
| Metric | Benchmark |
| Save Rate | 0.2–0.5% (food, DIY, fashion: 1–2%) |
| Click-Through Rate (CTR) | |
|
0.10–0.20% |
|
0.15–0.25% |
| Engagement by Format | |
|
0.15–0.25% |
|
0.3–0.5% |
|
0.5–1% |
|
0.2–0.4% |
| Earned Engagement Rate | 10–30% of total engagement |
Key insights
- Content format dictates performance. Idea Pins (0.5–1% engagement) outperform Standard Pins (0.15–0.25%) by up to four times because Pinterest’s algorithm prioritizes native, multi-page storytelling over static images.
- Niche verticals win the save game. Food, DIY, and fashion content consistently hit 1–2% save rates (double the platform average) because Pinterest users actively curate boards for future planning and purchases.
- Earned engagement amplifies reach for free. When 10–30% of your engagement comes from organic shares and re-pins, you’re not just creating content, you’re building compounding visibility without ad spend.
Actionable takeaways
- Audit your pin format mix. If 80% of your content is Standard Pins but Idea Pins drive three times the engagement, reallocate creative resources immediately.
- Optimize for saves, not just clicks. Pins with “save this” hooks or actionable how-to content signal to the algorithm that your content deserves long-term distribution.
- Double down on what your vertical does best. Food, fashion, and DIY brands should lean into tutorials, step-by-steps, and inspirational content that users want to revisit later.
Pinterest ads benchmarks
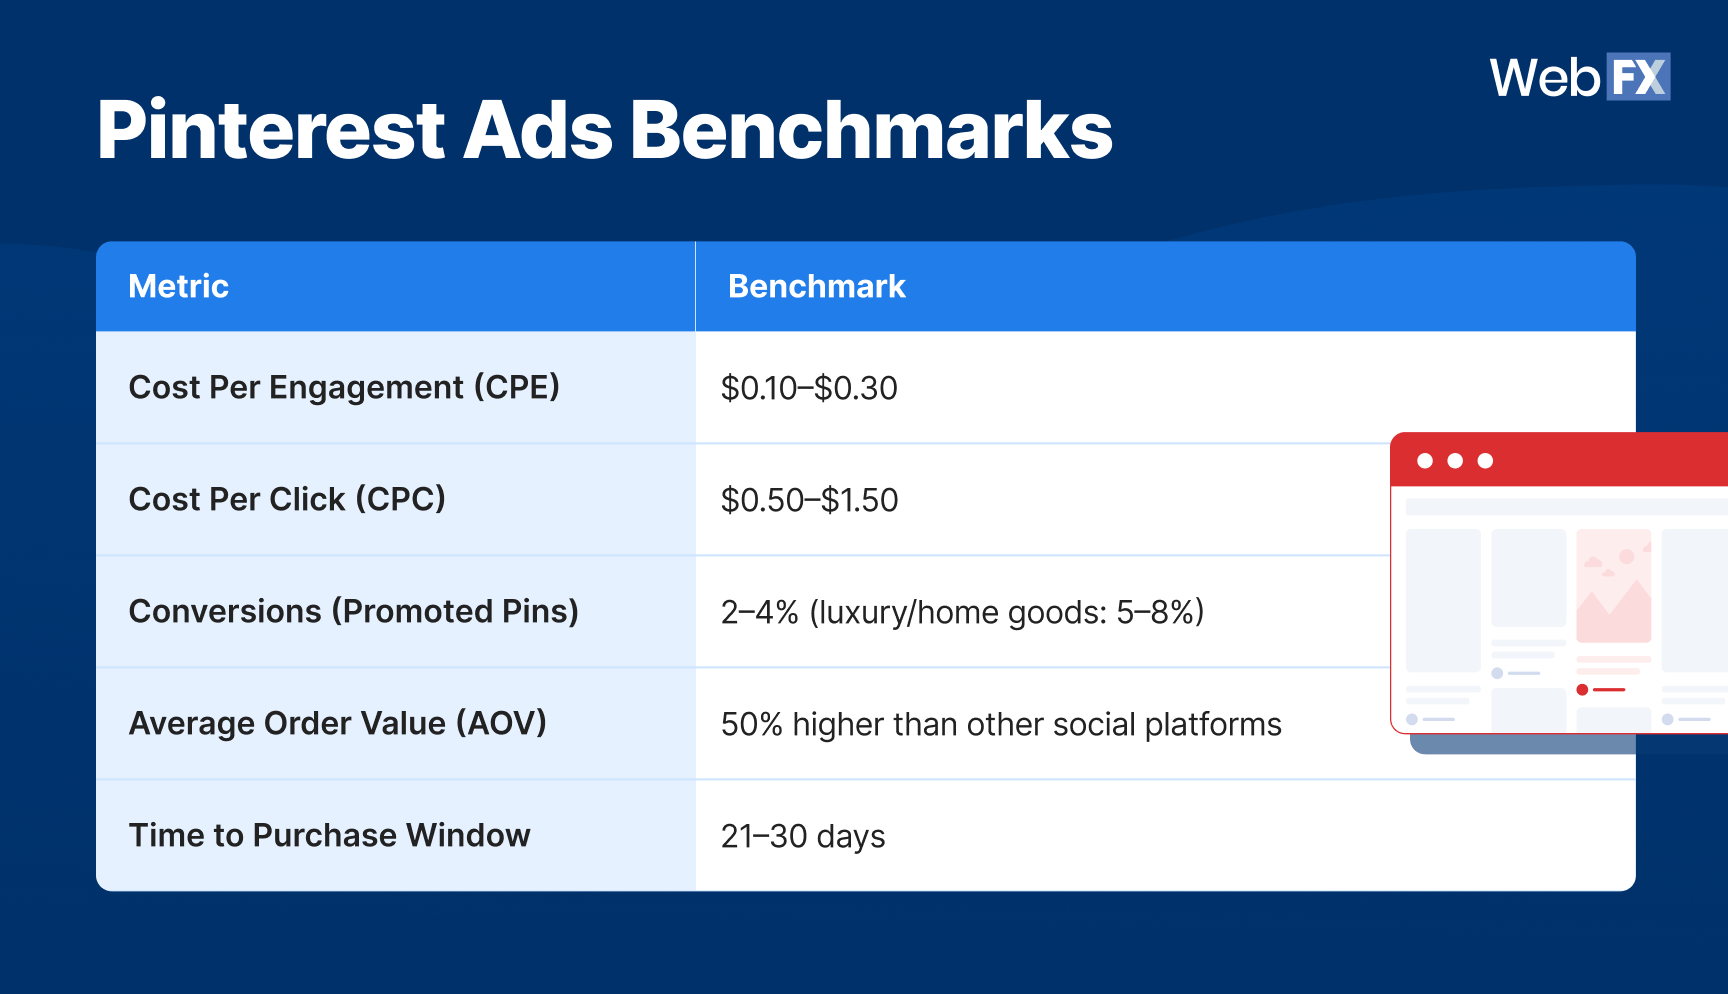
Paid performance on Pinterest shows you how efficiently your campaigns capture interest, earn clicks, and drive conversions. These Pinterest ads benchmarks give you a clear baseline to evaluate ad spend, creative effectiveness, and bottom-line impact.
Source data
| Metric | Benchmark |
| Cost Per Engagement (CPE) | $0.10–$0.30 |
| Cost Per Click (CPC) | $0.50–$1.50 |
| Conversions (Promoted Pins) | 2–4% (luxury/home goods: 5–8%) |
| Average Order Value (AOV) | 50% higher than other social platforms |
| Time to Purchase Window | 21–30 days |
Key insights
- Pinterest ads convert better because intent runs deeper. With a 21–30 day purchase window and 50% higher AOV, users aren’t impulse-buying — they’re planning, researching, and committing to bigger purchases.
- CPCs stay low due to high purchase intent. At $0.50–$1.50 per click, Pinterest undercuts most social platforms (compared to Meta with $1.06–$1.72 average CPC, and X (Twitter) with CPC that can spike to $3–$5) because users actively search for products instead of passively scrolling past interruptions.
- Luxury and home goods brands dominate conversions. When your audience is planning weddings, remodels, or major life moments, 5–8% conversion rates become the norm, not the exception.
Actionable takeaways
- Front-load value in your pin creative. Pinterest users are planners. Show the outcome (the finished room, the styled outfit) before asking for the click.
- Optimize landing pages for consideration, not impulse. Your audience won’t buy immediately. Offer guides, wishlists, or email capture to nurture through that 21-30 day window.
- Ramp up proven creative. Turn top-performing organic pins into Promoted Pins to reduce testing costs and improve early ad efficiency. Pinterest has already validated those creatives.
Pinterest visibility benchmarks
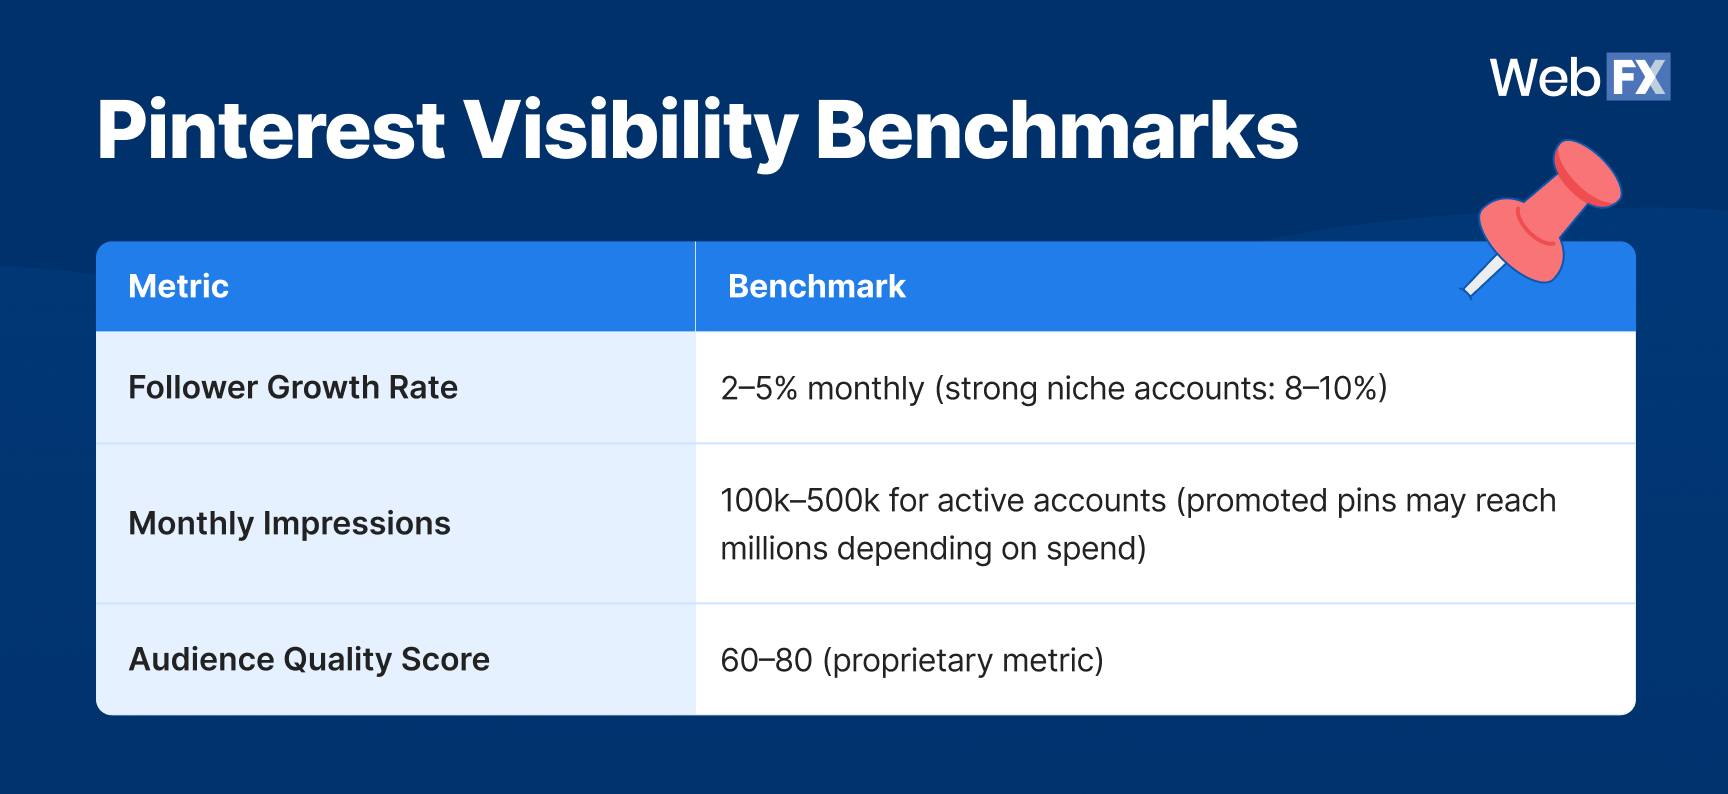
While performance benchmarks tell you how engaging your pins are, visibility benchmarks tell you how far that engagement travels, and whether your brand is actually growing its footprint on the platform. These Pinterest benchmarks help you evaluate audience growth, impression volume, and whether your content strategy is stacking up over time.
Source data
| Metric | Benchmark |
| Follower Growth Rate | 2–5% monthly (strong niche accounts: 8–10%) |
| Monthly Impressions | 100k–500k for active accounts (promoted pins may reach millions depending on spend) |
| Audience Quality Score | 60–80 (proprietary metric) |
Key insights
- Niche accounts grow faster than generalists. Brands targeting specific audiences (e.g., “minimalist home decor” vs. “home decor”) hit 8–10% monthly follower growth because Pinterest prioritizes relevance over reach.
- Impressions scale with consistency, not frequency. Active accounts generating 100k–500k impressions monthly aren’t pinning 20 times a day. They’re posting 3–5 high-quality pins that the algorithm redistributes for weeks.
- Audience quality trumps audience size. An Audience Quality Score of 60–80 signals engaged, purchase-ready users, not passive scrollers inflating vanity metrics.
Actionable takeaways
- Narrow your niche before expanding. Own one vertical (acne skincare, farmhouse kitchens, capsule wardrobes) before diluting your brand across multiple categories.
- Prioritize evergreen over trending. Pins that stay relevant for months generate impressions far better than viral-but-fleeting trend jacks.
- Measure audience quality, not just follower count. Track saves, outbound clicks, and conversion rates using Pinterest Analytics to ensure growth translates to ROI.
How to turn Pinterest marketing benchmarks into measurable ROI
Consider Pinterest benchmarks as your marketing guardrails and not your goals. When you know where the averages sit, you can finally see where to break them. Pinterest favors patience and precision, and the snowballing math behind it turns small, consistent improvements into serious revenue growth.
Here’s how to turn Pinterest benchmarks into breakthroughs:
1. Build for longevity, not virality.
If your pins average below 0.2% engagement or your save rate rarely hits 0.3%, the problem isn’t volume, but value. Create content users actually want to reference later, not just scroll past today.
Try this next: Audit your last 20 pins using Pinterest Analytics. Find the top five with the highest save rates and rebuild your next month’s content around their themes, formats, and hooks.
2. Let cost metrics guide creative strategy.
A $1.00 CPC tells you what your audience responds to. When your CPC spikes above $1.50, it’s a signal your creative no longer earns attention (not auction pressure). Refresh your visuals before your budget burns through.
Try this next: Rotate pin designs weekly following Pinterest ad specs. Test vertical vs. square, lifestyle vs. product-only, text overlay vs. clean image. Your lowest-CPC winner becomes your new template.
3. Optimize for purchase intent, not engagement vanity.
A 0.5% save rate means users noticed you. A 4% conversion rate means they turned into customers. The brands growing fastest on Pinterest track both, because saves without conversions are just pretty bookmarks.
Try this next: Map your Pinterest-to-site journey in Google Analytics 4 (GA4). Track where users drop after clicking your pin, fix that friction point (load speed? Product availability? Confusing nav?), then amplify your best-performing pins.
FAQs about Pinterest marketing benchmarks
What are Pinterest marketing benchmarks?
Pinterest marketing benchmarks are performance standards that show how your content and ads compare to industry averages across the platform. They include metrics like save rate (0.2–0.5%), cost per click ($0.50–$1.50), follower growth (2–5% monthly), and conversion rates (2–4% for most brands, 5–8% for luxury and home goods). Use them to identify whether your results are competitive, underperforming, or ready to grow.
What’s a good engagement rate on Pinterest in 2026?
A strong Pinterest engagement rate varies by content format. Standard Pins average 0.15–0.25% engagement, while Video Pins hit 0.3–0.5% and Idea Pins reach 0.5–1%. Food, DIY, and fashion content typically sees higher save rates (1–2%) compared to the platform average of 0.2–0.5%. If your engagement consistently exceeds these benchmarks, your content resonates with Pinterest’s planning-driven audience.
How much do Pinterest ads cost in 2026?
Pinterest ads average a cost per click (CPC) of $0.50–$1.50 and a cost per engagement (CPE) of $0.10–$0.30, making it one of the most cost-efficient platforms compared to Meta ($1.06–$1.72 CPC) and X/Twitter (can spike to $3–$5 CPC). Conversion rates for Promoted Pins typically range from 2–4%, with luxury and home goods brands seeing 5–8% due to Pinterest’s high-intent audience.
How often should brands post on Pinterest?
Brands performing best on Pinterest post 3–5 high-quality pins per week. Pinterest’s algorithm favors consistency and content quality over posting frequency, redistributing strong pins for weeks after publication. Accounts generating 100k–500k monthly impressions aren’t pinning 20 times daily, but they’re creating evergreen content that compounds reach over time.
How can I improve my Pinterest ROI using benchmarks?
Start by comparing your metrics (using Pinterest Analytics) to the Pinterest benchmarks. If your save rate falls below 0.3%, focus on creating actionable, evergreen content users want to revisit. If your CPC exceeds $1.50, rotate creative weekly to test what earns attention. Track your Pinterest-to-site journey in Google Analytics 4 (GA4) to identify friction points, then double down on pins that drive both engagement and conversions.
74% of people use social media when making a purchasing decision.
Make their decision easy with a stellar social media presence. See how your brand can level up by requesting a no-obligation proposal today.
One of our experts will be in touch within 24 hours!


The benchmarks are pinned. Your strategy needs to be, too.
Pinterest marketing benchmarks show you where the bar sits, but results happen only when your strategy actually clears it. When your content, ads, and landing experience align with platform performance data, Pinterest stops feeling like a visual playground and starts delivering measurable revenue.
Most teams know what good looks like, but merely a few have the bandwidth, structure, and firepower to execute it consistently. And that’s where expert strategy makes the difference.
With 30 years of social expertise and a team of 750+ marketing experts, you don’t just receive benchmarks and best wishes with WebFX. You gain targeted refinement, amplified high-performing pins, and Pinterest strategies directly tied to ROI through data-backed optimization and real-time tracking.
Your brand deserves more than simply being pinteresting. It deserves pins that convert and a strategy that sticks. Contact us online or call 888-601-5359 to speak with a strategist today about our high-impact social media services and Pinterest advertising services built to outperform the benchmarks.
Data sources & methodology
These Pinterest marketing benchmarks combine WebFX’s internal campaign performance data with vetted third-party industry reports to deliver the most current, actionable metrics available.
Our findings draw from hundreds of active U.S. Pinterest campaigns across multiple verticals, cross-referenced with publicly available platform data and competitive intelligence. All benchmarks reflect median performance values from verified 2024–2025 campaign results.
-
 Albert Dandy Velasquez blends SEO strategy with compelling storytelling to help businesses boost their visibility and revenue online. With a B.A. in English and certifications from HubSpot, Semrush, and Google Analytics, he has written and optimized hundreds of articles on organic SEO, content strategy, and user experience. He regularly contributes to the WebFX blog and SEO.com, creating content that helps readers turn marketing goals into measurable results. When he’s off the clock, he’s usually exploring new neighborhoods on two wheels, filming travel content, or chasing golden hour with a coffee in hand.
 -

WebFX is a full-service marketing agency with 1,100+ client reviews and a 4.9-star rating on Clutch! Find out how our expert team and revenue-accelerating tech can drive results for you! Learn more
Twitter and Facebook Status Generator
Finding engaging social media content for your business can be difficult. Use our tool to quickly find ideas and post directly to your page.
Give Me an Idea
Table of Contents
- Why Pinterest marketing benchmarks matter for your brand
- 2026 Pinterest marketing benchmarks: The complete breakdown
- Pinterest performance benchmarks
- Pinterest ads benchmarks
- Pinterest visibility benchmarks
- How to turn Pinterest marketing benchmarks into measurable ROI
- 1. Build for longevity, not virality.
- 2. Let cost metrics guide creative strategy.
- 3. Optimize for purchase intent, not engagement vanity.
- FAQs about Pinterest marketing benchmarks
- The benchmarks are pinned. Your strategy needs to be, too.
Share this article

Social Media Success Story

Twitter and Facebook Status Generator
Finding engaging social media content for your business can be difficult. Use our tool to quickly find ideas and post directly to your page.
Give Me an Idea
What to read next