

Table of Contents
- What are healthcare marketing benchmarks (and why do they matter)?
- Top healthcare marketing benchmarks to track
- 2026 healthcare marketing benchmarks snapshot
- Lead acquisition benchmarks
- Campaign performance benchmarks
- Conversion & sales cycle benchmarks
- Search visibility & community insights
- Competitive landscape insights
- Strategic recommendations & budget allocation
- FAQs about healthcare marketing benchmarks
- Want to outperform these benchmarks? Let’s make it happen.
TL;DR: 2026 healthcare marketing benchmarks
- CPL averages $377 (B2B) and $367 (B2C)
Healthcare leads are among the most expensive across industries, reflecting compliance and high patient lifetime value. Track CPL against patient LTV to ensure acquisition costs remain profitable. - Conversion rates hold at 6.8% industry-wide
Hospitals and dental practices lead the pack with double-digit CVRs, while fitness and training lag behind. Use reviews, case studies, and physician-authored content to lift mid-tier conversion rates. - Sales cycles stretch to 4 months on average
Quick-turn consumer services close in weeks, but B2B healthcare deals often take 6–12 months. Build nurture campaigns that keep prospects engaged throughout long buying cycles.
You’re treating patients all day, but your marketing might be bleeding money in the background. High lead costs, long sales cycles, and patient calls slipping through the cracks. Sound familiar?
Without healthcare marketing benchmarks, you’re making budget decisions blindfolded. These healthcare marketing metrics expose the leaks, show how your practice stacks up against healthcare industry benchmarks, and give you the playbook to turn wasted spend into predictable growth.
What are healthcare marketing benchmarks (and why do they matter)?
Healthcare marketing benchmarks are industry performance metrics that help providers measure how well their marketing efforts are working compared to competitors. These numbers give you more than data points. They give you proof.
Without healthcare marketing benchmarks, most providers end up guessing: Overspending on ads that don’t convert, missing calls that should’ve turned into appointments, or publishing content that patients never see. By tracking the right healthcare marketing metrics, you can:
- Set realistic goals grounded in healthcare industry benchmarks, not gut feelings
- Spot underperforming campaigns before they drain your budget
- Improve healthcare marketing performance across paid, organic, and referral channels
- Prove ROI to stakeholders and secure future budget with confidence
Think of benchmarks as your practice’s health checkup, except instead of blood pressure and cholesterol, you’re tracking the success of your digital marketing methods for hospitals and healthcare providers through costs, conversions, and sales cycles. Ignore them, and small problems can snowball into expensive growth roadblocks.
Top healthcare marketing benchmarks to track
Not every number in your analytics dashboard deserves your attention. The reality is, only a handful of healthcare marketing benchmarks actually reveal whether your practice is growing, stalling, or wasting budget.
These benchmarks cut through the noise, showing how your healthcare marketing performance compares to healthcare industry benchmarks and where you have the biggest opportunity to improve:
- 2026 healthcare marketing benchmarks snapshot
- Lead acquisition benchmarks
- Campaign performance benchmarks
- Conversion & sales cycle benchmarks
- Search visibility & community insights
- Competitive landscape insights
- Strategic recommendations & budget allocation
2026 healthcare marketing benchmarks snapshot
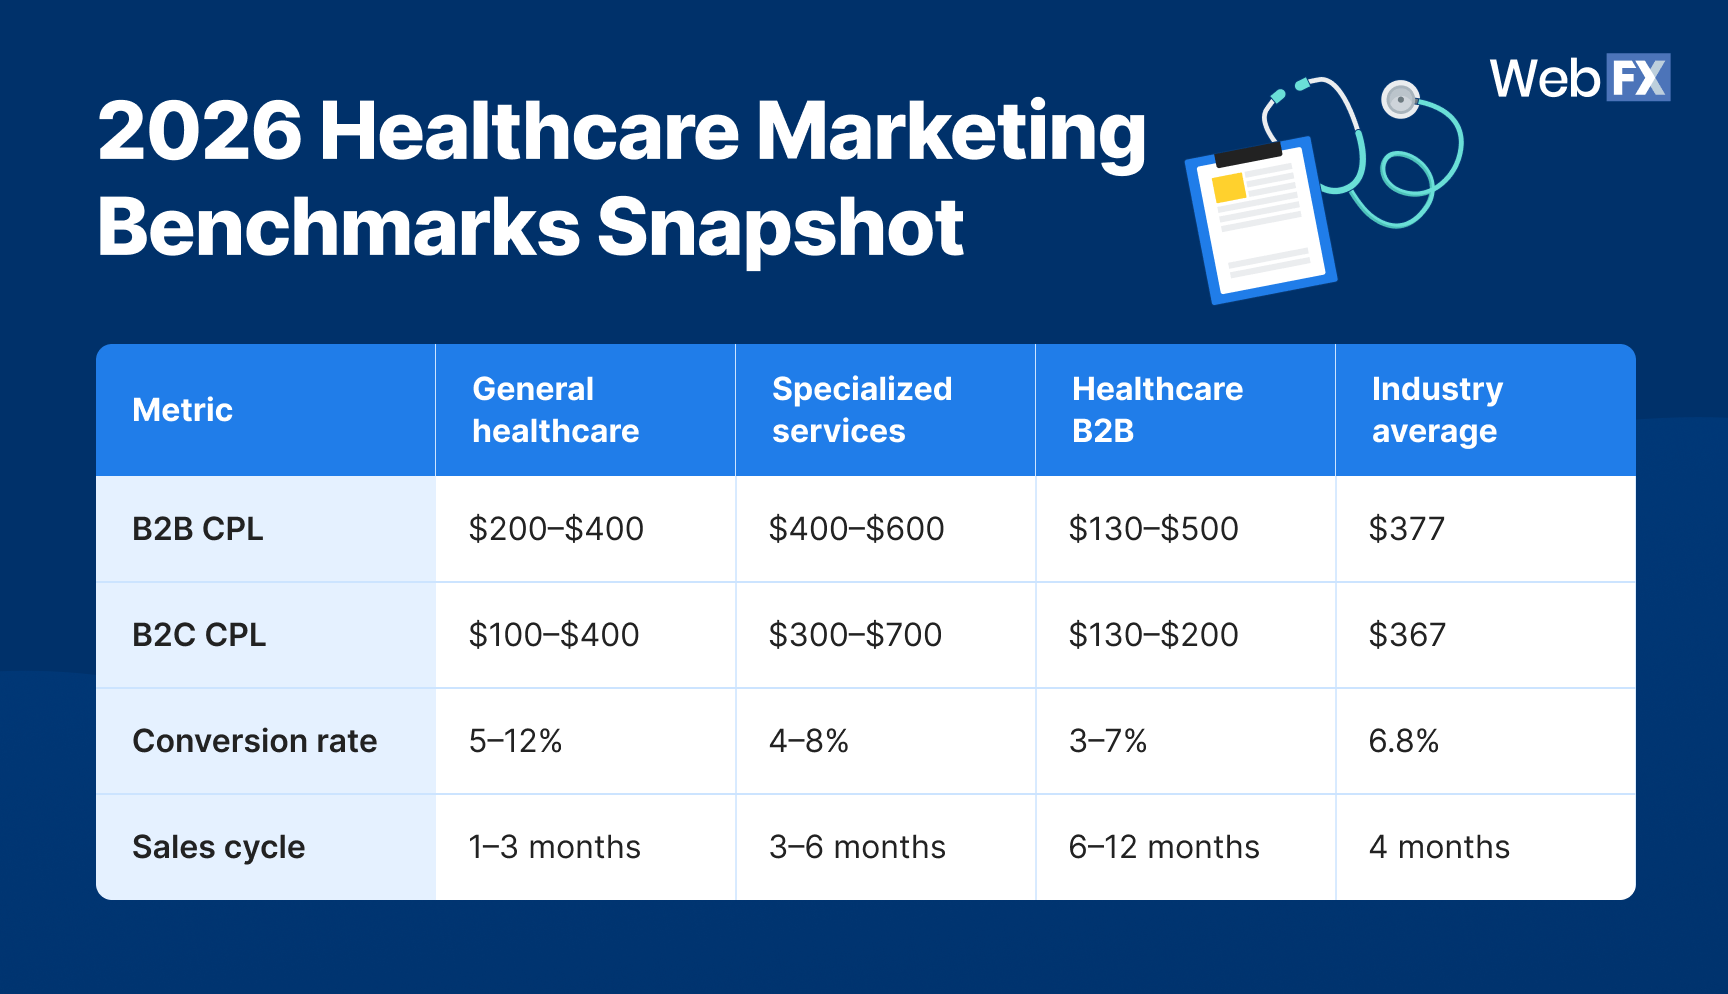
Before diving into the details, it helps to zoom out. This snapshot shows how general healthcare, specialized services, and B2B healthcare compare to the industry average across the core metrics that are worth tracking.
These numbers give you the “big picture” context to evaluate whether your practice is operating in the normal range, outperforming peers, or falling behind.
🔽 Table view
Metric |
General healthcare |
Specialized services |
Healthcare B2B |
Industry average |
| B2B CPL | $200–$400 | $400–$600 | $130–$500 | $377 |
| B2C CPL | $100–$400 | $300–$700 | $130–$200 | $367 |
| Conversion rate | 5–12% | 4–8% | 3–7% | 6.8% |
| Sales cycle | 1–3 months | 3–6 months | 6–12 months | 4 months |
🔎 Quick takeaways:
- B2B healthcare CPLs are 2–5x higher than general industries, reflecting strict compliance rules and higher patient lifetime value.
- Conversion rates remain strong (6.8% average), with hospitals and dental providers leading the pack.
- Sales cycles stretch longer in B2B healthcare (6–12 months), requiring advanced nurturing strategies.
Lead acquisition benchmarks
If your patient pipeline feels expensive to fill, you’re not imagining it. Healthcare cost per lead (CPL) is among the highest across industries, often 2–5x higher than general averages. Strict HIPAA compliance, complex sales cycles, and high patient lifetime values all drive up the cost of acquiring new patients.
Tracking CPL benchmarks reveals the true price of generating a lead, and whether your spend aligns with industry norms or signals inefficiency in your funnel.
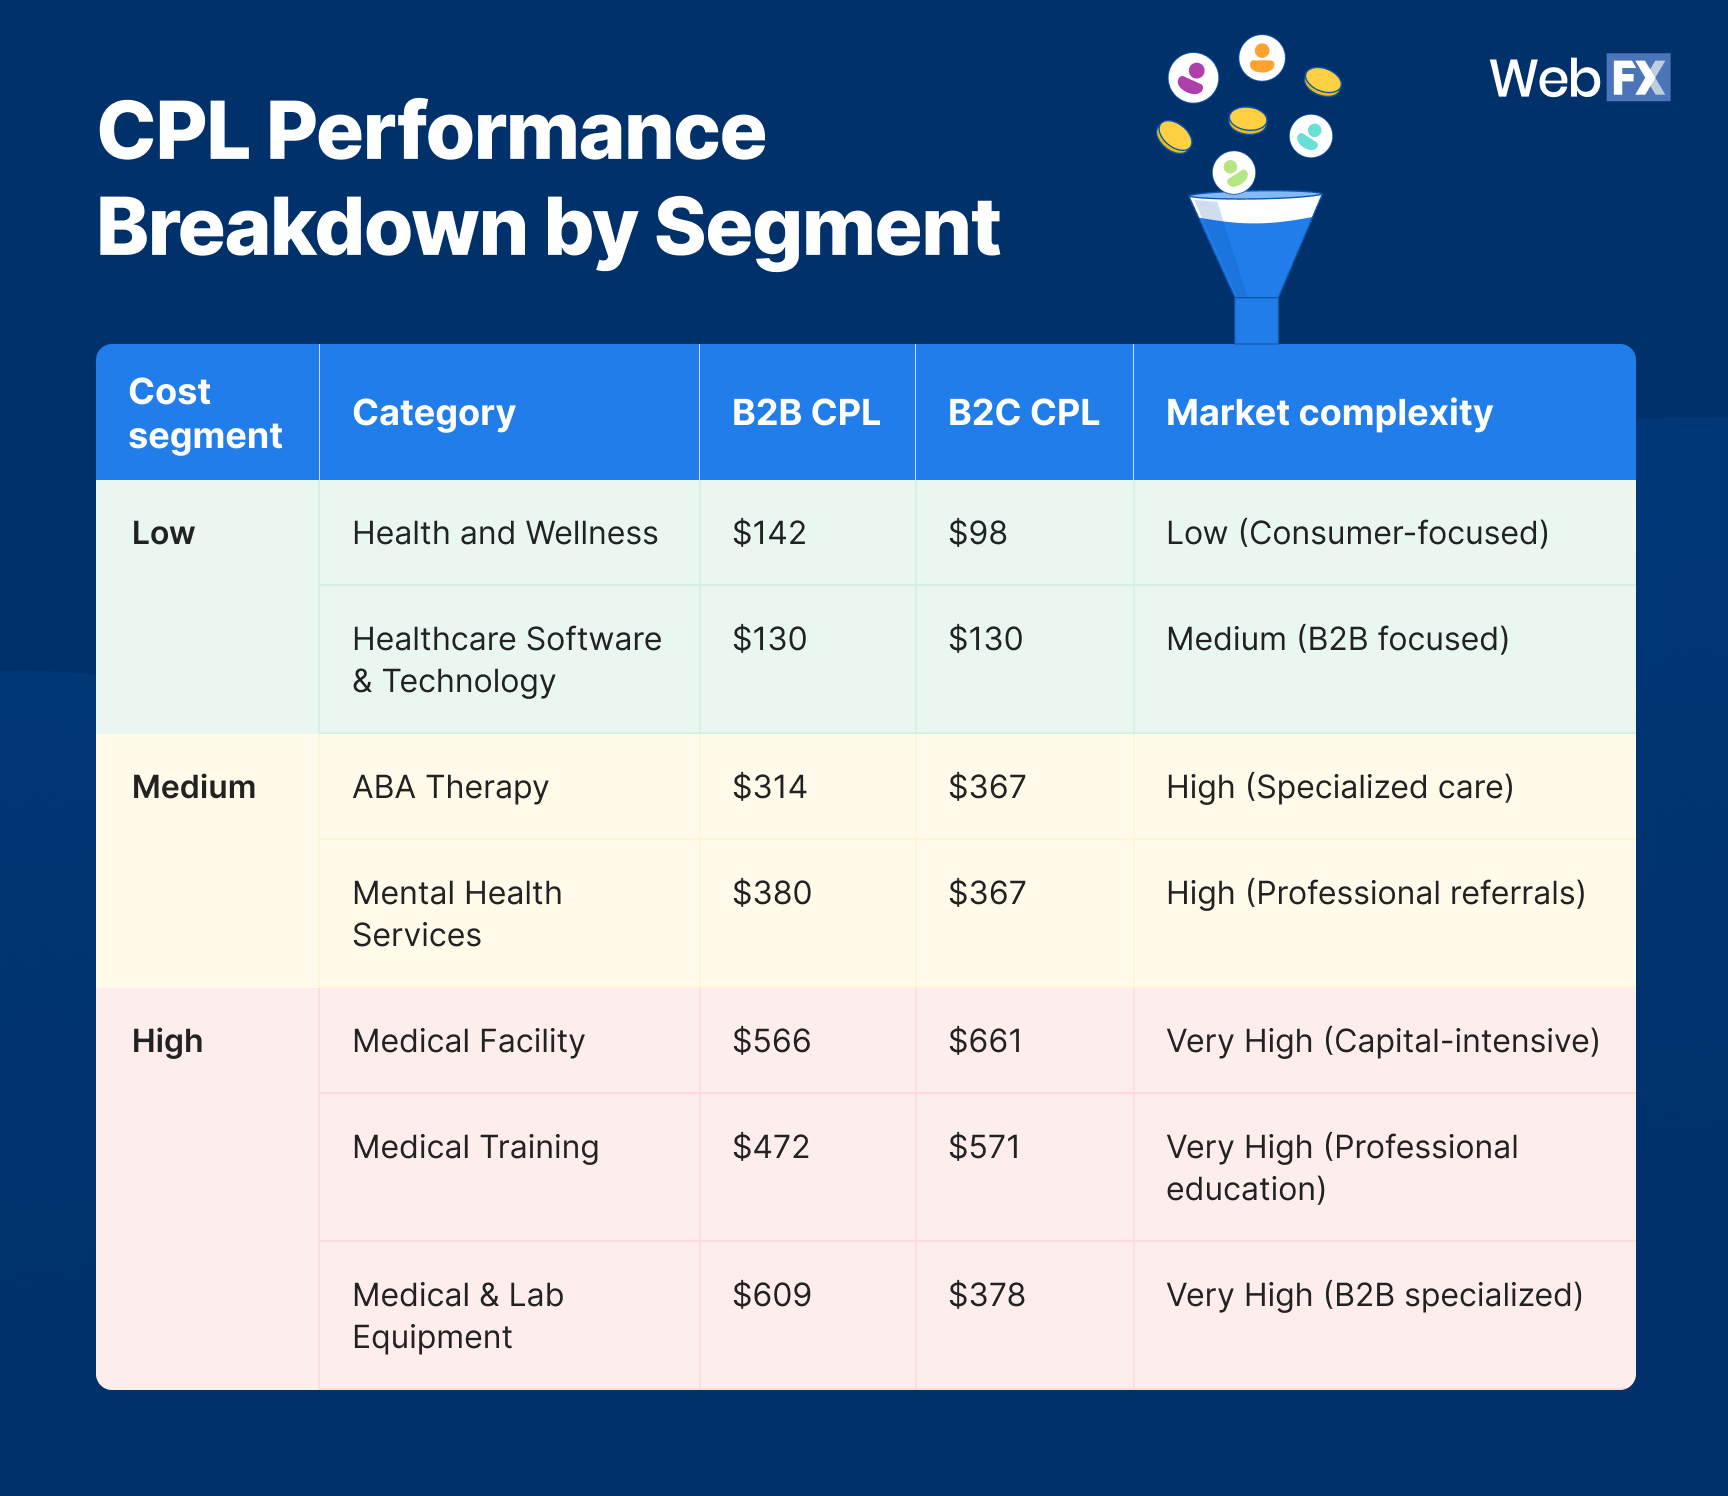
CPL performance breakdown by subcategory
🔽 Table view
Cost segment |
Category |
B2B CPL |
B2C CPL |
Market complexity |
| Low | Health and Wellness | $142 | $98 | Low (Consumer-focused) |
| Healthcare Software & Technology | $130 | $130 | Medium (B2B focused) | |
| Medium | ABA Therapy | $314 | $367 | High (Specialized care) |
| Mental Health Services | $380 | $367 | High (Professional referrals) | |
| High | Medical Facility | $566 | $661 | Very High (Capital-intensive) |
| Medical Training | $472 | $571 | Very High (Professional education) | |
| Medical & Lab Equipment | $609 | $378 | Very High (B2B specialized) |
📊 What the data reveals
- 67% of healthcare subcategories fall in the $200–$400 CPL range, showing standardization around premium pricing.
- High-cost segments ($500+) usually tie back to strict regulations, high patient lifetime values ($10K–$20K), and extended 6–12 month sales cycles.
- CPL benchmarks reveal which specialties justify higher spend based on patient lifetime value versus those where efficiency is critical.
💡 How to act on it
- Prioritize high-LTV patients: Justify higher CPLs by focusing on specialties with strong lifetime revenue potential.
- Invest in call tracking + attribution: Identify which leads actually convert into appointments and cut underperformers.
- Strengthen offers: Use free consultations, patient assessments, or bundled services to lift conversion rates and offset high lead costs.
Campaign performance benchmarks
Not all marketing channels deliver the same bang for your buck. Healthcare marketing campaigns carry some of the highest cost per click (CPC) across industries, while email marketing continues to outperform nearly every other digital channel for return on investment (ROI).
By tracking campaign performance benchmarks like CPC and email engagement, providers can better allocate budget, reduce waste, and double down on what actually drives patient growth.
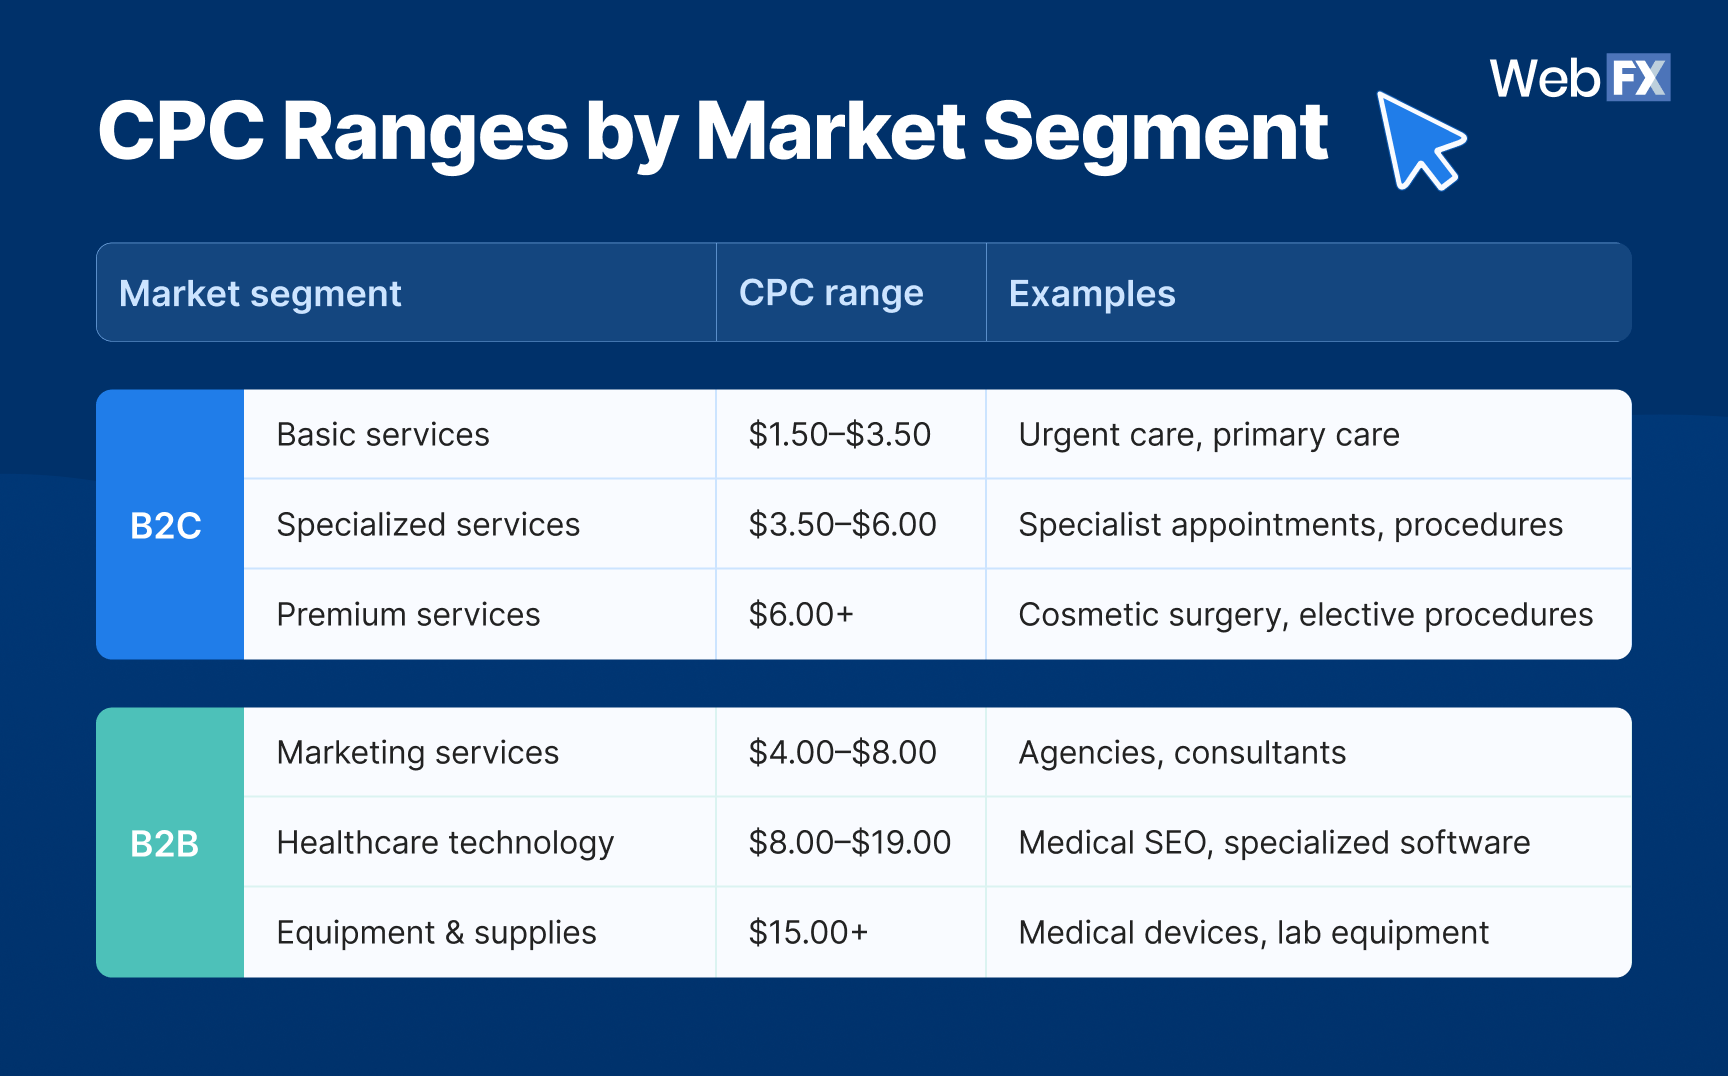
CPC ranges by market segment
🔽 Table view
Market segment |
CPC range |
Examples |
|
| B2C | Basic services | $1.50–$3.50 | Urgent care, primary care |
| Specialized services | $3.50–$6.00 | Specialist appointments, procedures | |
| Premium services | $6.00+ | Cosmetic surgery, elective procedures | |
| B2B | Marketing services | $4.00–$8.00 | Agencies, consultants |
| Healthcare technology | $8.00–$19.00 | Medical SEO, specialized software | |
| Equipment & supplies | $15.00+ | Medical devices, lab equipment | |
Email marketing performance benchmarks
Metric |
Benchmark range |
Industry comparison |
| Open rate | 34.6–44.6% | Above most industries |
| Click-through rate | 1.75–4.64% | Higher than average |
| Conversion rate | 2.6% | Competitive across sectors |
| Unsubscribe rate | 0.11–0.25% | Lower than most industries |
| ROI | $36 per $1 invested | Among the highest ROI channels |
📊 What the data reveals
- Email remains a powerhouse channel and delivers outsized results, with nearly 40% average open rates and $36 ROI per $1 invested (far above most industries).
- CPCs remain low for basic B2C services ($1.50–$3.50), but climb to $15+ for B2B equipment and specialized software.
- Paid search is expensive but critical for capturing urgent, transactional intent, while email nurtures long-cycle patients and boosts retention.
💡 How to act on it
- Balance spend between acquisition and retention: Use paid search to capture high-intent patients in the moment and email to keep them engaged over the long term.
- Segment email campaigns: Personalize content by condition, specialty, or patient stage to lift click-through rate (CTR) and conversion rates.
- Optimize bidding strategy: Focus pay-per-click (PPC) spend on geo-specific, high-intent terms instead of broad, high-cost keywords.
- Track ROI across channels: Pair call tracking with email analytics to see which campaigns generate appointments and revenue (not just clicks or opens).
Conversion & sales cycle benchmarks
Clicks and leads are only half the battle. The real test of healthcare marketing performance is how many become patients and how long it takes to get them there. These benchmarks help you measure results against industry standards, showing whether your marketing drives booked appointments or stalls in the funnel.
In healthcare, conversion rate (CVR) varies widely by specialty, sales cycles stretch longest in B2B contexts, and phone calls remain a critical touchpoint, with most patients still preferring to call before booking.
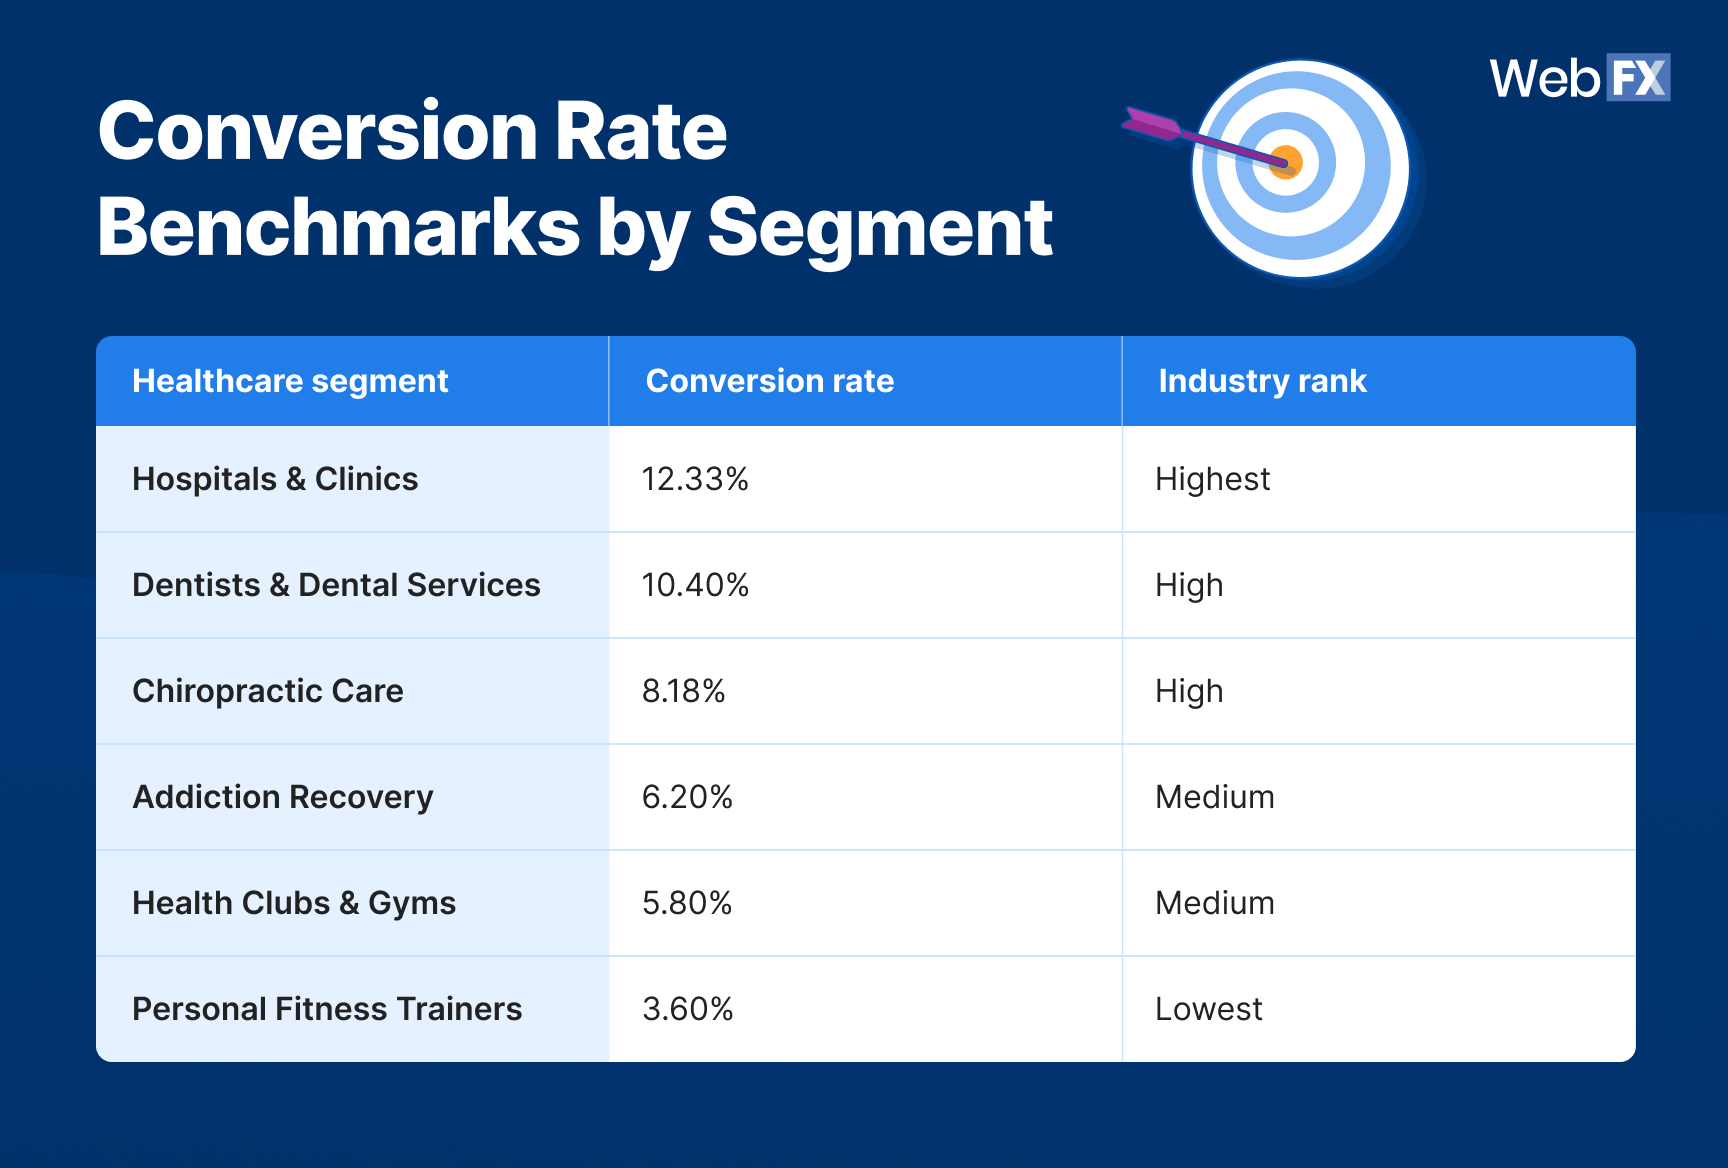
Conversion rate benchmarks by segment
🔽 Table view
Healthcare segment |
Conversion rate |
Industry rank |
| Hospitals & Clinics | 12.33% | Highest |
| Dentists & Dental Services | 10.40% | High |
| Chiropractic Care | 8.18% | High |
| Addiction Recovery | 6.20% | Medium |
| Health Clubs & Gyms | 5.80% | Medium |
| Personal Fitness Trainers | 3.60% | Lowest |
Sales cycle length benchmarks
Segment type |
Typical length |
Details |
| General healthcare | 1–3 months | Common for local and consumer-focused services |
| Specialized services | 3–6 months | Higher complexity, more referral-driven |
| Healthcare B2B | 6–12 months | Equipment, facilities, and training programs |
| Industry average | 4 months | Reflects the blend across subcategories |
Call conversion benchmarks
Metric |
Benchmark |
| % of healthcare searches leading to calls | 88% |
| Call-to-appointment conversion | 15–25% (industry average) |
| Peak call times | Mon 9–11 a.m.; Tue–Thu 2–4 p.m. |
📊 What the data reveals
- Most healthcare prospects still prefer to call directly from search (88%), but many practices leak leads with missed calls or poor scheduling systems.
- Healthcare providers enjoy stronger-than-average conversion rates, with hospitals and dentists leading at 10%+.
- B2B sales cycles stretch 6–12 months, reflecting the complexity and compliance of big-ticket purchases.
- Mobile drives the majority of healthcare searches with 7x more traffic, but desktop sessions convert 2.3x better, underscoring the need for tailored experiences across devices.
💡 How to act on it
- Streamline call handling: Implement call tracking and scheduling tools to ensure no inquiries slip through the cracks.
- Accelerate follow-ups: Use automation and clear workflows to shorten long sales cycles and prevent leads from going cold.
- Highlight trust signals: Case studies, testimonials, and physician-authored content can lift mid-tier conversion rates.
- Design for dual devices: Prioritize mobile for quick booking and calls, and optimize desktop landing pages for forms and in-depth content.
Search visibility & community insights
For most patients, the healthcare journey starts online. One search can decide whether they call your practice or your competitor. But as healthcare marketing benchmarks show, visibility isn’t just about ranking for keywords, but also about overcoming real-world hurdles practitioners face daily.
The gap between opportunity and execution is what defines healthcare marketing performance. Winning in search means mastering both the digital battlefield and the operational challenges behind it.
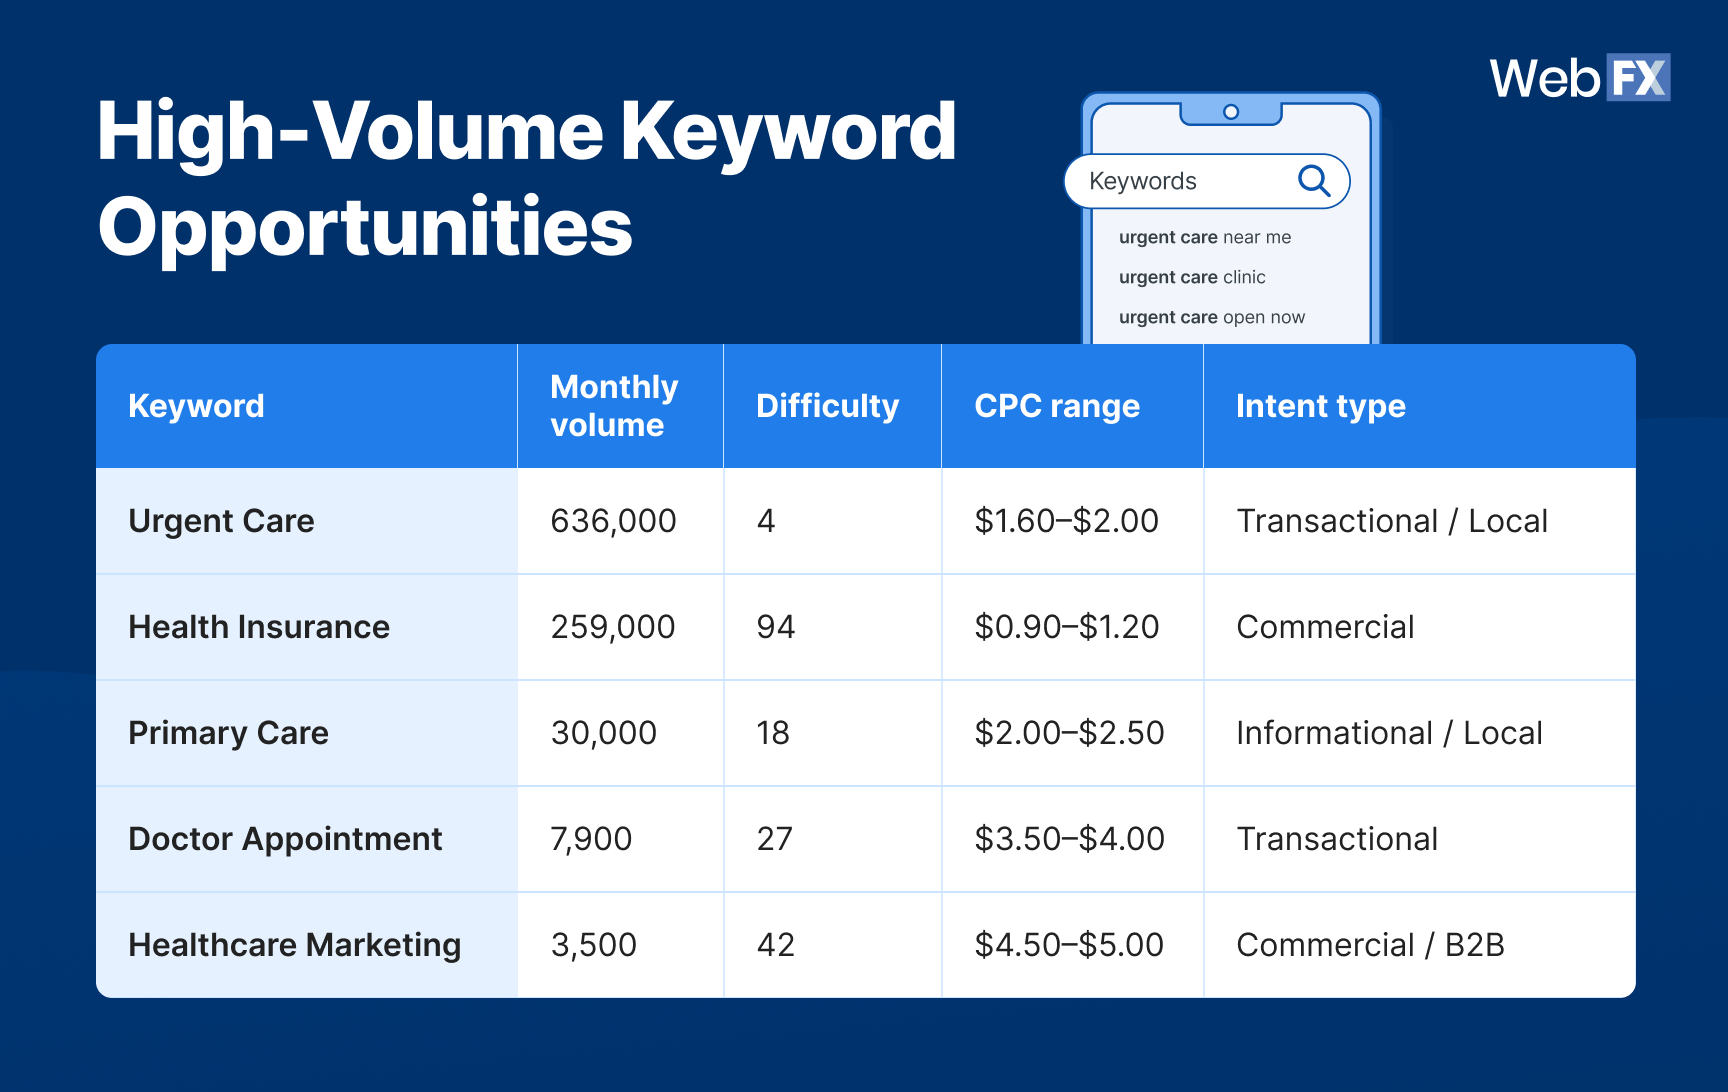
High-volume keyword opportunities
🔽 Table view
Keyword |
Monthly volume |
Difficulty |
CPC range |
Intent type |
| Urgent Care | 636,000 | 4 | $1.60–$2.00 | Transactional / Local |
| Health Insurance | 259,000 | 94 | $0.90–$1.20 | Commercial |
| Primary Care | 30,000 | 18 | $2.00–$2.50 | Informational / Local |
| Doctor Appointment | 7,900 | 27 | $3.50–$4.00 | Transactional |
| Healthcare Marketing | 3,500 | 42 | $4.50–$5.00 | Commercial / B2B |
Search intent distribution analysis
Keyword |
Monthly searches |
CPC |
| Healthcare Marketing Agency | 4,200 | $8.00 |
| Medical Marketing | 3,900 | $0.80 |
| Healthcare Digital Marketing | 3,200 | $6.00 |
Community challenges in healthcare marketing (Reddit)
Challenge |
Key issues |
| Talent acquisition crisis |
|
| Regulatory complexity |
|
| Budget reality vs. expectations |
|
Community strategies & solutions (Reddit)
Strategy type |
Key tactics |
| Multi-channel integration |
|
| Technology adoption |
|
📊 What the data reveals
- Local intent rules healthcare search: With 636K monthly searches, Urgent Care alone proves local SEO is a non-negotiable healthcare marketing benchmark.
- Search behavior is multi-stage: Most healthcare queries start informational but convert to transactional within 2–3 touchpoints, underscoring the need for content-to-conversion funnels.
- Practitioner pain points are real: Many small practices lack resources, face compliance bottlenecks, or operate with a single overstretched marketer.
- Best-in-class strategies are emerging: Email + local SEO deliver the strongest ROI, while referral programs (7.2% conversion) and review management give smaller providers an edge.
💡 How to act on it
- Dominate local search: Optimize Google Business Profiles, build service-area pages, and manage reviews to capture transactional local demand.
- Turn content into conversions: Map content across the patient journey. Create educational content for early searches and action-oriented ones for appointment intent.
- Solve budget and talent gaps: Pair marketing automation with agency support to scale without burning out internal teams.
- Build compliance-friendly workflows: Standardize HIPAA-safe data capture and legal reviews to reduce campaign delays.
- Adopt attribution tech: Use CRM + call tracking to connect spend with patient appointments and eliminate wasted budget. Platforms like RevenueCloudFX make it possible to track every dollar back to revenue.
Competitive landscape insights
The healthcare market is a crowded arena where some segments fight tooth and nail for visibility, while others remain underdeveloped and ripe for growth. These healthcare marketing benchmarks reveal where competition is fiercest, where opportunity lies, and what it takes to break through.
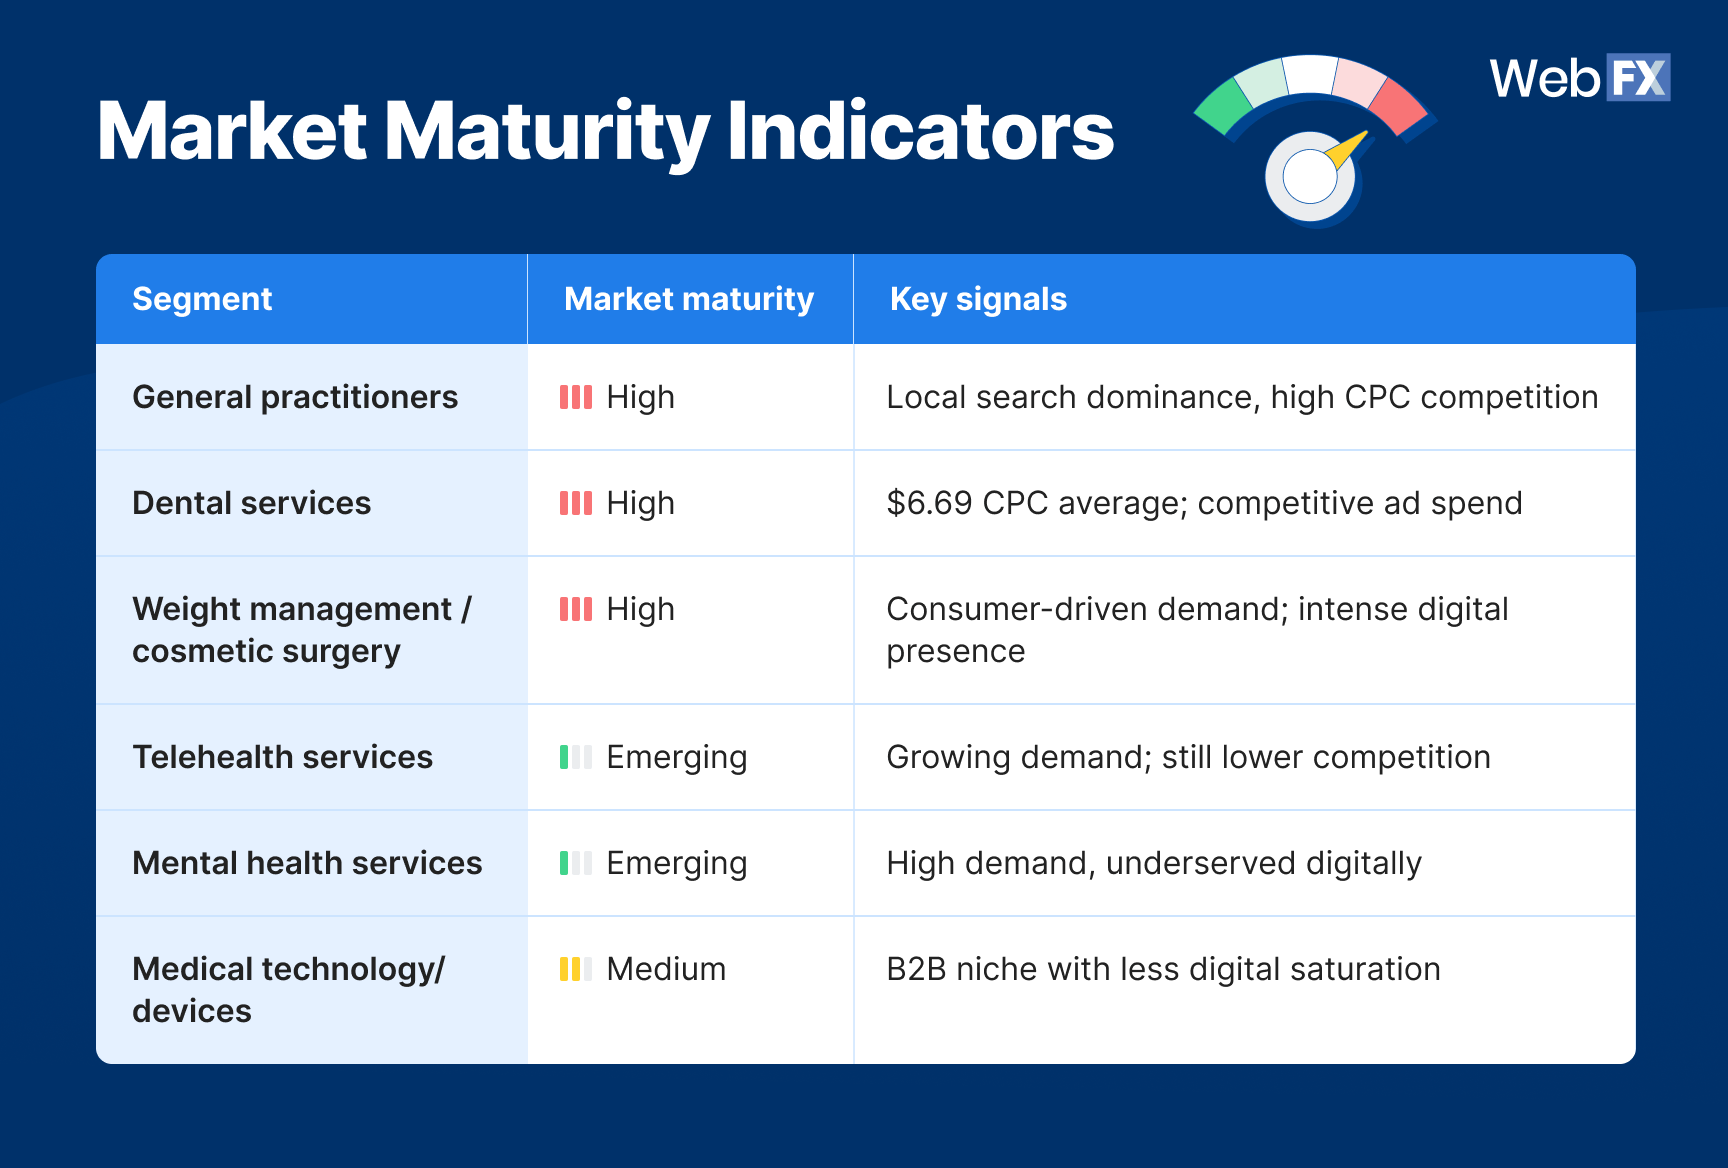
Market maturity indicators
🔽 Table view
Segment |
Market maturity |
Key signals |
| General practitioners | High | Local search dominance, high CPC competition |
| Dental services | High | $6.69 CPC average; competitive ad spend |
| Weight management / cosmetic surgery | High | Consumer-driven demand; intense digital presence |
| Telehealth services | Emerging | Growing demand; still lower competition |
| Mental health services | Emerging | High demand, underserved digitally |
| Medical technology/devices | Medium | B2B niche with less digital saturation |
Competition levels by sub-sector
Competition type |
Segment type |
Competition level |
Notes |
| Local services | Primary care | Very high | Proximity-driven; intense local competition |
| Urgent care | High | Convenience-driven; strong local demand | |
| Specialists (e.g., ABA, dental) | Medium | Often referral-dependent, less broad competition | |
| Digital presence | Health information sites | Extremely high | Dominated by WebMD, Healthline, Mayo Clinic |
| Healthcare software | Medium | B2B-focused, growing but not oversaturated | |
| Medical education | Low–medium | Niche audiences, smaller pool of competitors |
📊 What the data reveals
- Local markets are cutthroat: Primary care and urgent care face very high competition, driven by “near me” searches and proximity-based intent.
- Consumer-facing services are saturated: Dental, weight loss, and cosmetic surgery practices battle high CPCs and crowded ad markets.
- Digital Goliaths dominate information: Health content is still ruled by major publishers (WebMD, Healthline), making SEO difficult for small practices.
- Emerging growth areas exist: Telehealth and mental health services show rising demand but remain less digitally competitive, offering an opportunity for early movers.
- B2B niches are steady: Healthcare technology and medical devices are less crowded but command high CPCs, reflecting their high-value contracts.
💡 How to act on it
- Choose your battlefield wisely: Don’t overspend chasing highly saturated “general” terms if your specialty offers a clearer niche opportunity.
- Compete locally with precision: Leverage geo-targeting, localized content, and review management to stand out in high-density urban markets.
- Outflank big publishers: Target condition-specific long-tail keywords and physician-authored content to compete with health media giants.
- Double down on emerging verticals: Build early authority in telehealth and mental health services where competition is lighter but demand is surging.
- Win in B2B with authority content: Use whitepapers, ROI calculators, and thought leadership content to compete where CPCs are high but decision cycles are long.
Strategic recommendations & budget allocation
Benchmarks only matter if you turn them into action. Based on our proprietary 2026 healthcare marketing performance data, here are proven strategies to act across timelines and budgets:
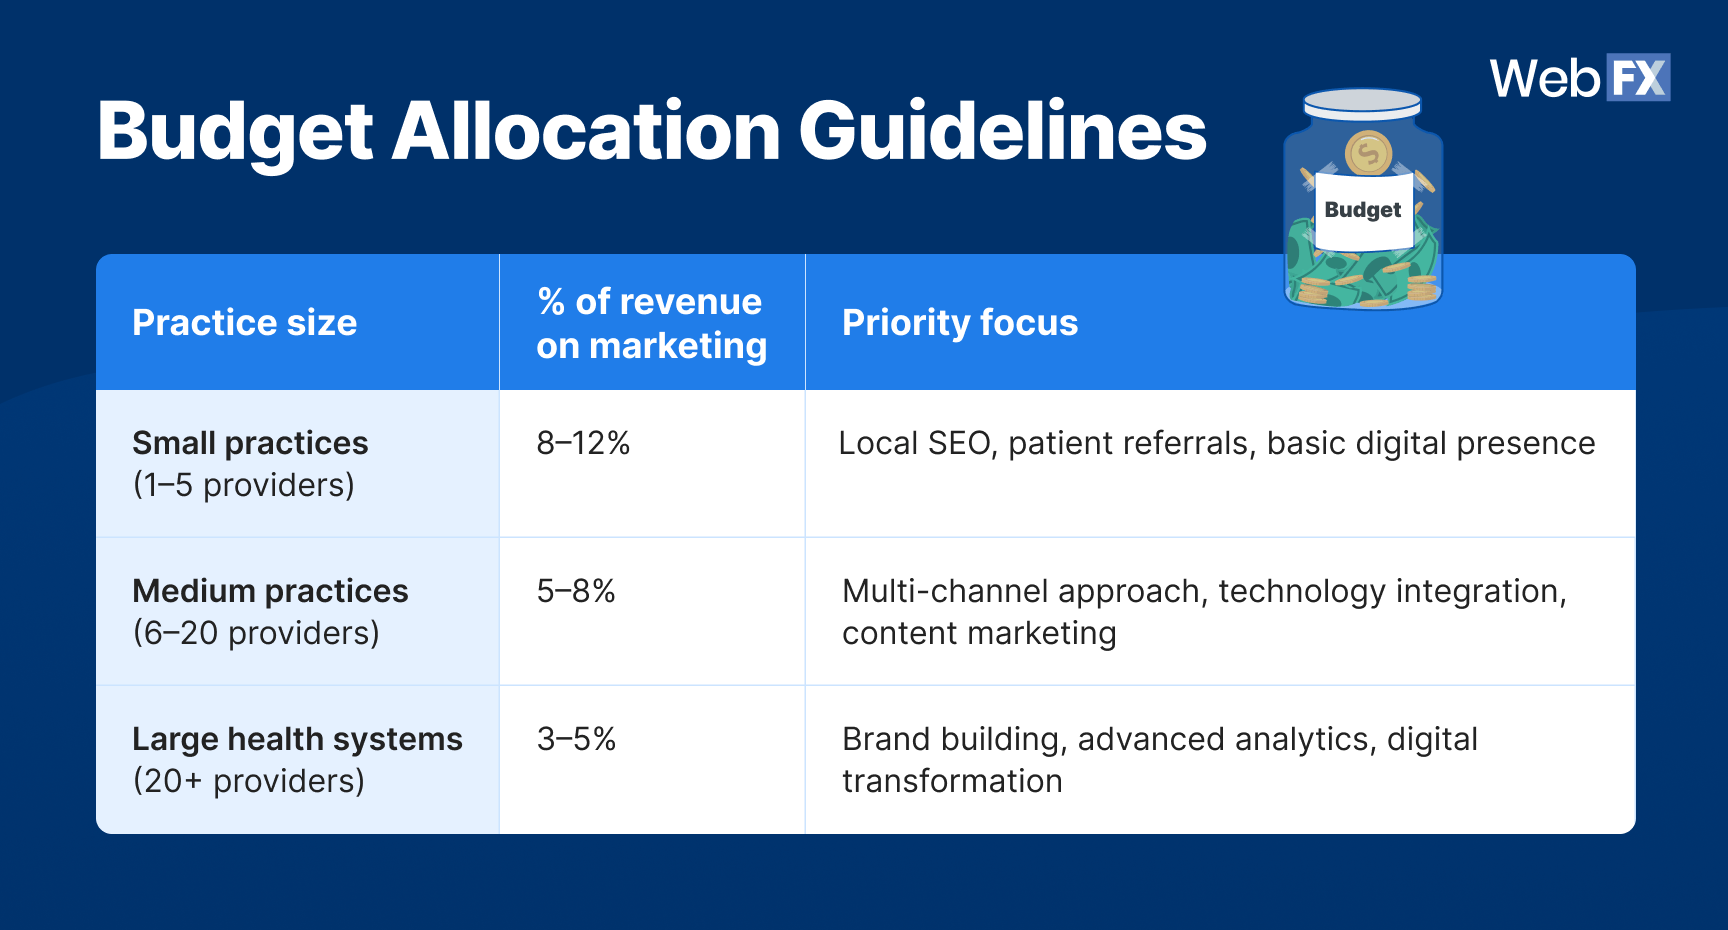
Budget allocation guidelines
🔽 Table view
Practice size |
% of revenue on marketing |
Priority focus |
| Small practices (1–5 providers) | 8–12% | Local SEO, patient referrals, basic digital presence |
| Medium practices (6–20 providers) | 5–8% | Multi-channel approach, technology integration, content marketing |
| Large health systems (20+ providers) | 3–5% | Brand building, advanced analytics, digital transformation |
Recommended actions by timeline
Timeframe |
Focus areas |
Key actions |
| Immediate (0–3 months) | Quick wins & foundational fixes |
|
| Mid-term (3–12 months) | Infrastructure & content |
|
| Long-term (12+ months) | Growth & advanced capabilities |
|
📊 What the data reveals
- Smaller practices spend nearly 2–3x more (as % of revenue) than large systems, reflecting the uphill battle for local visibility.
- Mid-sized groups are in the “scaling sweet spot,” where automation, patient portals, and content hubs drive compounding ROI.
- Large health systems don’t need to overspend but invest heavily in advanced analytics, digital transformation, and brand equity to maintain leadership.
- Across all practice sizes, digital-first strategies dominate with local SEO, email, and call tracking consistently outperforming traditional tactics.
💡 How to act on it
- Balance spend to size: If you’re a small provider, don’t stretch thin. Double down on local + referral-based marketing.
- Automate smartly: Use CRM + automation to nurture leads in long sales cycles without burning out your team.
- Build a content library: Develop condition-specific resources to position your practice as a trusted authority.
- Invest in analytics: Larger systems should integrate attribution and predictive analytics to prove ROI and guide budget allocation.
- Double down on proven ROI drivers: Email ($36 ROI per $1 spent) and call tracking (88% of searches drive calls) are essential across all practice sizes.
FAQs about healthcare marketing benchmarks
What are healthcare marketing benchmarks?
Healthcare marketing benchmarks are measurable performance metrics that help providers evaluate how effective their marketing is compared to industry standards. Based on 2026 data, here’s what the average looks like across the healthcare industry:
- B2B CPL: $377
- B2C CPL: $367
- Conversion rate (CVR): 6.8%
- Sales cycle length: 4 months average
Tracking these healthcare marketing metrics gives you the yardstick to identify weak spots and prioritize strategies that actually deliver patients.
How often should healthcare providers review their benchmarks?
At a minimum, providers should review key healthcare industry benchmarks quarterly. This ensures you catch performance gaps early, adjust budgets, and stay competitive in changing markets.
In faster-moving verticals like telehealth, urgent care, or healthcare tech, a monthly review is recommended. Why? Because CPCs, search demand, and patient expectations shift quickly, and waiting 6–12 months to adapt can cost you thousands in lost leads.
Do smaller healthcare practices need to track benchmarks too?
Absolutely. Healthcare marketing benchmarks aren’t just for hospital systems. They’re even more valuable for small and mid-sized practices.
If you’re running lean, tracking performance helps you:
- Prioritize high-ROI channels like local SEO, reviews, and referrals.
- Cut wasted spend on underperforming ads or broad keywords.
- Punch above your weight by focusing on efficiency and automation instead of outspending competitors.
Benchmarks give smaller practices the confidence to compete against big systems without burning through budget.
What’s a good cost per lead (CPL) in healthcare marketing?
The “right” CPL depends on your specialty, complexity, and whether you’re B2B or B2C. Based on our 2026 healthcare benchmarks:
- B2B CPLs range from $130 (software/tech) to $609 (medical equipment).
- B2C CPLs range from $98 (wellness) to $661 (facilities).
Higher CPLs aren’t necessarily bad. For example, if a medical training lead costs $571 but represents a $15,000+ lifetime value, the ROI still works. What matters most is balancing CPL with patient LTV.
How can healthcare providers lower their CPL?
Lowering CPL without sacrificing quality comes down to smarter targeting and stronger offers. Strategies include:
- Refine targeting: Use geo-targeting, long-tail keywords, and negative keywords to eliminate wasted clicks.
- Invest in SEO: Rank for condition-specific, lower-competition keywords instead of paying premium CPCs.
- Strengthen offers: Free consults, assessments, or referral bonuses convert more leads without raising ad spend.
- Improve UX: Fast-loading, mobile-friendly booking pages drive higher CVRs.
- Adopt attribution tech: Platforms like RevenueCloudFX connect spend to appointments so you can double down on what actually works.
How do benchmarks differ between B2B and B2C healthcare marketing?
B2B healthcare marketing benchmarks show higher CPLs ($400–$600+) and longer sales cycles (6–12 months) due to complex buying committees and compliance reviews. On the other hand, B2C healthcare marketing benchmarks show lower CPLs ($100–$400) and shorter sales cycles (1–3 months), since patients typically make quicker decisions.
For example, a B2C urgent care patient may book within hours, while a B2B equipment deal can take a year of nurturing.
Can benchmarks help healthcare providers compete in high-CPC markets?
Yes. In high-CPC spaces like healthcare technology ($8–$19 CPC) or medical devices ($15+ CPC), benchmarks give you the context to decide if the spend is justified.
By comparing your CPC, CVR, and patient LTV against industry averages, you can determine:
- If your ROI makes sense (even at $15 CPC).
- Whether to shift spend toward niche, lower-competition keywords.
- How to prioritize content-to-conversion funnels that capture patients earlier in their search journey.
Benchmarks turn high-CPC markets from “too expensive” into calculated investments with clear ROI guardrails.
Want to outperform these benchmarks? Let’s make it happen.
You’ve seen how today’s top providers measure success. Now it’s your turn to transform healthcare marketing benchmarks into real patient growth. Tracking the right metrics gives you clarity, cuts wasted spend, and builds a pipeline that actually performs.
As a results-driven healthcare marketing agency, WebFX helps providers turn healthcare marketing performance into measurable ROI. With 9.8M qualified leads delivered and $33.8M+ in revenue generated for practices like yours, our full-funnel strategies help you consistently beat the healthcare industry benchmarks.
Ready to surpass the benchmarks? We’ll make sure you do. Get your free proposal or call 888-601-5359 to speak with a healthcare marketing strategist today!
Data sources & methodology
This report combines proprietary healthcare marketing performance data with external research and practitioner insights. Our goal is to provide providers with accurate, actionable benchmarks that reflect today’s digital healthcare industry.
Here’s how the benchmarks were compiled:
- Proprietary data: Verified CPL, CVR, sales cycle benchmarks across 20+ healthcare sub-sectors, covering both B2C practices and B2B healthcare providers.
- Keyword research: Ahrefs data covering 25+ high-volume healthcare keywords, including search volume, difficulty, CPC ranges, and intent categorization.
- Community insights: Analysis of practitioner discussions from Reddit surfacing real-world challenges and strategies providers are using.
- Analysis period: Most recent available data with a 12-month context for validation.
- Geographic scope: U.S. healthcare market.
-
 Albert Dandy Velasquez blends SEO strategy with compelling storytelling to help businesses boost their visibility and revenue online. With a B.A. in English and certifications from HubSpot, Semrush, and Google Analytics, he has written and optimized hundreds of articles on organic SEO, content strategy, and user experience. He regularly contributes to the WebFX blog and SEO.com, creating content that helps readers turn marketing goals into measurable results. When he’s off the clock, he’s usually exploring new neighborhoods on two wheels, filming travel content, or chasing golden hour with a coffee in hand.
 -

WebFX is a full-service marketing agency with 1,100+ client reviews and a 4.9-star rating on Clutch! Find out how our expert team and revenue-accelerating tech can drive results for you! Learn more
Try our free Marketing Calculator
Craft a tailored online marketing strategy! Utilize our free Internet marketing calculator for a custom plan based on your location, reach, timeframe, and budget.
Plan Your Marketing Budget
Table of Contents
- What are healthcare marketing benchmarks (and why do they matter)?
- Top healthcare marketing benchmarks to track
- 2026 healthcare marketing benchmarks snapshot
- Lead acquisition benchmarks
- Campaign performance benchmarks
- Conversion & sales cycle benchmarks
- Search visibility & community insights
- Competitive landscape insights
- Strategic recommendations & budget allocation
- FAQs about healthcare marketing benchmarks
- Want to outperform these benchmarks? Let’s make it happen.
Share this article

Help More Patients Find Your Practice
See how healthcare providers like Hurst Pediatric Dentistry increased local leads 5× with data-driven SEO from WebFX.

Try our free Marketing Calculator
Craft a tailored online marketing strategy! Utilize our free Internet marketing calculator for a custom plan based on your location, reach, timeframe, and budget.
Plan Your Marketing Budget