

Table of Contents
- How to calculate your ROAS from Google Ads
- What is the average ROAS for Google Ads?
- What is the average Google Ads ROAS for my industry?
- Break-even ROAS: How to set targets by margin
- What is a good ROAS for Google Ads?
- How to improve your ROAS (actionable strategies)
- 3 things to know about calculating ROAS for Google Ads
- What is the average ROAS for Google Ads? The average return on ad spend for Google Ads is 200%, meaning businesses typically earn $2 for every $1 spent on advertising — though this can increase to $8 per $1 on the Google Search Network specifically.
- How do you calculate ROAS? ROAS is calculated by dividing total ad revenue by total ad spend (and optionally multiplying by 100 for a percentage), but you should include all advertising costs like bid management tools, landing page design services, and related expenses for accuracy.
- What is break-even ROAS and why does it matter? Break-even ROAS (calculated as 1 divided by gross margin) represents the point where ad revenue covers costs without profit or loss — a business with 25% margins needs 4:1 ROAS to break even, while 40% margins only require 2.5:1.
- What ROAS should businesses target for profitability? While 200% is average, anything above 400% (4:1 return) is considered good for Google Ads, though targets vary significantly by industry — manufacturing averages 536% while financial services averages only 70% due to competitive costs and long sales cycles.
- How can you improve your Google Ads ROAS? Key strategies include refining targeting with high-intent keywords and negative keywords, optimizing ad creative and landing pages for conversions, adjusting bidding strategies based on performance data, and factoring in customer lifetime value rather than just first-purchase revenue.
Return on ad spend (ROAS) for Google Ads is one of the most difficult metrics to measure, especially across an industry, because it requires businesses to share how much they spent on Google Ads and how much they earned from their ads.
Hint: That benchmark is 200% — a 2:1 ROAS, or an average return of $2 for every $1 spent. If you’re curious to learn more about the data behind this ROAS benchmark for Google Ads, keep reading! You’ll also learn how to calculate ROAS and what to watch for when calculating your company’s ROAS for Google Ads.
CALCULATOR: CALCULATE YOUR ROAS INSTANTLY!
While you probably won’t find an average ROAS by industry for Google Ads, you can look at some data from Google Ads, like ad spend and return on investment (ROI), to get a general benchmark for your company, which is exactly what we’ll cover on this page!
Keep reading or jump to a section with the links below!
- How to calculate your ROAS from Google Ads
- What is the average ROAS for Google Ads?
- What is the average Google Ads ROAS for my industry?
- Break-even ROAS: How to set targets by margin
- What is a good ROAS for Google Ads?
- How to improve your ROAS (actionable strategies)
- 3 things to know about calculating ROAS for Google Ads
How to calculate your ROAS from Google Ads
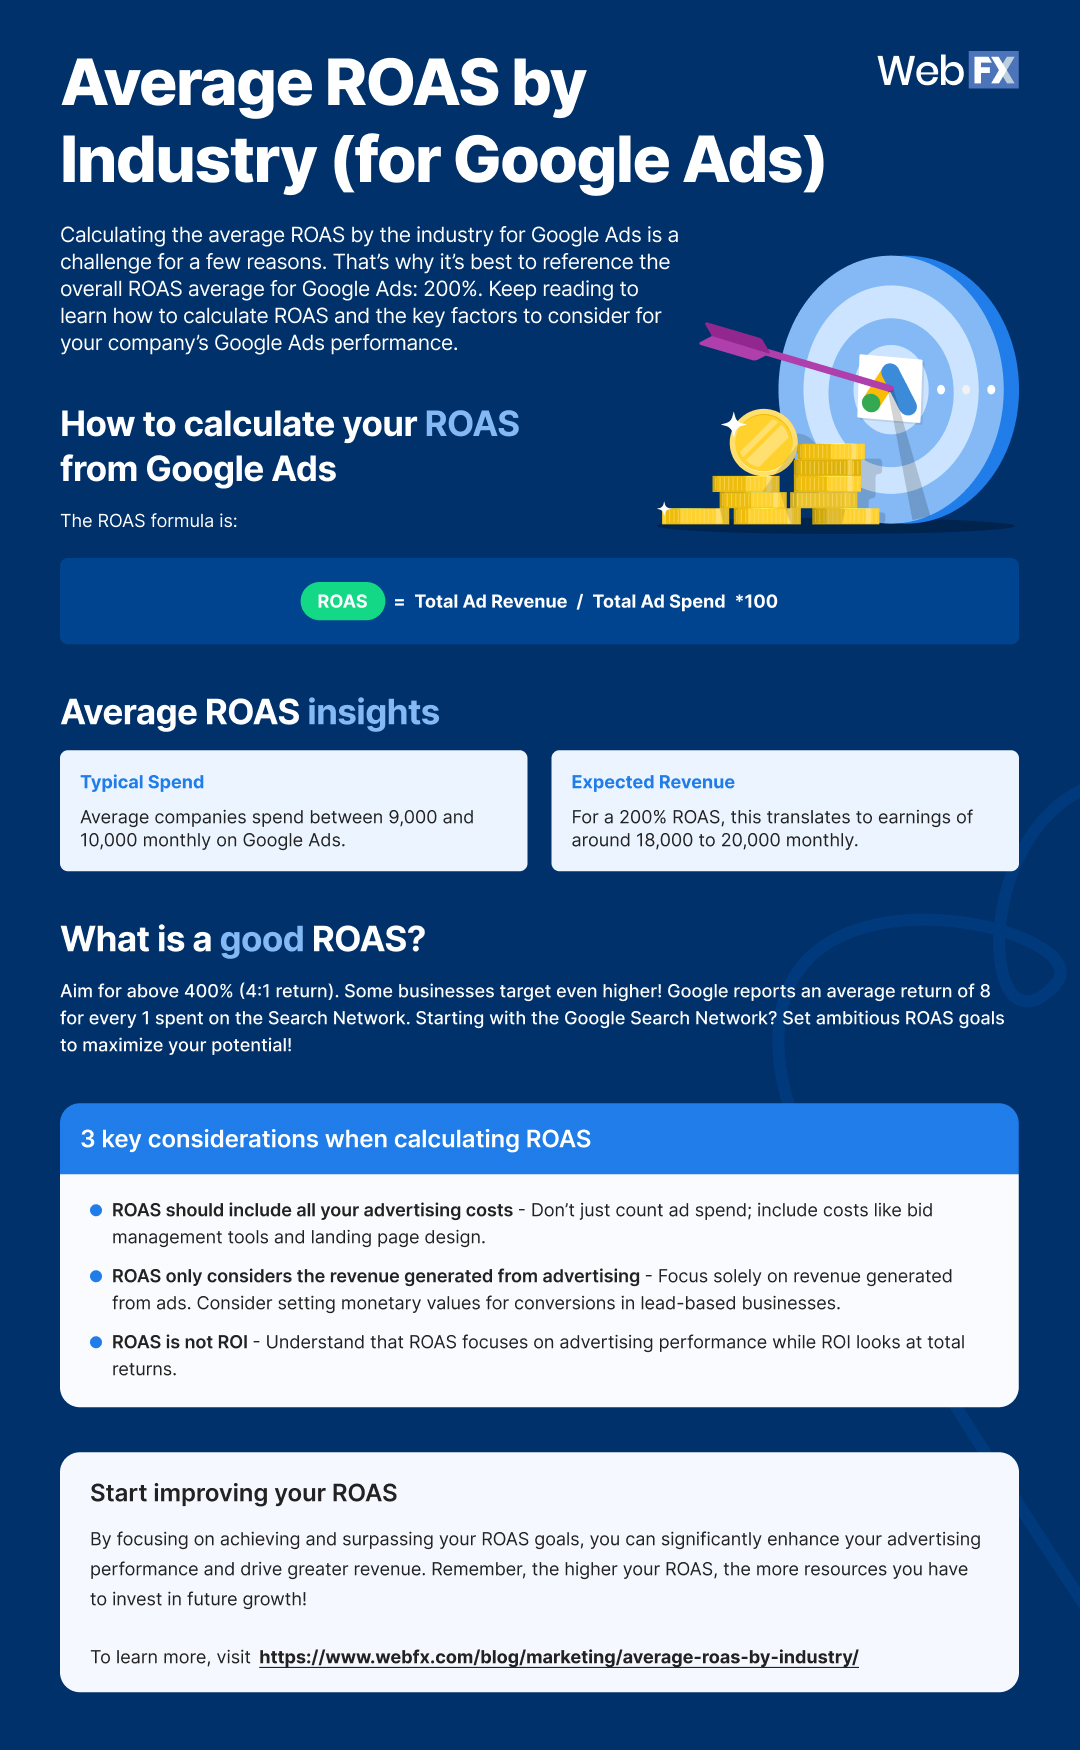
No matter how you calculate ROAS from Google Ads, whether with a calculator or pen and paper, it’s crucial to understand how ROAS gets calculated. It helps you know what ROAS measures, as well as whether you earned a positive or negative ROAS from Google Ads. The ROAS formula is:
ROAS = Total Ad Revenue / Total Ad Spend
In some cases, you’ll see the ROAS formula formatted as follows:
ROAS = Total Ad Revenue / Total Ad Spend * 100
This formula formats your ROAS as a percentage by multiplying your result by 100. If you use this version, know that a positive percentage, like 50%, doesn’t equal a positive ROAS because you’ve only earned 50% back on your investment. Your ROAS must exceed 100% for your business to make a return on its ad spend.
Download full infographic on Average ROAS by Industry
What is the average ROAS for Google Ads?
The average ROAS for Google Ads is 200%, which translates to earning $2 for every $1 spent. You can also calculate this amount by looking at some publicly available Google Ads data, like:
- What the average company spends on Google Ads
- What the average company earns from Google Ads
The average business, for example, spends $9000 to $10,000 per month on Google Ads and earns $2 in revenue for every $1 they spend on Google Ads. If they focus on the Google Search Network, that amount increases to $8 for every $1 spent. This information provides the “Total Ad Spend” for the ROAS formula — $9000 to $10,000. It also offers data to calculate “Total Ad Revenue” for the ROAS formula — $2 for every $1 spent.
If the average business earns $2 for every $1 spent, and they invest $9000 to $10,000 per month, that means they’re earning around $18,000 to $20,000 in revenue from Google Ads each month. You can calculate this value by multiplying $9000 and $10,000 by $2. Now, you can take this data and input it into the ROAS formula:
ROAS = Total Ad Revenue / Total Ad Spend * 100
ROAS = $18,000 / $9000 *100
ROAS = 2 * 100
ROAS = 200%
The result is 200%, meaning you’re earning $2 back for every $1 you invested into Google Ads.
What is the average Google Ads ROAS for my industry?
Calculating the average ROAS by the industry for Google Ads is a challenge for a few reasons. Most companies, for example, aren’t comfortable sharing their ad spend or ad revenue. For accurate ROAS industry benchmarks, you need a decent and diverse sample size, which means you need a significant number of businesses, both small and large, to share their ad spend and ad revenue.
If you don’t have a large and diverse enough sample size, you publish inaccurate benchmarks. Sharing inaccurate data like that can cause businesses to incorrectly measure their Google Ads performance and make decisions that harm not only their overall marketing and advertising efforts, but also their leads and sales numbers. That’s why it’s best to reference the overall ROAS average for Google Ads: 200%.
Paid search ROAS benchmarks by industry (WebFX 2025 data)
For additional context, WebFX analyzed performance across paid search campaigns in 2025. The analysis found an average ROAS of 2.26x (226%) across industries. While this dataset isn’t Google Ads–exclusive, it reflects the realities of paid search performance and provides a valuable directional benchmark.
| Industry | Average ROAS | Key performance drivers |
| Heavy equipment & industrial machinery | ~6.86x (686%) | High-value, niche keywords, low competition. |
| Manufacturing | ~5.36x (536%) | Procurement intent, repeat contracts, technical terms |
| Energy, utilities & renewables | ~3.31x (331%) | Large project budgets, regulated, focused audience |
| Local home services | ~3.28x (328%) | Urgency, “near me” searches, emergency needs |
| Hospitality & travel | ~3.04x (304%) | Seasonal demand, high search volume, bundled offers |
| Retail & brick-and-mortar | ~2.14x (214%) | Online + in-store support, competition, price sensitivity |
| Ecommerce & online retail | ~1.73x (173%) | Rising CPCs, margin pressure, remarketing/CRO impact |
| SaaS | ~1.66x (166%) | Long sales cycles, attribution gaps, recurring revenue |
| Healthcare & medical services | ~1.41x (141%) | Regulatory limits, heavy research phase, slow funnel |
| Real estate | ~0.92x (92%) | Long purchase cycles, competitive terms, offline attribution |
| Non-profit | ~0.88x (88%) | Awareness/donations focus, limited budgets, low monetization |
| Media | ~0.80x (80%) | Awareness-driven, many touchpoints, attribution dilution |
| Financial services | ~0.70x (70%) | Ultra-competitive CPCs, compliance restrictions, long funnels |
These numbers show why industry context matters. A 1.7x ROAS may be common in ecommerce but unsustainable for businesses with slim margins, while a 5x ROAS can be realistic in manufacturing.
Takeaway: Use industry benchmarks as perspective, but always calculate your own break-even ROAS based on profit margins and customer lifetime value to know what’s truly “good” for your business.
Break-even ROAS: How to set targets by margin
Before you decide whether your ROAS is “good,” you need to know your break-even ROAS. This is the point where ad revenue covers your costs without profit or loss. The break-even ROAS formula is:
Break-even ROAS = 1 / Gross margin
Examples:
- If your gross margin is 25%, your break-even ROAS is 4.0 (4:1).
- If your gross margin is 40%, your break-even ROAS is 2.5 (2.5:1).
This means a business with higher margins can be profitable with a lower ROAS, while low-margin industries need a much higher ROAS just to break even.
Why break-even ROAS matters
- Adds context to benchmarks: A 2:1 ROAS may be fine in high-margin industries, but disastrous in ecommerce with razor-thin margins.
- Prevents wasted spend: Knowing your break-even point keeps you from scaling campaigns that look efficient on the surface but lose money.
- Improves goal-setting: Use your break-even ROAS as the baseline, then aim higher for profitable growth.
- Connects to lifetime value (LTV): If you earn repeat purchases, you can tolerate a lower initial ROAS because profit comes later.
What is a good ROAS for Google Ads?
Meeting the average ROAS for Google Ads is great, but going beyond the average is even better. When you increase your ROAS, you help your business earn even more from paid advertising, which will probably lead to a few high-fives. Generating a higher ROAS can also lead to a bigger Google Ads budget, which gives you even more room to drive results for your company. So, what is a good ROAS for Google Ads? Anything above 400% — or a 4:1 return. In some cases, businesses may aim even higher than 400%. Remember, Google found that companies could earn an average return of $8 for every $1 spent on the Google Search Network. Since most businesses start with the Google Search Network, which delivers ads to places like Google search results, it makes sense to set more ambitious ROAS goals.
How to improve your Google Ads ROAS (actionable strategies)
Benchmarks tell you where you stand, but improving ROAS takes consistent optimization. Use these proven strategies to lift your returns:
1. Refine your targeting
- Focus on high-intent keywords and audience segments most likely to convert.
- Use negative keywords to eliminate wasted clicks and protect your budget.
- Layer in demographic and location filters to maximize relevance.
2. Optimize your ad creative
- Test multiple headlines, descriptions, and calls to action (CTAs).
- Highlight unique selling points (USPs) that differentiate your offer.
- Use ad extensions (sitelinks, callouts, structured snippets) to increase click-through rates (CTRs).
3. Improve your landing pages
- Align page content tightly with ad messaging.
- Simplify the conversion path with clear CTAs and fewer distractions.
- Apply conversion rate optimization (CRO) services to turn more visitors into customers.
4. Adjust your bidding and budgets
- Shift spend to campaigns or ad groups with the strongest ROAS.
- Use automated bidding strategies (like Target ROAS) to balance scale and efficiency.
- Test budget allocation between branded and non-branded campaigns.
5. Factor in customer lifetime value (LTV)
- Don’t evaluate ROAS on first purchase alone.
- Track repeat purchases and subscription renewals to justify higher acquisition costs.
- Consider lowering initial ROAS targets if LTV supports long-term profitability.
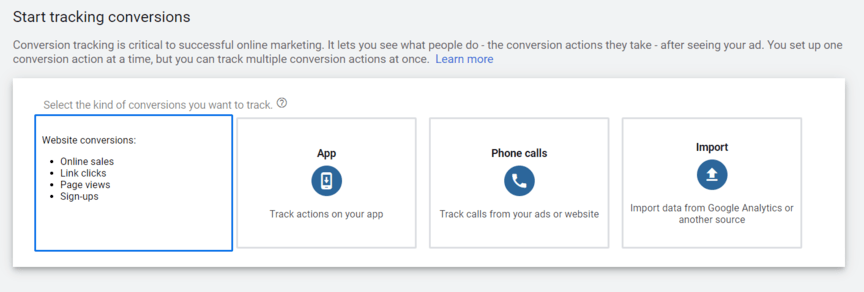
6. Strengthen tracking and attribution
- Set up accurate conversion tracking in Google Ads and Google Analytics.
- Use offline conversion imports if sales close outside digital channels.
- Apply multi-touch attribution models to see which touchpoints drive revenue.
3 things to know about calculating ROAS for Google Ads
While ROAS calculators make finding your ROAS easy, you should keep in mind a few factors, including:
1. ROAS should include all your advertising costs
When you calculate your ROAS, you enter your total ad spend. A lot of times, companies will look at this number and enter their monthly ad spend, which they pay directly to an ad network, like Google Ads. The problem, however, is that this number doesn’t include additional advertising costs. For example, these costs can include:
- Bid management tools
- Landing page design services
- Employee salaries
Whether your business includes these numbers is up to you. For example, you may exclude employee salaries and include some bid management software that you use, which makes sense. In your company role, you probably do more than PPC management, while your bid management software gets used solely for your ad campaigns.
2. ROAS only considers the revenue generated from advertising
Next, ROAS only looks at how much revenue you generated from advertising, like with Google Ads. This approach may work well for ecommerce companies, but for lead-based businesses, ROAS can provide an inaccurate perspective of your Google Ads ROAS. That’s why it’s helpful to create conversion actions in Google Ads. With conversion actions in Google Ads, you can set custom conversions, like a quote request, and assign them a monetary value, like $250. This tool can help you monitor and measure the performance of your ad campaigns, as well as make your ROAS calculation more accurate, so take advantage of it.
3. ROAS is not ROI
While similar, ROAS and ROI are different:
- ROAS measures your average return from advertising.
- ROI measures your total return from advertising.
ROAS also takes a closer look at your advertising performance, helping you focus on the campaigns, ad groups, and ads that drove the best return for your business. If you want to measure the performance of your advertising efforts, like on Google Ads, use ROAS.
FAQs about ROAS
What is a good ROAS benchmark?
A good ROAS depends on your industry and margins, but many businesses aim for 3:1 (300%) or higher. High-margin industries can succeed with lower ROAS, while low-margin sectors need higher returns to stay profitable.
What is the average ROAS for Google Ads?
The average ROAS for Google Ads is around 200% (2:1), meaning $2 earned for every $1 spent. Keep in mind that performance varies widely by industry. For example, 2025 WebFX data on paid search (including Google Ads) shows ROAS ranging from 0.7x (70%) in financial services to 6.86x (686%) in heavy equipment.
Is a 2:1 ROAS good?
A 2:1 ROAS means you earn $2 for every $1 spent. Whether that’s “good” depends on your gross margins. For example, if your break-even ROAS is 4:1, a 2:1 return still loses money.
What’s the difference between ROAS and ROI?
Here’s the difference between ROAS and ROI:
- Return on ad spend (ROAS): Focuses only on ad-driven revenue compared to ad costs.
- Return on investment (ROI): Considers all costs and overall profit, not just ad spend.
How can I improve my ROAS?
You can improve ROAS by:
- Refining targeting with high-intent keywords and negative keywords.
- Testing new ad creative and using ad extensions.
- Optimizing landing pages with CRO.
- Adjusting bidding strategies, such as Target ROAS.
- Factoring in customer lifetime value (LTV).
Why does ROAS vary so much by industry?
ROAS benchmarks differ by industry because of margins, competition, and buying cycles. For example:
- High-margin industries (like heavy equipment) can generate higher ROAS because each sale produces significant profit.
- Highly competitive sectors (like ecommerce or financial services) face rising CPCs and lower average ROAS.
- Longer sales cycles (like real estate or SaaS) make it harder to attribute revenue quickly, lowering measured ROAS.
That’s why you should always calculate your break-even ROAS and compare it against your own margins and lifetime value, rather than relying only on industry averages.
Calculate your Google Ads ROAS instantly with our ROAS calculator
Knowing the average ROAS for Google Ads is the first step. The second step is calculating your Google Ads ROAS, which is easy with our free ROAS calculator. Just enter your total ad spend and ad revenue for a period, like a month, and our calculator will do the rest. Try it now!
If you aren’t happy with your results — and haven’t been with your Google Ads strategy overall — feel free to contact our team. You can contact us online or give us a ring at 888-601-5359 to learn how our Google Ads agency can help with your pay-per-click (PPC) strategy!
-
 Sarah Berry is a Lead Web Marketing Consultant at one of the largest digital marketing agencies in the USA — WebFX. With more than 10,000 hours of experience, she offers practical insights and strategies to grow your digital revenue. Her work has been cited by Michigan State University, Business Insider, and Ars Technica. When she isn’t polishing her Time Magazine Person of the Year Award, she’s spending time with her flock of ducks.
 -

WebFX is a full-service marketing agency with 1,100+ client reviews and a 4.9-star rating on Clutch! Find out how our expert team and revenue-accelerating tech can drive results for you! Learn more
Try our free Marketing Calculator
Craft a tailored online marketing strategy! Utilize our free Internet marketing calculator for a custom plan based on your location, reach, timeframe, and budget.
Plan Your Marketing Budget
Table of Contents
- How to calculate your ROAS from Google Ads
- What is the average ROAS for Google Ads?
- What is the average Google Ads ROAS for my industry?
- Break-even ROAS: How to set targets by margin
- What is a good ROAS for Google Ads?
- How to improve your ROAS (actionable strategies)
- 3 things to know about calculating ROAS for Google Ads
Share this article

Proven Marketing Strategies
Try our free Marketing Calculator
Craft a tailored online marketing strategy! Utilize our free Internet marketing calculator for a custom plan based on your location, reach, timeframe, and budget.
Plan Your Marketing Budget