
Methodology
Hundreds of U.S.-based marketers to share how much they spend on social media advertising.
Social media advertising costs depend on several factors, from who manages your ad spend to where you spend it.
On average, businesses spend 11% – 25% of their annual ad budget on social media advertising, which includes ad spend ($850 – $2,000 per month, on average) and ad management (10% – 20% of monthly ad spend).
Keep reading to learn more about how much it costs to advertise on social media platforms like Facebook, Instagram, LinkedIn, TikTok, and more!
-
What is the average cost of social media advertising?
Companies typically spend 11%–25% of their annual ad budget on social media advertising, which includes $850–$2,000 per month in ad spend plus 10%–20% of that spend for ad management services. -
How do social media advertising costs vary by platform?
Costs differ significantly across platforms — LinkedIn has the highest CPC at $2–$3, while Instagram and Pinterest offer the lowest at $0.01–$0.25 and $0.01–$0.10 respectively, with Facebook, YouTube, and X falling in between. -
What factors determine social media advertising expenses?
Ad spend depends on your overall marketing budget and chosen platform, while ad management costs are influenced by your ad spend amount, service provider selection, technology requirements, and available talent resources. -
Are social media ads effective for businesses?
Yes — 74% of businesses report that social media advertising is effective, making it a worthwhile investment when campaigns use proper ad creatives, audience targeting, and performance tracking to generate positive returns. -
What’s the difference between budget and bid in social media advertising?
Your budget is the total amount you’re willing to spend monthly on a campaign, while your bid is what you’ll pay for each specific user action (like clicks or views) — you never pay more than your bid amount.
How much does it cost to advertise on social media?
Companies spend 11% – 25% of their overall ad budget on social media advertising annually.
Social media advertising costs include ad spend (paid to social media networks) and ad management (paid to a third party for services). The average ad spend is $850 – $2,000 per month, with most social media ad management services costing 10% – 20% of your monthly ad spend.
| Expense | Monthly Cost |
| Ad spend | $850 – $2000+ |
| Ad management | 10% – 20% of ad spend |

By business size
Learn how social media costs vary by business size below:
| Business size | % of Overall Ad Budget | Ad spend (Monthly) |
| Micro-enterprise (1-10 employees) | Less than 5% | $450 – $850 |
| Small business (11-50 employees) | 11% – 25% | $100 – $450 |
| Mid-sized business (51-250 employees) | 11% – 25% | $450 – $850 |
| Large business (251-500 employees) | 75% | $850 – $2,000 |
| Enterprise business (501+ employees) | 11% – 25% | $2,000 – $4,000 |
How much do social media ads cost?

How much social media ads cost depends on the social media network and its ad auction, campaign objectives, and ad types, plus factors specific to the advertiser, like their industry and product or service.
You can see how the cost of social media ads varies by looking at average cost-per-click (CPC):
- Facebook: $0.26 – $0.50
- Instagram: $0.01 – $0.25
- LinkedIn: $2 – $3
- Pinterest: $0.01 – $0.10
- TikTok: $1
- YouTube: $0.11 – $0.40
- X (formerly Twitter): $0.26 – $0.50
By network
Get a quick overview of social media advertising costs by network below:
| Network | Minimum budget | Average cost per click (CPC) | Average Cost per 1,000 impressions (CPM) |
| $7 – $70 per week | $0.26 – $0.50 | $1.01 – $3 | |
| $5 per week | $0.01 – $0.25 | $0.01 – $4 | |
| $10 per day | $2 – $3 | $5.01 – $8 | |
| None | $0.01 – $0.10 | $0.01 – $1.50 | |
| TikTok | $50+ per day | $1 | $10 |
| YouTube | None | $0.11 – $0.40 | $9.68 |
| X (formerly Twitter) | None | $0.26 – $0.50 | $6.50 |
Social media advertising costs for Facebook include: With over 2 billion daily active users, Facebook is a go-to advertising channel for any business. That’s why many companies want to know how much Facebook advertising costs, so they can build a reasonable budget. Remember, though, that these numbers are only averages. Depending on your business and social media ad strategy, you may have a higher or lower budget. That’s why it’s helpful to use these numbers as a benchmark, rather than as a standard. Social media advertising costs for Instagram include: With 2 billion monthly active users, Instagram provides businesses with a new channel for reaching consumers. In fact, 80% of global businesses advertise on the platform, which speaks to its unique advantages to those looking to break into social media advertising. That competitive advantage, however, results in higher ad costs. It’s important to mention that while Facebook and Instagram share a similar monthly ad spend, your campaign performances can vary due to average costs for CPC and CPM. That’s why, if Instagram performs well for your business, you may increase your monthly ad spend beyond the average. Social media advertising costs for LinkedIn include: As the leading professional social media network with over 1 billion global users, LinkedIn is a useful lead generation platform for business-to-business (B2B) organizations and companies looking for top talent. Social media advertising costs for Pinterest include: Each month, 482 million people use Pinterest. For business-to-consumer (B2C) organizations, Pinterest offers a unique opportunity for reaching and engaging with their target market. Explore Pinterest Advertising Costs Social media advertising costs for TikTok include: $20 per day for ad groups As the 6th most used social platform globally, TikTok presents an excellent opportunity for your business to reach more people. To get your business in front of more TikTok users, you’ll want to invest in TikTok advertising — which means you need to know the TikTok advertising costs. Social media advertising costs for YouTube include: Social media advertising costs for Twitter (now X) include:Facebook
Cost
Average
Ad spend (Monthly)
$101 – $500
Ad management (Monthly)
10% – 20% of ad spend
Minimum budget
$7 – $70 per week
CPC
$0.26 – $0.50
CPM
$1.01 – $3
Cost per reaction
$0.01 – $0.25
Cost per install
$0.01 – $5

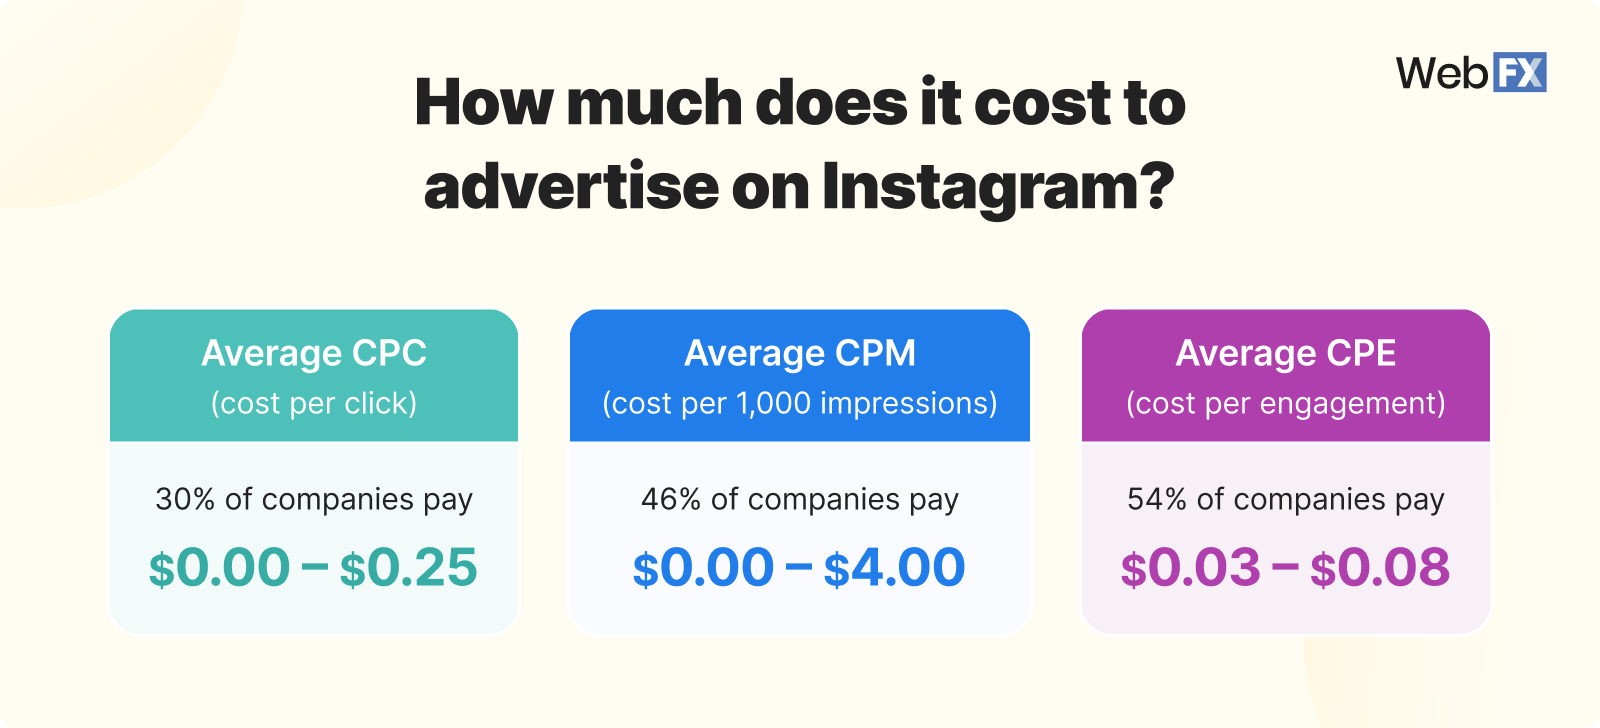
Instagram
Cost
Average
Ad spend (Monthly)
$101 – $500
Ad management (Monthly)
10% – 20% of ad spend
Minimum budget
$5 per week
CPC
$0.01 – $0.25
CPM
$0.01 – $4
Cost per engagement
$0.03 – $0.08
LinkedIn
Cost
Average
Ad spend (Monthly)
$0.01 – $100
Ad management (Monthly)
10% – 20% of ad spend
Minimum budget
$10 per day
CPC
$2 – $3
CPM
$5.01 – $8
Per send
$0.26 – $0.50
Pinterest
Cost
Average
Ad spend (Monthly)
$0.01 – $100
Ad management (Monthly)
10% – 20% of ad spend
Minimum budget
None
CPC
$0.01 – $0.10
CPM
$0.01 – $1.50
Per conversion
$0.01 – $2
TikTok
Cost
Average
Ad spend (Monthly)
$101 – $500
Ad management (Monthly)
10% – 20% of ad spend
Minimum ad budget
$50 per day for campaigns
CPC
$1
CPM
$10
YouTube
Cost
Average
Ad spend (Monthly)
$501 – $1,000
Ad management (Monthly)
10% – 20% of ad spend
Minimum budget
None
CPC
$0.11 – $0.40
CPM
$9.68
Cost per view
$0.31 – $0.40
X or Twitter
Cost
Average
Ad spend (Monthly)
$101 – $500
Ad management (Monthly)
10% – 20% of ad spend
Minimum budget
None
CPC
$0.26 – $0.50
CPM
$6.50
Per follow
$1.01 – $2
Per first action
$0.26 – $0.50
What determines social media advertising costs?
| Expense | Cost Factor |
| Ad spend |
|
| Ad management |
|
Learn how these factors shape your social media advertising costs below:
Ad spend
The following factors determine your ad spend:
- Overall ad budget: How much businesses allocate for social media advertising comes from their overall ad budgets, which are shaped by the organization’s size and investment in marketing.
- Ad network: Your ad network is where your ad spend goes — like Facebook or X. Different networks have different costs, whether due to bidding models, ad types, or audience. LinkedIn, for example, is known for having some of the highest costs for social media ads.
Ad management
The following factors determine your ad management costs:
- Ad spend: Your ad spend is how much you pay to each social media platform. For example, you may have an advertising budget of $800, which includes a $500 ad spend. The remaining $300 goes to other social media advertising costs, like hiring a freelance graphic designer.
- Service provider: Your ad management generally refers to what you pay an agency to manage your social media advertising campaign. This cost is optional. Agencies, however, can offer significant value in the quality and performance of your ad strategy.
- Technology: Your technology is what you spend on software for managing and monitoring your social media ad campaign. Companies often use free and paid applications. In some cases, your agency, like WebFX, provides you access to exclusive and advanced marketing software.
- Talent: Your talent can include in-house and outsourced labor. For example, your team may hire a freelance copywriter to develop your ad copy. Or, you may hire a social media agency to lead and manage your campaign.
Are social media ads worth the cost?
Yes! In fact, 74% of businesses say that social media advertising is effective. With the right campaign, ad creatives, and audience targeting, you can drive a positive return from social media ads to drive more revenue for your business.

You can see social media advertising’s effectiveness in advertiser satisfaction:

How much should you spend on social media advertising?
While it’s helpful to know what other businesses spend on social media advertising, it’s important to remember that businesses are unique — just because one company advertises on LinkedIn doesn’t mean your business should.

When considering how much you should spend on social media advertising, ask these questions:
- Who is our audience? Certain platforms are known for attracting certain users. TikTok, for example, is popular with younger users, while older users frequent Facebook. Use this information to focus on the networks with the best chance of reaching your market.
- What is our goal? Get aligned with stakeholders on what your business wants to accomplish with social media. For example, is building brand awareness or generating new leads the goal?
- How much time is available? Understand that someone — whether internally or a third party, like a freelancer or agency — will need to manage your advertising efforts regularly. Your available time (and budget) will influence the scale and depth of your program.
- What are our other marketing initiatives? Marketers need to make strategic decisions about their budgets, which can influence your spending on social media advertising. Proven strategies often receive more budget, while untested ones receive less.
No matter the budget set, remember to track social media advertising’s return on ad spend (ROAS). Without that information, it’s difficult to understand if social media ads support your organization’s goals.
An Inside Look at WebFX Social Media Pricing
🔎 Full-funnel ROI tracking What Sets WebFX Apart Our social media advertising specialists are ready to help you drive revenue with social ads through proven strategies and cutting-edge expertise.
Highlights
🎯 Audience targeting
📈 Campaign performance monitoring and optimization
📝 Professional ad copywriting and design
🎥 Video production
Maximize Your Social Media Budget with WebFX
With 30 years of experience and unmatched technology, our team helps businesses generate revenue 1.8x faster than industry average.
Get your custom, no-obligation strategy proposal today!


Optimize your social media advertising costs
If you’re looking for a performance-driven campaign that provides your business with actual, tangible results, choose WebFX. Our advertising agency has decades of experience, custom strategies, and a team of more than 750 digital marketing specialists, we can help your business improve its brand awareness and more.
Discover how we can grow your company by contacting us online or calling us at 888-601-5359 today!
-
 Sarah Berry is a Lead SEO Consultant at one of the largest digital marketing agencies in the USA — WebFX. With more than 10,000 hours of experience, she offers practical insights and strategies to grow your digital revenue. Her work has been cited by Michigan State University, Business Insider, and Ars Technica. When she isn’t polishing her Time Magazine Person of the Year Award, she’s spending time with her flock of ducks. View full profile
 -

WebFX is a full-service digital marketing agency delivering revenue-driving strategies across online advertising, SEO and AI search optimization, and digital marketing. Backed by 1,100+ client reviews, a 4.9-star rating on Clutch, and proprietary revenue-tracking technology, our team helps businesses grow visibility and revenue across platforms, from Google to ChatGPT to LinkedIn. Discover how our expert team and revenue-accelerating tech can drive results for you. Learn more
74% of people use social media when making a purchasing decision.
Make their decision easy with a stellar social media presence. See how your brand can level up by requesting a no-obligation proposal today.
One of our experts will be in touch within 24 hours!
Share this article

Social Media Success Story

74% of people use social media when making a purchasing decision.
Make their decision easy with a stellar social media presence. See how your brand can level up by requesting a no-obligation proposal today.
One of our experts will be in touch within 24 hours!
What to read next


FAQs on social media advertising pricing
Get answers to common social media advertising pricing questions now!
What is the average overall cost of social media advertising?
The average cost of social media advertising ranges from $10,000 – $25,000 per year. This amount includes advertising on multiple networks, as well as expenses related to technology, talent, and professional management.
For professional social media advertising services, prices range from $850 to $2,000 per month. This rate does not include ad spend. Agencies like WebFX, however, recommend an ad spend of $200 to $1,000 or more to maximize the results and performance of your campaign.
What is the average CPC for social media ads?
With social media advertising, your business can use several bidding options, like cost-per-like (CPL) or cost-per-view (CPV). A universal bidding option, however, is cost-per-click or CPC. That’s why many companies, when looking at the cost of social media advertising, research CPC first.
Average cost per click
- Facebook: $0.26 – $0.50
- Instagram: $0.01 – $0.25
- LinkedIn: $2 – $3
- Pinterest: $0.01 – $0.10
- Twitter: $0.26 – $0.50
- YouTube: $0.11 – $0.40
What is the average CPM for social media ads?
The top social media networks also offer cost-per-thousand-impressions or CPM as a bidding option. With this bidding option, your company focuses on ad views rather than ad clicks. The average cost for CPM is generally higher because you’re paying per 1000 impressions, versus a single click.
Get a breakdown of social media advertising costs by CPM below:
Average cost per 1000 impressions
- Facebook: $1.01 – $3
- Instagram: $0.01 – $4
- LinkedIn: $5.01 – $8
- Pinterest: $0.01 – $1.50
What’s the difference between a social media advertising budget and bid?
To understand the difference between a budget and a bid, you need to know ad hierarchy.
When you advertise online, you have your campaign, which includes a set of ad groups. Each ad group contains ads. For example, you may have a campaign for red shoes, with an ad group for red sneakers and an ad group for red heels.
Now, when you create a campaign for social media, you set a budget. A budget is what you’re willing to spend each month on your campaign. In some cases, you may not use your entire monthly budget, due to campaign performance.

Once you determine your campaign budget, as well as build your ad groups, you set your bids. A bid is what you’re willing to pay for a user to complete an action on your ad, like following your page or viewing your video.
Keep in mind that your company doesn’t always pay your full bid amount.
Depending on the quality of your ad, as well as additional factors, you may pay less — you will never pay more than your bid. That’s why companies try to achieve high ad quality scores because it can help maximize their social media advertising costs.
What are the different social media ad bidding options?
When you advertise on social media, you have access to several bidding options, including:
- Cost-per-click (CPC): You pay every time someone clicks on your ad.
- Cost-per-impressions (CPM): You pay for every 1000 ad impressions or views.
A few bidding options specific to different platforms include:
- Cost-per-reaction: You pay for every Facebook reaction (including likes) resulting from your ad.
- Cost-per-action (CPA): You pay for every action generated from your Facebook ad.
YouTube
- Cost-per-view (CPV): You pay for every view on your YouTube ad.
- Cost-per-send (CPS): You pay for every LinkedIn Sponsored mail sent.
- Cost-per-open (CPO): You pay for every LinkedIn Sponsored mail opened.
X
- Cost-per-engagement (CPE): You pay for every Twitter ad
- Cost-per-follow (CPF): You pay for every follower resulting from your Twitter ad.
- Cost-per-download (CPD): You pay for every download generated from your Twitter ad.
TikTok
- Optimized CPM (oCPM): You pay for every 1000 impressions, but oCPM targets users most likely to complete a conversion or similar advertising goal.
- Cost-per-thousand views (CPV): You pay for every 1000 video views. Your views can be either 2-second or 6-second views.
Why do companies advertise on social media?
The majority of businesses advertise on social media to build brand awareness (39% of respondents) and drive sales (31% of respondents). While 17% of businesses use social media ads to generate leads while 12% of businesses advertise on social media to drive web traffic.

Source Data
| WHY ADVERTISE ON SOCIAL MEDIA | % OF MARKETERS |
| To build awareness | 39.26% |
| To generate leads | 17.41% |
| To drive sales | 31.11% |
| To increase website traffic | 12.22% |