
Table of Contents
- What is PPC benchmarking, and why does it matter?
- 2026 PPC benchmarks (and how you stack up)
- PPC cost benchmarks
- PPC performance benchmarks
- PPC profitability and planning benchmarks
- How to use PPC benchmarks to improve your ROI
- 1. Benchmark before you optimize
- 2. Contextualize your CPL with margins and deal cycle
- 3. Audit Quality Score if CPC is rising faster than industry averages
- 4. Use competitor spend as a reality check, not a target
- 5. Track the metrics that matter to your business
- 6. Revisit benchmarks quarterly
- FAQs about 2026 PPC benchmarks
- You know where you stand. Now get ahead.
- Data sources & methodology
TL;DR: 2026 PPC Benchmarks (fast facts)
- Cost benchmarks: Average CPL ranges from $80 (Leisure B2B) to $819 (Manufacturing B2B), while median CPC spans $20–$25 (Logistics) to $900–$1,100 (Insurance). YoY CPC increases range from +7% (Real Estate) to +18% (Healthcare). PPC costs are rising across the board.
- Performance benchmarks: Average CTR for Google Search ads is ~6.66%, with median ROAS around 3.5:1. Lead-to-customer conversion rates vary by industry, from 1.90% (Heavy Equipment, Leisure) to 4.60% (Professional Services). Top advertisers spend $80K–$100K/month (Home Services) to $2.8M–$3.4M/month (Insurance).
- Profitability and planning benchmarks: Deal cycles range from 30 days (Professional Services) to 365 days (Transportation). Gross margins span 25% (Transportation) to 80% (SaaS B2B). High CPL isn’t always bad: Context like deal cycle, margins, and deal size determines whether your spend makes sense.
“Is this CPL good or bad?” It’s the question that haunts every pay-per-click (PPC) specialist sitting in a budget review meeting, trying to justify ad spend to leadership who wants answers (not guesses).
The truth is, you can’t defend your PPC performance without knowing what others in your industry are paying. And you definitely can’t plan next quarter’s budget on vibes alone. That’s why PPC industry benchmarks are important. They give you the real numbers to compare against, so you can walk into that meeting with data, not hope.
If you’re unsure how to weigh up your numbers, well, we’ve done the research for you. We’ve broken down 2026 PPC benchmarks across industries to give you real numbers and expert insights to prove (or improve) your paid campaigns.
Let’s get going:
- What is PPC benchmarking, and why does it matter?
- 2026 PPC benchmarks (and how you stack up)
- How to use PPC benchmarks to improve your ROI
- FAQs about 2026 PPC benchmarks
Don’t miss our Revenue Weekly emails!
Join 200K smart marketers for the hottest marketing news and insights in your inbox.
Inline Subscription Form
“*” indicates required fields
What is PPC benchmarking, and why does it matter?
PPC benchmarking equips you with industry-average metrics that show you what “normal” looks like for paid advertising performance. They are the baseline numbers you measure your own campaigns against.
The most common paid search benchmarks include:
- Cost per lead (CPL): How much you pay to generate a single lead
- Cost per click (CPC): How much you pay each time someone clicks your ad
- Click-through rate (CTR): The percentage of people who see your ad and actually click
- Return on ad spend (ROAS): How much revenue you generate for every dollar spent on ads
- Conversion rate (CVR): The percentage of clicks that turn into leads or customers
So why do these numbers matter? Because without them, you’re burning budget in vain.
A $150 CPL might feel expensive until you realize the average CPL for paid ads in your industry is $350. Or that $50 CPC might seem like a steal until you learn competitors in your space pay $25.
PPC benchmarking gives you the context to know if your campaigns are actually performing or just wasting spend. In short, PPC industry benchmarks turn “I think we’re doing okay” into “Here’s exactly where we stand.”
2026 PPC benchmarks (and how you stack up)
Now for the numbers you came here for. We’ve organized these paid search benchmarks into three categories. Each section includes data across industries, pulled from proprietary WebFX data and third-party intelligence. Find your industry, compare your numbers, and see where you stand.
What’s on the agenda:
- PPC cost benchmarks: average CPL, average CPC, CPC trends, top advertiser spend, and highest CPC keywords
- PPC performance benchmarks: average CTR, average ROAS, conversion rates, and industry CAGR
- PPC profitability and planning benchmarks: deal cycles, gross margins, marketing spend, and common pain points
PPC cost benchmarks
This is where most conversations around PPC industry benchmarks start: How much should I be paying?
The answer depends on your industry, your audience (B2B vs. B2C), and what you’re measuring. Here’s how the numbers break down.
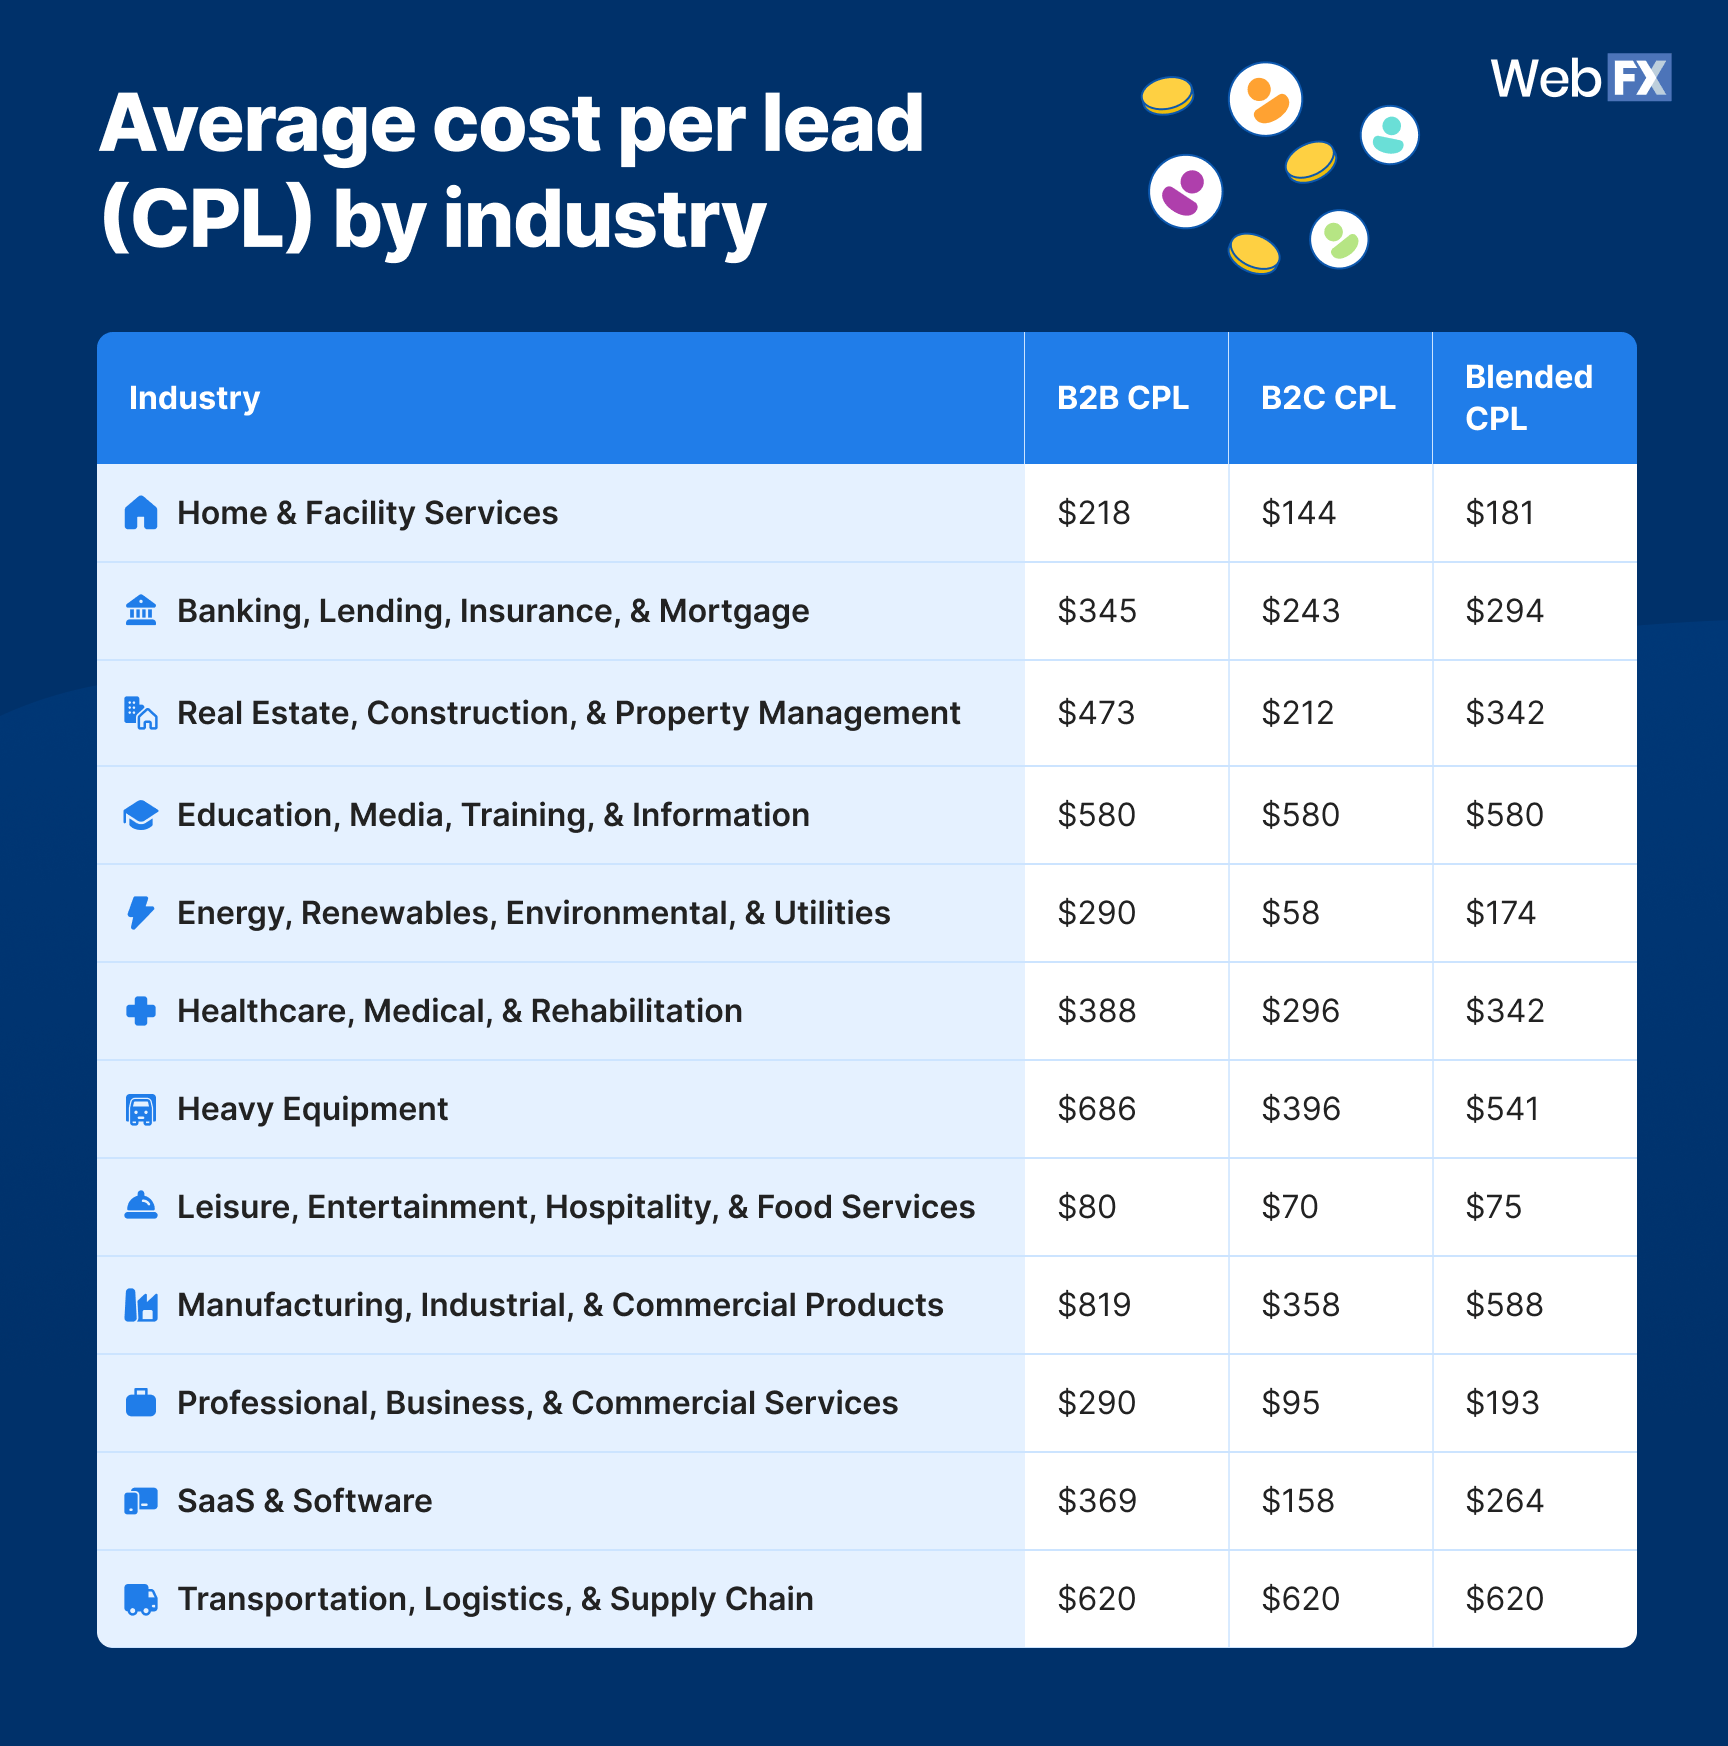
Average cost per lead (CPL) by industry
Cost per lead (CPL) tells you how much you’re spending to generate a single lead. In PPC benchmarking, it’s the metric that ties your ad spend directly to pipeline.
Source data
| Industry | B2B CPL | B2C CPL | Blended CPL |
| Home & Facility Services | $218 | $144 | $181 |
| Banking, Lending, Insurance, & Mortgage | $345 | $243 | $294 |
| Real Estate, Construction, & Property Management | $473 | $212 | $342 |
| Education, Media, Training, & Information | $580 | $580 | $580 |
| Energy, Renewables, Environmental, & Utilities | $290 | $58 | $174 |
| Healthcare, Medical, & Rehabilitation | $388 | $296 | $342 |
| Heavy Equipment | $686 | $396 | $541 |
| Leisure, Entertainment, Hospitality, & Food Services | $80 | $70 | $75 |
| Manufacturing, Industrial, & Commercial Products | $819 | $358 | $588 |
| Professional, Business, & Commercial Services | $290 | $95 | $193 |
| SaaS & Software | $369 | $158 | $264 |
| Transportation, Logistics, & Supply Chain | $620 | $620 | $620 |
The gap between industries is massive. A $300 CPL in Manufacturing is solid. The same number in Leisure would be a disaster. Context matters.
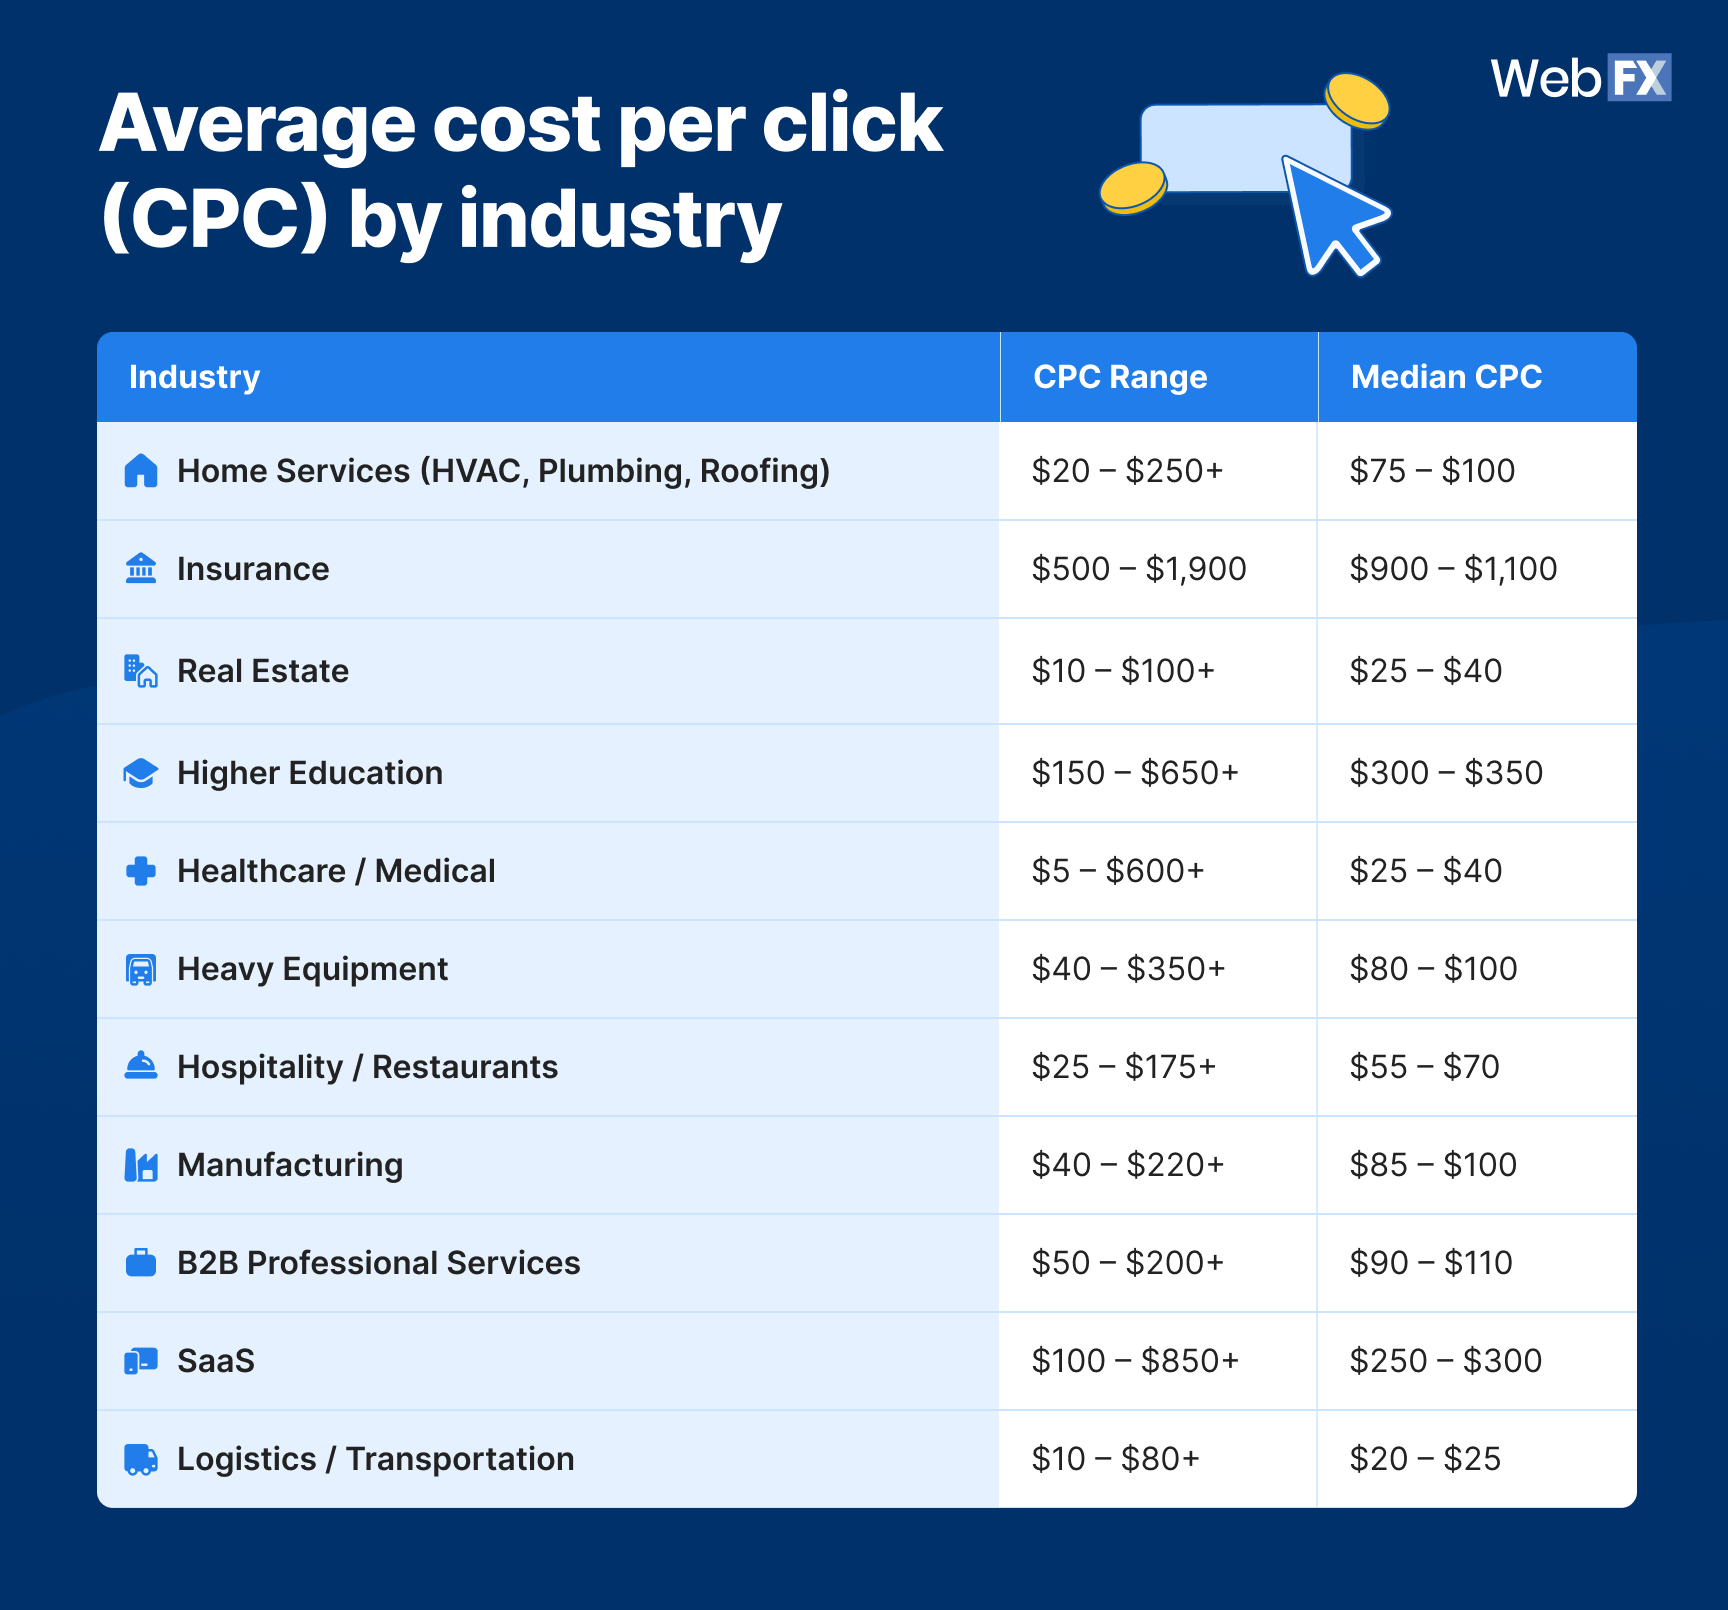
Average cost per click (CPC) by industry
Cost per click (CPC) is one of the most referenced paid search benchmarks. It measures what you pay each time someone clicks your ad. It’s influenced by competition, keyword intent, and Quality Score.
Source data
| Industry | CPC Range | Median CPC |
| Home Services (HVAC, Plumbing, Roofing) | $20 – $250+ | $75 – $100 |
| Insurance | $500 – $1,900 | $900 – $1,100 |
| Real Estate | $10 – $100+ | $25 – $40 |
| Higher Education | $150 – $650+ | $300 – $350 |
| Healthcare / Medical | $5 – $600+ | $25 – $40 |
| Heavy Equipment | $40 – $350+ | $80 – $100 |
| Hospitality / Restaurants | $25 – $175+ | $55 – $70 |
| Manufacturing | $40 – $220+ | $85 – $100 |
| B2B Professional Services | $50 – $200+ | $90 – $110 |
| SaaS | $100 – $850+ | $250 – $300 |
| Logistics / Transportation | $10 – $80+ | $20 – $25 |
Insurance dominates as the most expensive CPC space, with median clicks costing $900 – $1,100. Logistics and Real Estate sit on the other end, with median CPCs under $40.
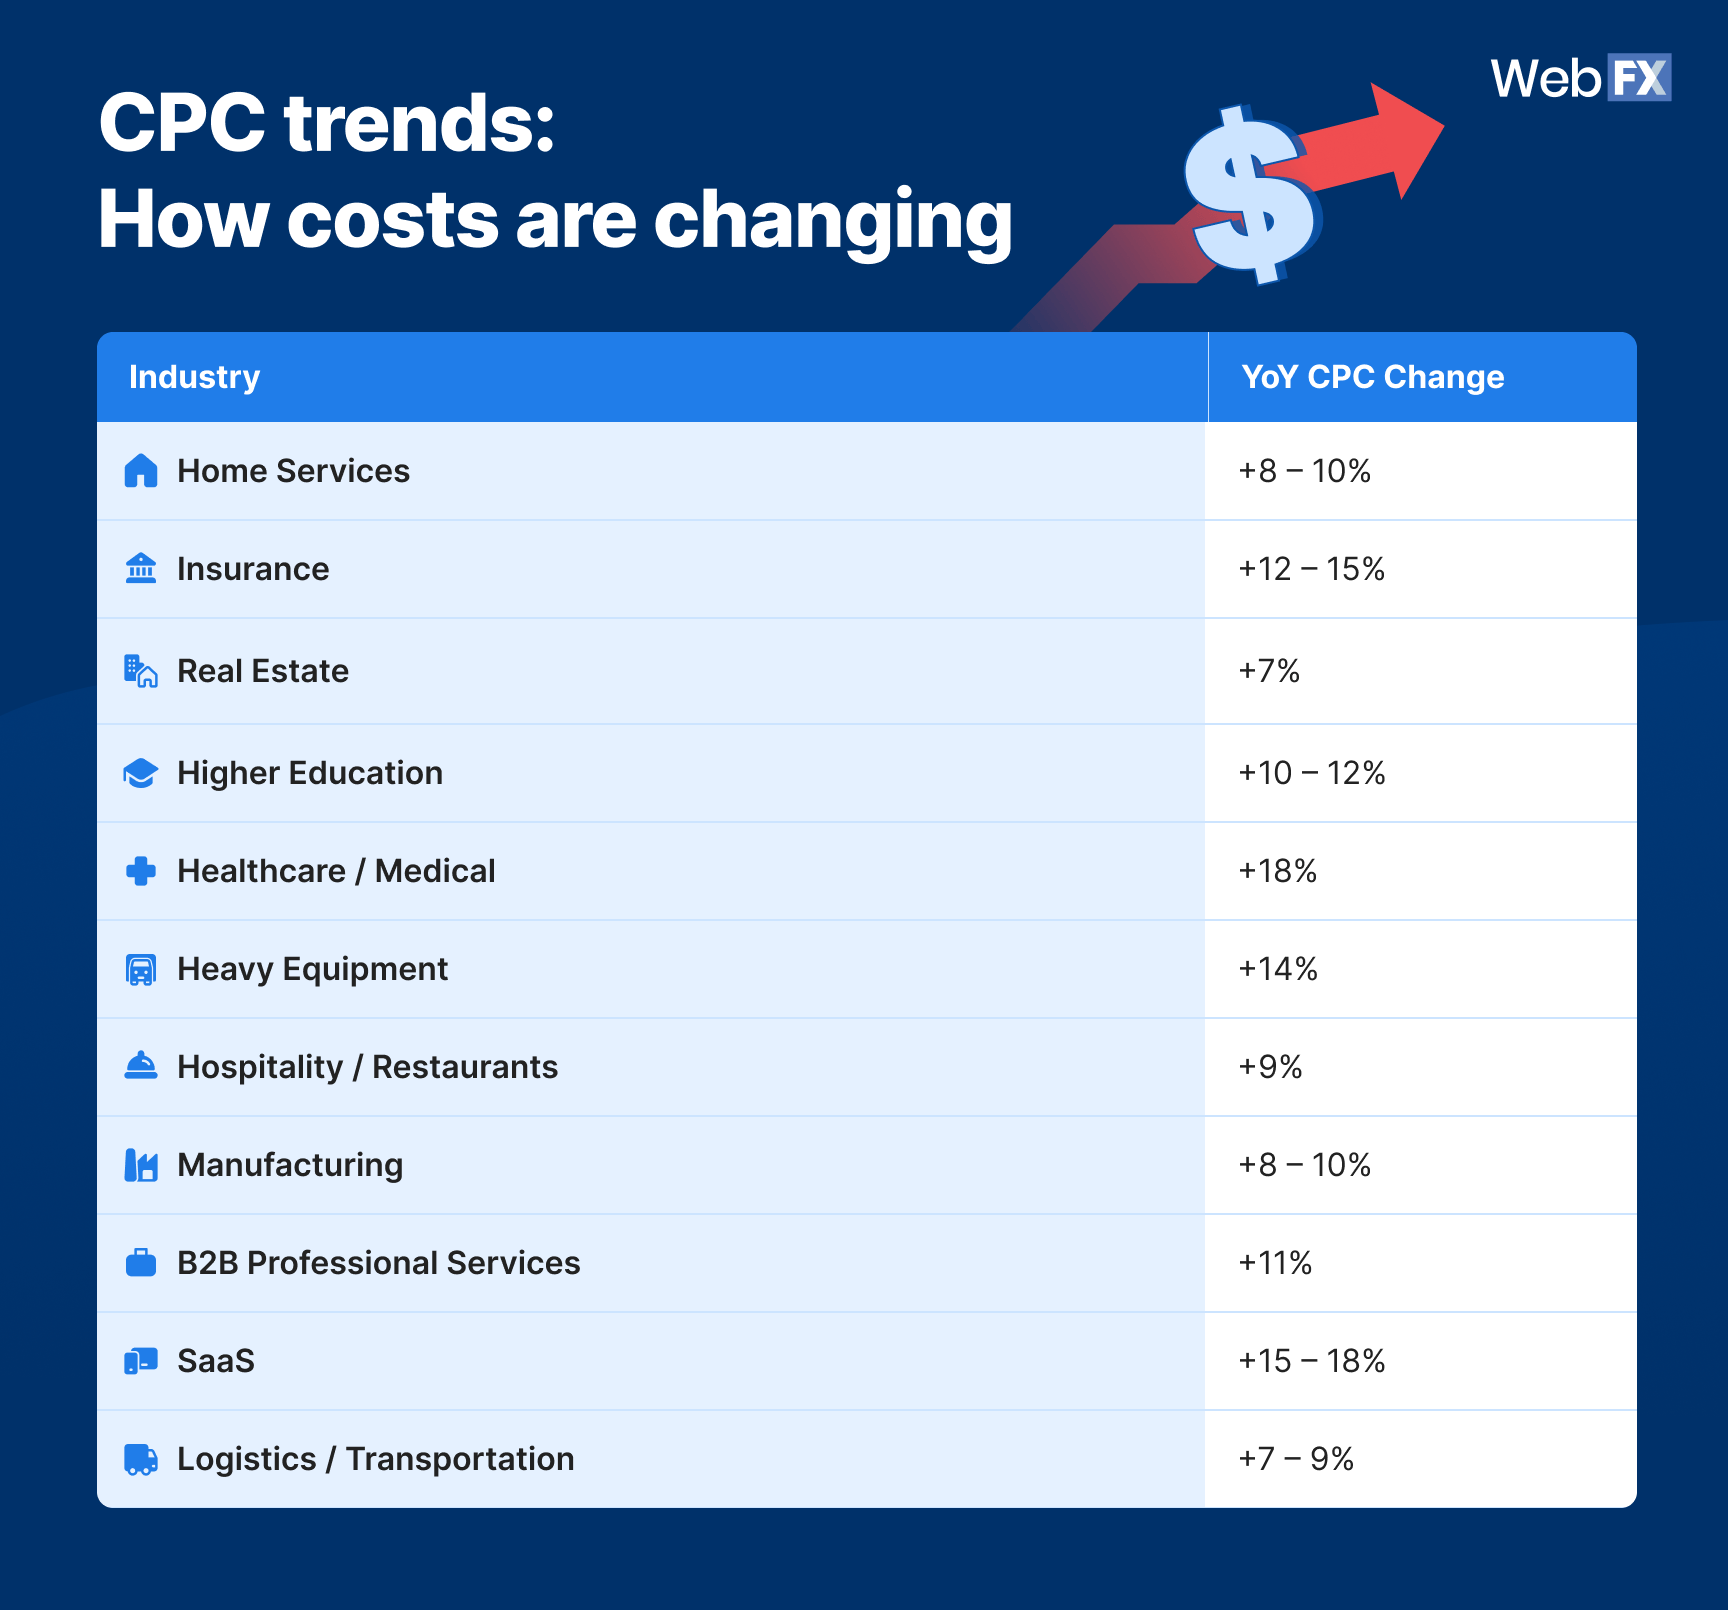
CPC trends: How costs are changing
PPC isn’t getting cheaper. Here’s how CPCs shifted year-over-year:
Source data
| Industry | YoY CPC Change |
| Home Services | +8 – 10% |
| Insurance | +12 – 15% |
| Real Estate | +7% |
| Higher Education | +10 – 12% |
| Healthcare / Medical | +18% |
| Heavy Equipment | +14% |
| Hospitality / Restaurants | +9% |
| Manufacturing | +8 – 10% |
| B2B Professional Services | +11% |
| SaaS | +15 – 18% |
| Logistics / Transportation | +7 – 9% |
Healthcare saw the steepest climb at +18%, driven largely by competition around weight-loss drugs and telehealth. SaaS follows close behind at +15 – 18%, fueled by consolidation in the CRM and automation space. So, if your CPCs feel higher than last year, they probably are.
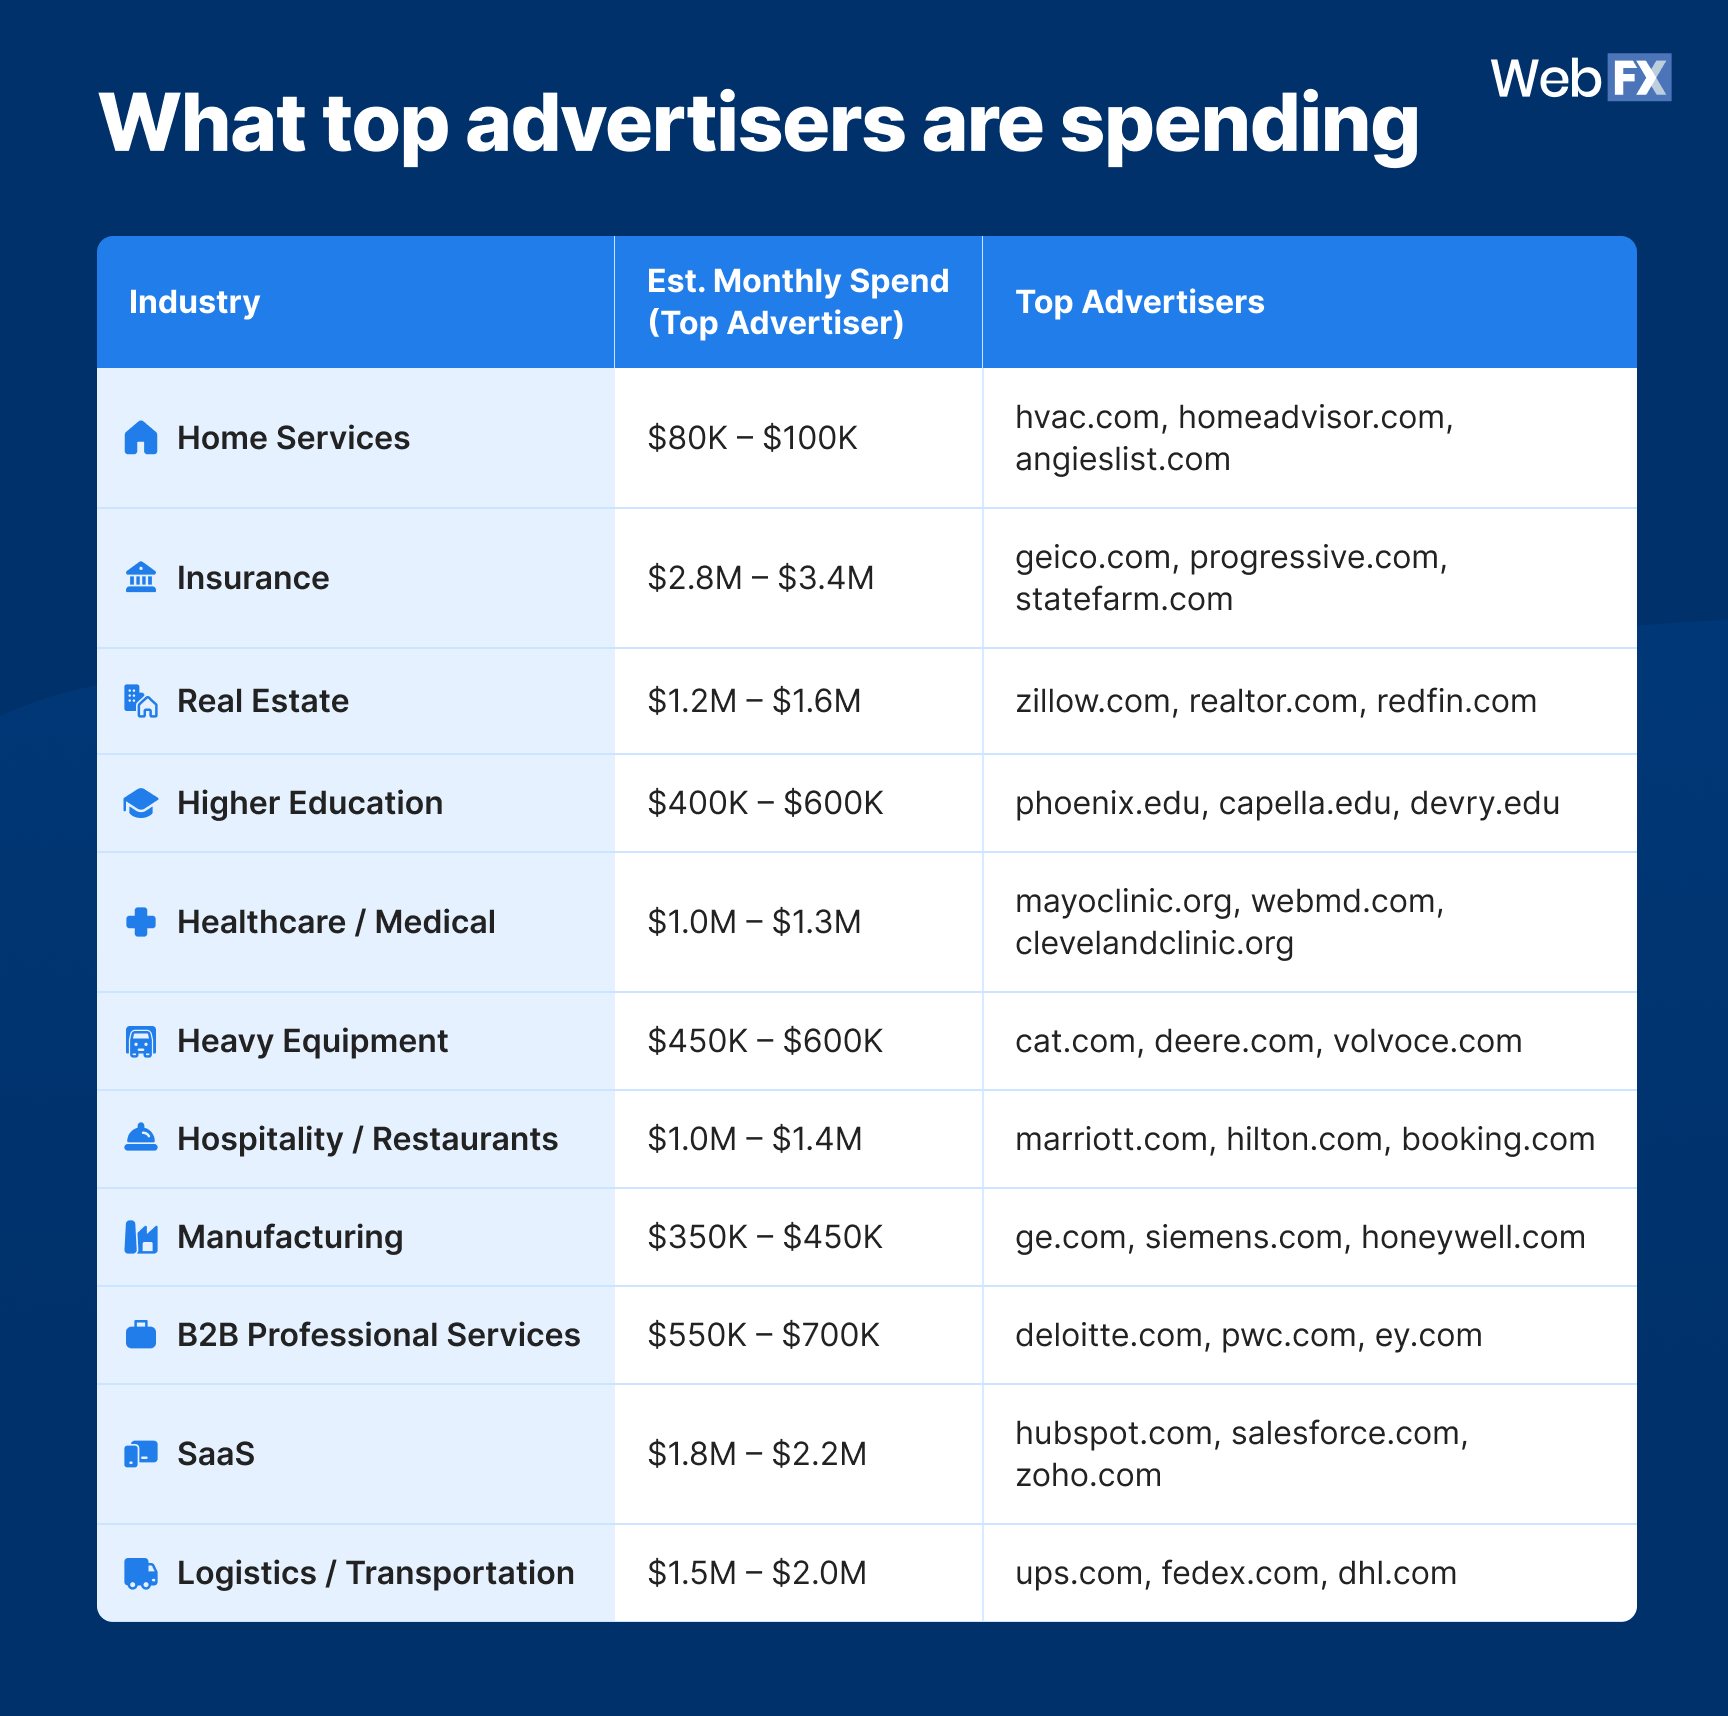
What top advertisers are spending
Want to know what it costs to compete at the top? Here’s what leading brands invest monthly in paid search:
Source data
| Industry | Est. Monthly Spend (Top Advertiser) | Top Advertisers |
| Home Services | $80K – $100K | hvac.com, homeadvisor.com, angieslist.com |
| Insurance | $2.8M – $3.4M | geico.com, progressive.com, statefarm.com |
| Real Estate | $1.2M – $1.6M | zillow.com, realtor.com, redfin.com |
| Higher Education | $400K – $600K | phoenix.edu, capella.edu, devry.edu |
| Healthcare / Medical | $1.0M – $1.3M | mayoclinic.org, webmd.com, clevelandclinic.org |
| Heavy Equipment | $450K – $600K | cat.com, deere.com, volvoce.com |
| Hospitality / Restaurants | $1.0M – $1.4M | marriott.com, hilton.com, booking.com |
| Manufacturing | $350K – $450K | ge.com, siemens.com, honeywell.com |
| B2B Professional Services | $550K – $700K | deloitte.com, pwc.com, ey.com |
| SaaS | $1.8M – $2.2M | hubspot.com, salesforce.com, zoho.com |
| Logistics / Transportation | $1.5M – $2.0M | ups.com, fedex.com, dhl.com |
You don’t need a multimillion-dollar budget to compete. But knowing what the top players spend helps you set realistic expectations for your market.
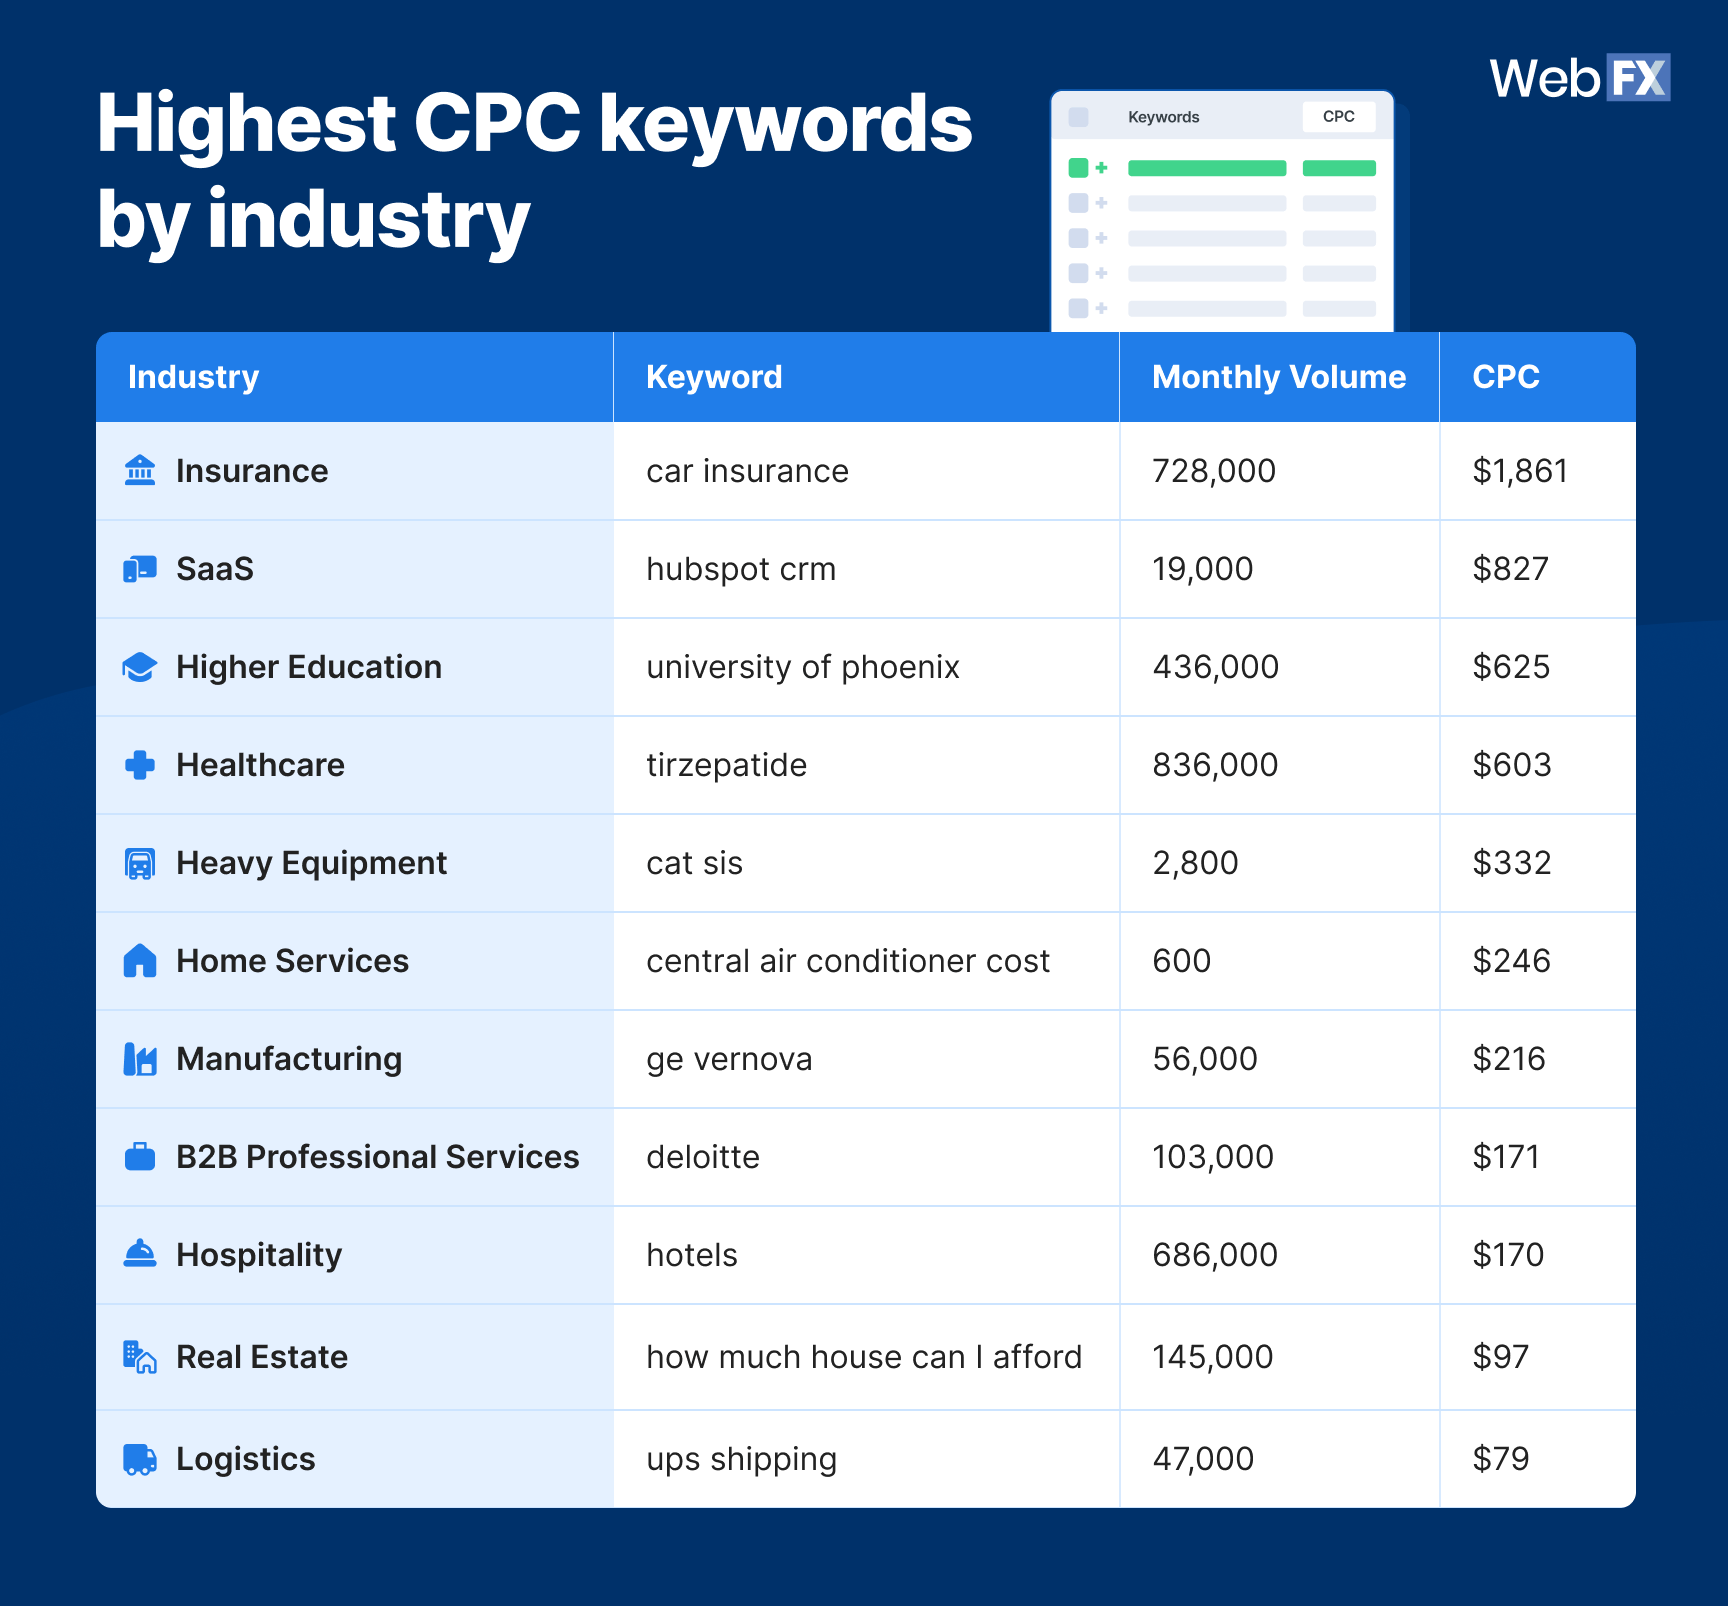
Highest CPC keywords by industry
Where’s the money going? These are some of the most expensive keywords by industry:
Source data
| Industry | Keyword | Monthly Volume | CPC |
| Insurance | car insurance | 728,000 | $1,861 |
| SaaS | hubspot crm | 19,000 | $827 |
| Higher Education | university of phoenix | 436,000 | $625 |
| Healthcare | tirzepatide | 836,000 | $603 |
| Heavy Equipment | cat sis | 2,800 | $332 |
| Home Services | central air conditioner cost | 600 | $246 |
| Manufacturing | ge vernova | 56,000 | $216 |
| B2B Professional Services | deloitte | 103,000 | $171 |
| Hospitality | hotels | 686,000 | $170 |
| Real Estate | how much house can I afford | 145,000 | $97 |
| Logistics | ups shipping | 47,000 | $79 |
These keywords represent high-intent, bottom-of-funnel searches. They’re expensive because they convert.
What the data tells us
- B2B CPL runs significantly higher than B2C in most industries, with Manufacturing ($819 B2B vs. $358 B2C) and Heavy Equipment ($686 vs. $396) showing the widest gaps
- Insurance is the most expensive PPC space across the board, with median CPCs of $900 – $1,100 and top advertisers spending $2.8M – $3.4M monthly
- CPCs are rising everywhere, but Healthcare (+18%) and SaaS (+15 – 18%) are inflating fastest
- The highest CPC keywords are transactional and product-specific, not generic brand terms
How to act on it
- Benchmark your CPL against your specific industry and audience type (B2B vs. B2C) before judging performance
- Audit your Quality Score and keyword targeting first if your CPC is rising faster than industry averages
- Don’t chase expensive head terms unless your margins support it. Long-tail keywords often deliver better ROI
- Study what top advertisers in your space are bidding on. Their keyword strategy reveals what converts
PPC performance benchmarks
Cost tells you what you’re spending. Performance tells you if it’s working.
This section covers the metrics that separate campaigns burning cash from campaigns driving revenue. Use these paid search benchmarks to gauge whether your PPC performance is actually good or just “good enough.”
Average click-through rate (CTR)
Click-through rate (CTR) measures how often people who see your ad actually click it. It’s a direct signal of ad relevance and audience targeting.
The average CTR for Google Search ads is ~6.66% across industries.
That said, CTR varies heavily by industry and ad format. Search ads typically outperform display. Branded keywords outperform generic. If your CTR sits below 3%, it’s time to revisit your ad copy and targeting.
Average return on ad spend (ROAS)
Return on ad spend (ROAS) answers the most important question: For every dollar you put in, how much do you get back?
The median ROAS for Google Ads is ~3.5:1 across industries, meaning $3.50 returned for every $1 spent.
Here’s how to read your ROAS:
- Above 4:1: Strong performance. Your campaigns are profitable.
- Between 2:1 and 4:1: Acceptable, but room to optimize.
- Below 2:1: You’re likely losing money. Time to audit.
ROAS alone doesn’t tell the full story. You need to factor in margins and customer lifetime value (CLTV). But as a quick gut-check, 3.5:1 is the number to beat.
Lead-to-customer conversion rate by industry
Clicks and leads are great. Customers are better. This metric (conversion rate) shows the percentage of leads that actually convert into paying customers.
| Industry | Avg Conversion Rate |
| Healthcare, Medical, & Rehabilitation | 3.00% |
| Heavy Equipment | 1.90% |
| Leisure, Entertainment, Hospitality, & Food Services | 1.90% |
| Manufacturing, Industrial, & Commercial Products | 2.20% |
| Professional, Business, & Commercial Services | 4.60% |
The spread here is notable. Professional Services leads convert at 4.60%, while Heavy Equipment and Leisure hover around 1.90%. If your conversion rate lags your industry average, the problem likely sits in your sales process or lead quality, not your ads.
Industry CAGR (2024–2031)
Compound annual growth rate (CAGR) matters for PPC because growing industries attract more competition, which drives up CPCs over time.
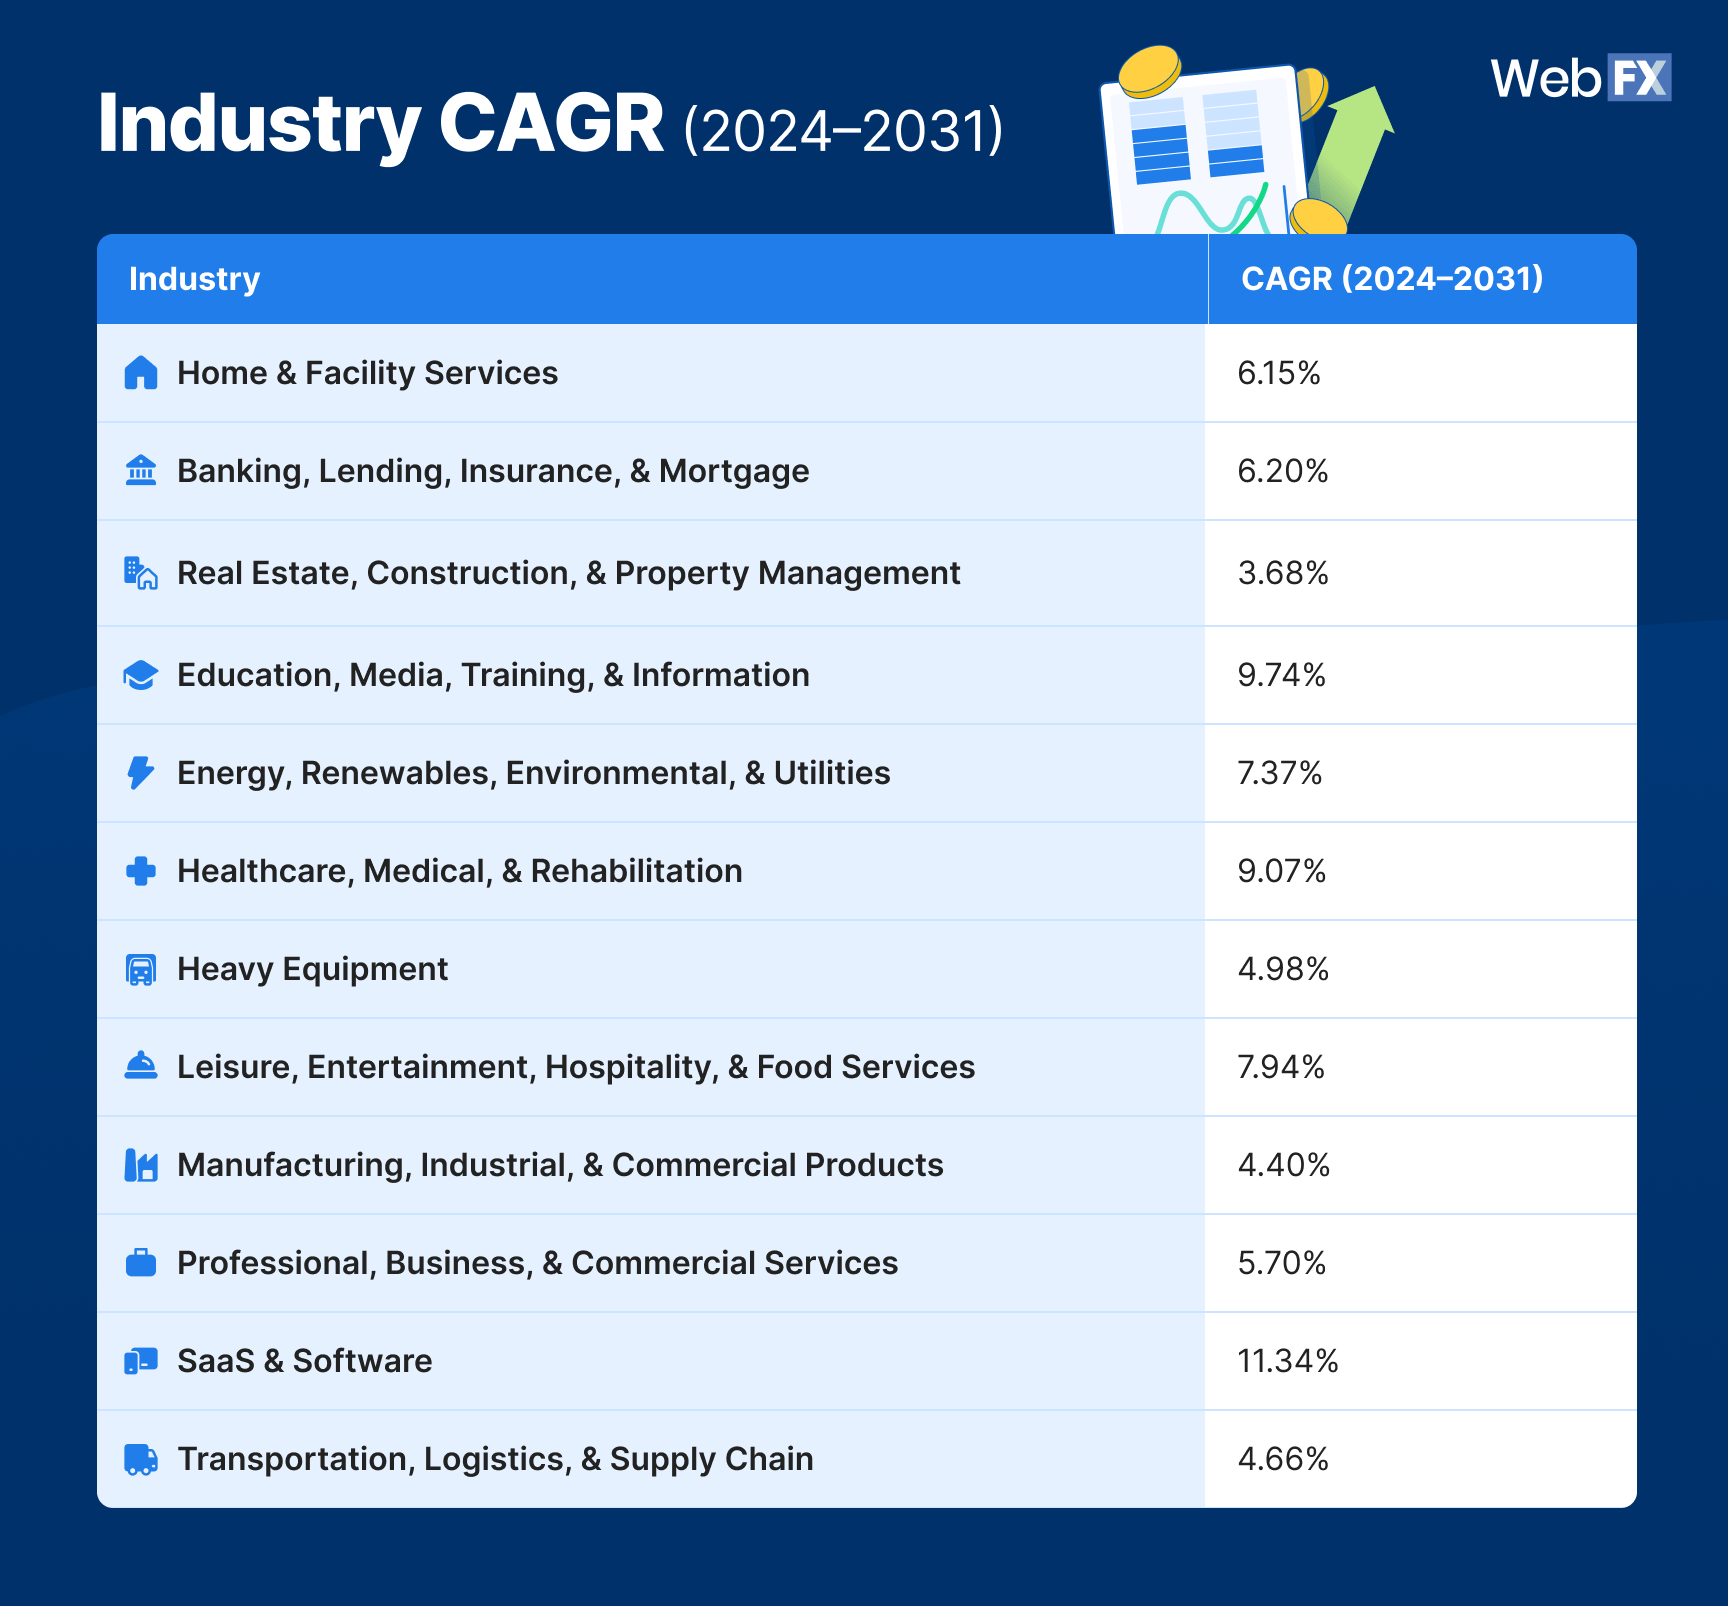
Source data
| Industry | CAGR (2024–2031) |
| Home & Facility Services | 6.15% |
| Banking, Lending, Insurance, & Mortgage | 6.20% |
| Real Estate, Construction, & Property Management | 3.68% |
| Education, Media, Training, & Information | 9.74% |
| Energy, Renewables, Environmental, & Utilities | 7.37% |
| Healthcare, Medical, & Rehabilitation | 9.07% |
| Heavy Equipment | 4.98% |
| Leisure, Entertainment, Hospitality, & Food Services | 7.94% |
| Manufacturing, Industrial, & Commercial Products | 4.40% |
| Professional, Business, & Commercial Services | 5.70% |
| SaaS & Software | 11.34% |
| Transportation, Logistics, & Supply Chain | 4.66% |
SaaS leads the pack at 11.34% CAGR, which explains why CPCs in that space jumped 15 to 18% YoY. Education (9.74%) and Healthcare (9.07%) also show strong projected growth, signaling increased competition ahead.
What the data tells us
- A 6.66% CTR and 3.5:1 ROAS are solid cross-industry benchmarks, but your targets should adjust based on margins and deal size
- High-CAGR industries face rising CPCs due to increased competition (SaaS at 11.34%, Education at 9.74%, Healthcare at 9.07%)
- Lead-to-customer conversion rates vary by industry. Professional Services converts at 4.60%, while Heavy Equipment and Leisure sit around 1.90%
- Lower conversion rates don’t always signal a problem. Industries like Heavy Equipment and Manufacturing offset this with longer sales cycles and higher deal values
How to act on it
- If CTR is below 3%, test new ad copy, tighten audience targeting, or revisit keyword match types
- Use ROAS as a quick health check, but factor in margins and CLTV before making PPC budget decisions
- Low lead-to-customer conversion? The issue might be lead quality or sales follow-up, not your ads
- Track industry CAGR. Rising competition in high-growth sectors means you’ll need to optimize harder just to maintain results
PPC profitability and planning benchmarks
Costs and performance metrics only tell part of the story. This section gives you the business context to understand whether your PPC investment actually makes sense for your bottom line.
A $500 CPL might look terrible on paper. But if your average deal is worth $50,000 and your sales cycle is 6 months, that $500 suddenly looks like a bargain. These PPC industry benchmarks help you connect the dots.
Deal cycle: How long until you see ROI
The deal cycle measures how many days it takes, on average, to close a sale in your industry. Longer cycles mean you need more patience (and runway) before judging PPC ROI.
| Industry | Avg Days to Close |
| Home & Facility Services | 60 |
| Banking, Lending, Insurance, & Mortgage | 60 |
| Real Estate, Construction, & Property Management | 120 |
| Education, Media, Training, & Information | 90 |
| Energy, Renewables, Environmental, & Utilities | 150 |
| Healthcare, Medical, & Rehabilitation | 125 |
| Heavy Equipment | 180 |
| Leisure, Entertainment, Hospitality, & Food Services | 85 |
| Manufacturing, Industrial, & Commercial Products | 130 |
| Professional, Business, & Commercial Services | 30 |
| SaaS & Software | 90 |
| Transportation, Logistics, & Supply Chain | 365 |
Professional Services closes fastest at 30 days, while Transportation and Logistics can stretch to a full year. If you’re in a long-cycle industry, don’t panic if leads take months to convert. That’s normal.
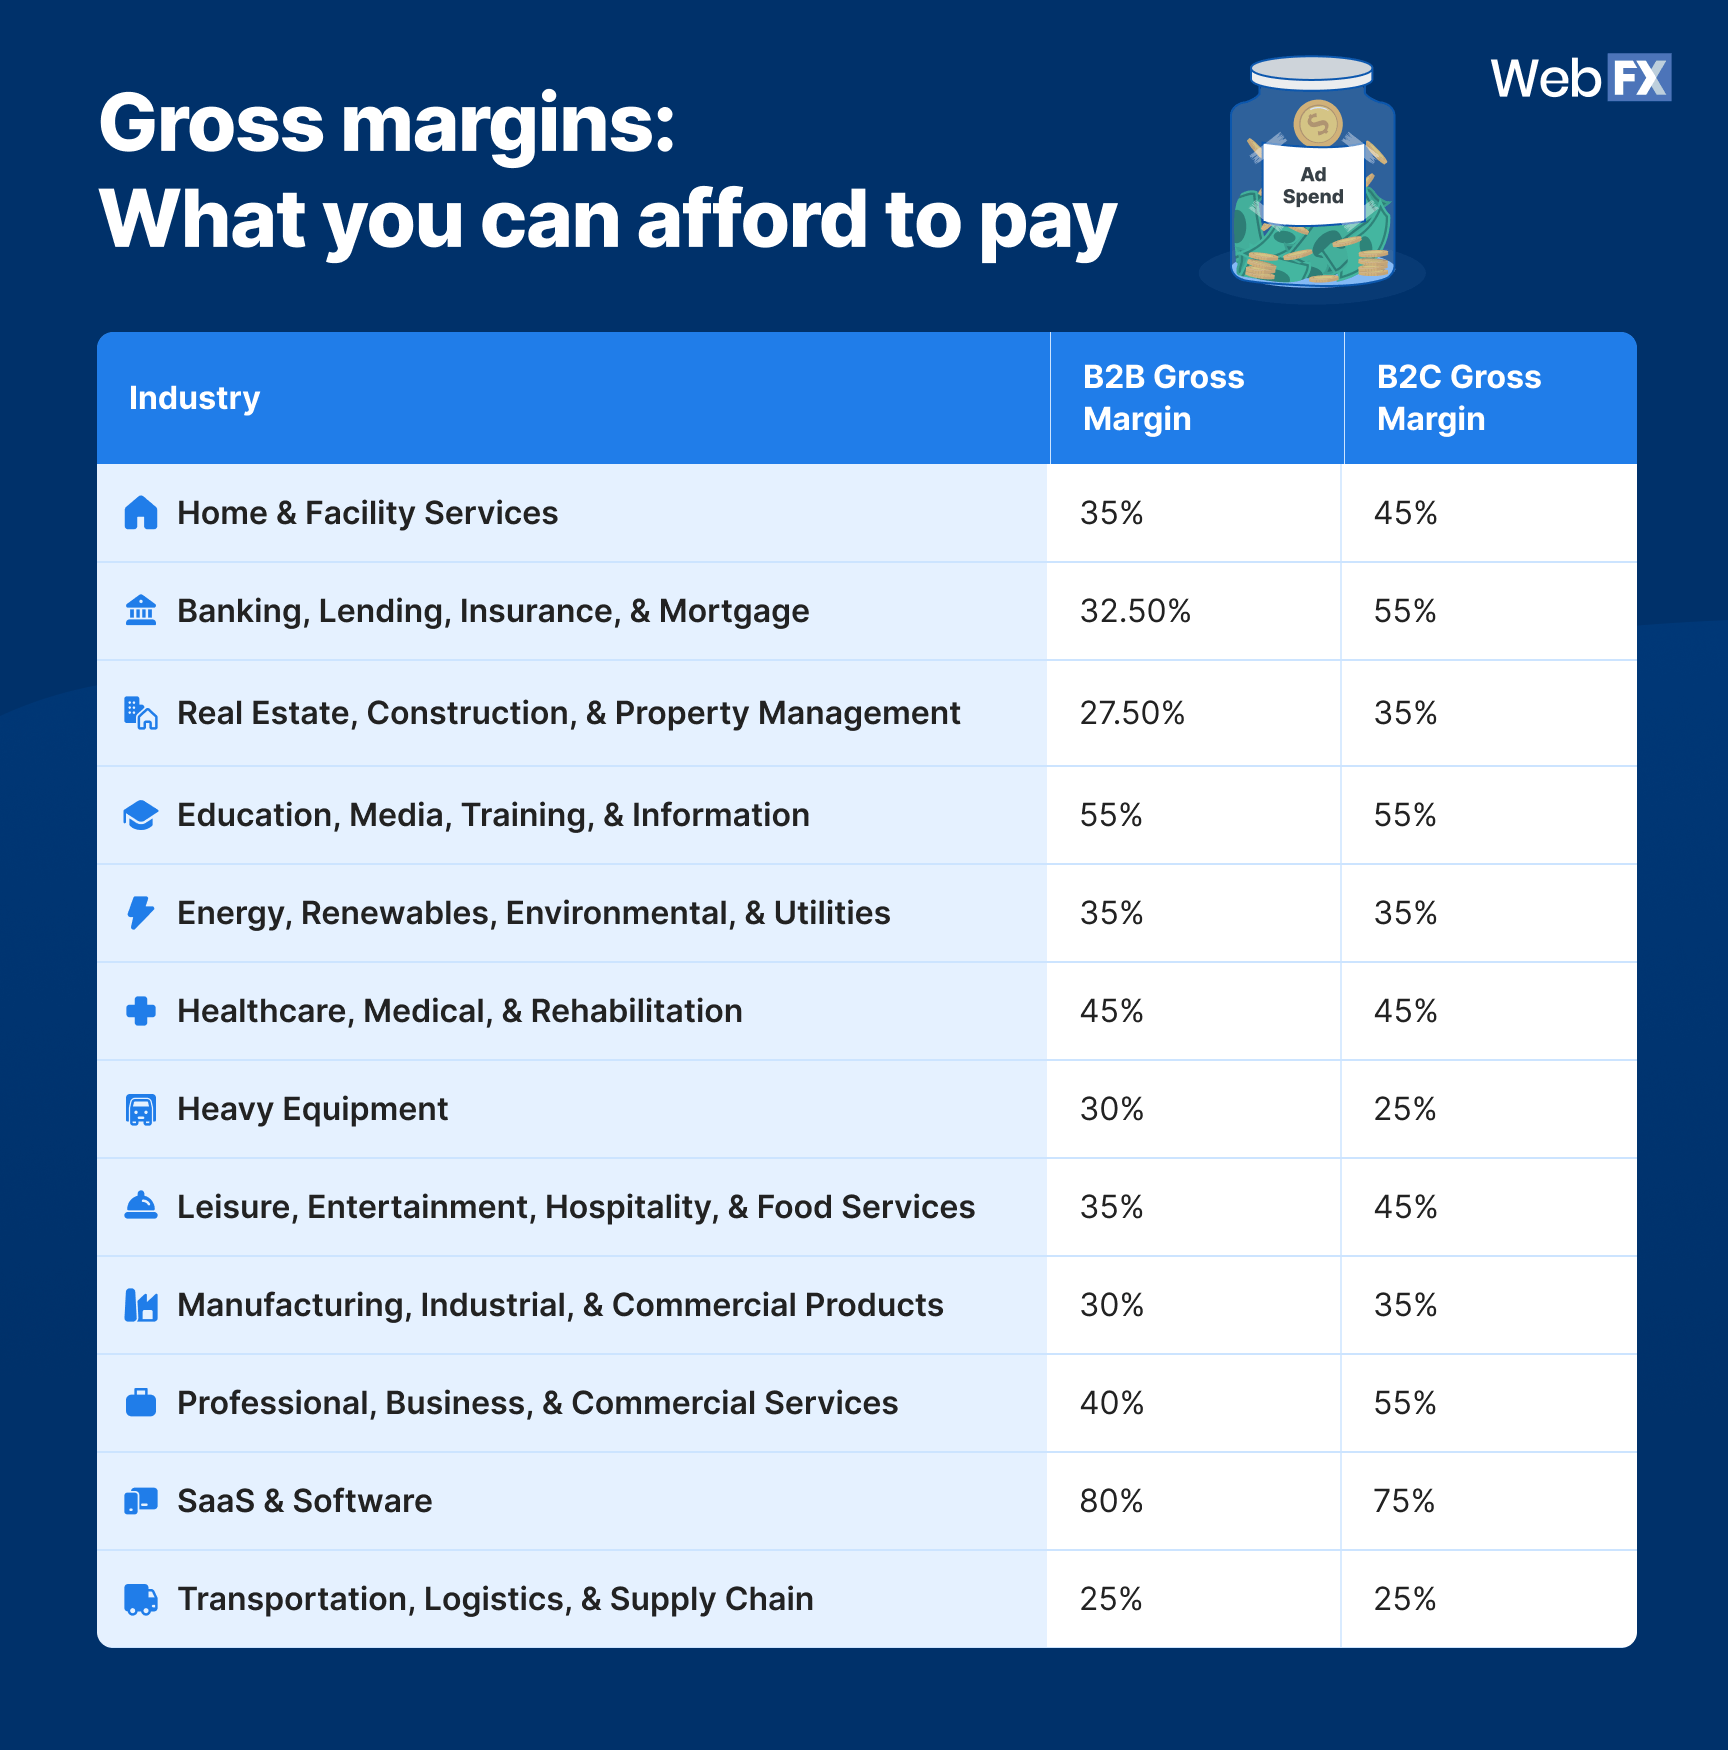
Gross margins: What you can afford to pay
Gross margin tells you how much room you have to spend on acquiring customers. Higher margins mean you can absorb higher CPLs and still turn a profit.
Source data
| Industry | B2B Gross Margin | B2C Gross Margin |
| Home & Facility Services | 35% | 45% |
| Banking, Lending, Insurance, & Mortgage | 32.50% | 55% |
| Real Estate, Construction, & Property Management | 27.50% | 35% |
| Education, Media, Training, & Information | 55% | 55% |
| Energy, Renewables, Environmental, & Utilities | 35% | 35% |
| Healthcare, Medical, & Rehabilitation | 45% | 45% |
| Heavy Equipment | 30% | 25% |
| Leisure, Entertainment, Hospitality, & Food Services | 35% | 45% |
| Manufacturing, Industrial, & Commercial Products | 30% | 35% |
| Professional, Business, & Commercial Services | 40% | 55% |
| SaaS & Software | 80% | 75% |
| Transportation, Logistics, & Supply Chain | 25% | 25% |
SaaS leads with 80% B2B margins, which explains why the industry can sustain higher CPCs and still profit. Transportation and Logistics sit at the bottom (25%), meaning every dollar of ad spend needs to work harder.
Marketing spend: What others are investing
This metric shows what percentage of revenue companies in each industry typically allocate to marketing and advertising.
| Industry | B2B Marketing Spend (% of Revenue) | B2C Marketing Spend (% of Revenue) |
| Home & Facility Services | 7.40% | 14.10% |
| Banking, Lending, Insurance, & Mortgage | 7% | 7% |
| Real Estate, Construction, & Property Management | 5% | 5% |
| Energy, Renewables, Environmental, & Utilities | 3.83% | 3.83% |
| Healthcare, Medical, & Rehabilitation | 9% | 9% |
| Leisure, Entertainment, Hospitality, & Food Services | 4% | 4% |
| Manufacturing, Industrial, & Commercial Products | 6% | 6% |
| Professional, Business, & Commercial Services | 3.50% | 3.50% |
| SaaS & Software | 22% | 22% |
| Transportation, Logistics, & Supply Chain | 4.50% | 4.50% |
SaaS companies invest the most at 22% of revenue, reflecting the competitive nature of the space. If you’re in SaaS and spending less than 15%, you’re likely underinvesting compared to competitors.
Common PPC pain points
Based on practitioner discussions, these are the most common challenges PPC marketers face:

Common PPC pain points:
- High CPC despite low competition: Often traced back to poor Quality Score or weak landing page experience
- Difficulty hitting target CPL/CPA: Usually a symptom of misaligned keyword targeting or audience mismatch
- Google Ads feeling “expensive” without clear ROI: Happens when ad tracking isn’t properly connected to revenue
- Platform confusion (Google vs. Meta): Google excels at high-intent search; Meta works better for awareness and demand generation
These pain points are almost universal. If you’re experiencing them, you’re not alone.
What the data tells us
- Deal cycles vary dramatically. Professional Services closes in 30 days; Transportation takes up to 365 days. Adjust your PPC ROI expectations accordingly
- SaaS margins (80%) justify aggressive PPC spend. Transportation margins (25%) demand efficiency
- SaaS companies spend 22% of revenue on marketing. If you’re in that space and spending less, you may be underinvesting
- High CPL isn’t always a problem. Context like deal cycle, margins, and customer value determines whether your spend makes sense
How to act on it
- Don’t judge PPC ROI too early. Factor in your industry’s deal cycle before declaring a PPC campaign a failure
- Calculate your max allowable CPL based on gross margin and average deal size, not gut feeling
- If competitors are spending 10%+ of revenue on marketing and you’re at 3%, you’re likely losing ground
- Address common pain points proactively. Audit Quality Score, fix ad tracking, and align keyword strategy to audience intent
How to use PPC benchmarks to improve your ROI
You’ve got the numbers. Now what?
Data without action is just trivia. This section breaks down how to actually use these PPC industry benchmarks to make smarter decisions, justify your spend, and improve your campaigns.
1. Benchmark before you optimize
Before changing anything, know where you stand. Compare your current metrics against the paid search benchmarks in this guide:
- Is your CPL above or below your industry average?
- Is your CPC rising faster than the industry trend?
- Is your CTR hitting the 6.66% benchmark, or falling short?
- Is your ROAS above 3.5:1, or struggling to break even?
If you don’t know your baseline, you can’t measure improvement. Pull your numbers first, then diagnose.
2. Contextualize your CPL with margins and deal cycle
A high CPL isn’t automatically bad. A low CPL isn’t automatically good.
What matters is whether the math works for your business. Use the profitability benchmarks to gut-check:
- High margins (50%+)? You can afford a higher CPL and still profit.
- Low margins (under 30%)? Every dollar of ad spend needs to work harder.
- Long deal cycle (90+ days)? Don’t panic if leads take months to convert. That’s normal for your industry.
- Short deal cycle (under 30 days)? You should see ROI signals faster. If you’re not, something’s off.
The goal isn’t the lowest CPL. The goal is profitable customer acquisition. To see how these costs translate to social platforms, compare these figures against our latest Meta marketing benchmarks for Facebook and Instagram.
3. Audit Quality Score if CPC is rising faster than industry averages
If your CPC is climbing faster than the YoY trends in this guide, the problem might not be competition. It might be Quality Score.
Google rewards relevant, high-quality ads with lower CPCs. Low Quality Score does the opposite.
Check these three factors:
- Expected CTR: Is your ad copy compelling enough to earn clicks?
- Ad relevance: Does your ad match the intent behind the keyword?
- Landing page experience: Is your landing page fast, relevant, and easy to use?
Fixing Quality Score issues can reduce CPC without changing your budget.
4. Use competitor spend as a reality check, not a target
The top advertiser benchmarks in this guide show what industry leaders spend monthly. That’s useful context, but it’s not your goal.
You don’t need to match their budgets. You need to understand the competitive landscape. So, if the top players in your space spend $1M+ per month, and you’re working with $10K, you’re not going to outbid them on head terms. Instead:
- Target long-tail keywords with lower competition
- Focus on niche audiences they’re ignoring
- Win on landing page experience and conversion rate
Efficiency beats budget when you’re the underdog.
5. Track the metrics that matter to your business
Not all PPC benchmarks are equally important for every business. Focus on the ones that tie directly to revenue:
| Industry | Primary Metrics to Track |
| Home & Facility Services | CPL, conversion rate, deal cycle (60 days) |
| Insurance | CPL, CPC, ROAS (high-spend, competitive) |
| Healthcare | CPL, lead-to-customer conversion, CAGR (rising competition) |
| Manufacturing | CPL, deal cycle (130 days), gross margin |
| Professional Services | CPL, lead-to-customer conversion (4.60%), short deal cycle (30 days) |
| SaaS | CPL, ROAS, CAGR (11.34%), marketing spend (22% of revenue) |
Vanity metrics like impressions and clicks are fine for reporting. But PPC budget decisions should be tied to revenue outcomes.
6. Revisit benchmarks quarterly
PPC costs aren’t static. As this guide shows, CPCs are rising across every industry, with some sectors seeing 15 to 18% YoY increases.
What’s “good” today might be “average” in six months. Build a quarterly review into your process:
- Pull your core metrics (CPL, CPC, CTR, ROAS)
- Compare against industry benchmarks
- Identify gaps and opportunities
- Adjust targeting, bids, and creative accordingly
PPC benchmarking isn’t a one-time exercise. It’s an ongoing discipline.
FAQs about 2026 PPC benchmarks
What is a good CPL for Google Ads?
A “good” CPL depends on your industry and audience. Based on our data, average CPL ranges from $70 (Leisure B2C) to $819 (Manufacturing B2B). To know if your CPL is good, compare it against your industry benchmark and factor in your gross margin and deal size. A $500 CPL is great if your average deal is worth $50,000. It’s terrible if your average deal is $1,000.
What is the average CPC for PPC in 2026?
Average CPC varies widely by industry. Median CPCs range from $20–$25 (Logistics) to $900–$1,100 (Insurance). Most industries fall between $50 and $300. CPCs are also rising year-over-year, with Healthcare (+18%) and SaaS (+15–18%) seeing the steepest increases.
What is a good ROAS for Google Ads?
The median ROAS for Google Ads is approximately 3.5:1, meaning $3.50 returned for every $1 spent. A ROAS above 4:1 is strong. Between 2:1 and 4:1 is acceptable but has room to optimize. Below 2:1 means you’re likely losing money and should audit your campaigns.
How much should I spend on PPC?
It depends on your industry and goals. Based on our data, marketing spend as a percentage of revenue ranges from 3.50% (Professional Services) to 22% (SaaS). Use these benchmarks as a starting point, then adjust based on your growth targets and competitive landscape. If competitors are spending 10%+ and you’re at 3%, you may be underinvesting.
Why is my CPC so high?
High CPC usually comes down to one of three factors: competition, Quality Score, or keyword selection. If your CPC is rising faster than industry averages, audit your Quality Score first. Low Quality Score inflates CPC regardless of competition. Also, check if you’re bidding on expensive head terms when long-tail keywords might deliver better ROI.
What PPC metrics should I track?
Focus on metrics that tie directly to revenue. For most businesses, the core four are: Cost per lead (CPL), cost per click (CPC), click-through rate (CTR), and return on ad spend (ROAS). Beyond those, track deal cycle and lead-to-customer conversion rate to understand the full path from click to revenue.
PPC Pricing Calculator
You know where you stand. Now get ahead.
PPC benchmarks give you the clarity to stop guessing and start knowing. Now you have the data to answer the questions that matter: Is my CPL competitive? Are my CPCs rising too fast? Is my ROAS where it should be?
But benchmarks are just the starting point. Turning those insights into results takes strategy, execution, and ongoing optimization. And if your PPC campaigns aren’t hitting these benchmarks (or you want to push past them), WebFX can help.
With 30 years of digital expertise, our team of more than 750 in-house experts has driven over $10 billion in revenue and over 24 million qualified leads for our clients through high-impact PPC campaigns across industries.
It’s one thing to know the benchmarks. It’s another to crush them. Contact us online or call 888-601-5359 to speak with a strategist today about our industry-leading PPC services!
Data sources & methodology
The PPC benchmarks in this guide are pulled from proprietary WebFX data and third-party intelligence, including:
- Proprietary WebFX data: CPL, deal cycle, gross margin, lead-to-customer conversion rate, industry CAGR, and marketing spend benchmarks are derived from aggregated, anonymized data across WebFX client campaigns spanning 12 parent industries. Data was last updated in October 2025.
- Ahrefs keyword intelligence: CPC ranges, median CPC, YoY CPC trends, top advertiser spend estimates, top advertisers by industry, and highest CPC keywords were pulled via Ahrefs API in December 2025. Data reflects estimated costs based on keyword-level analysis across 11 industry verticals. Median CPC values reflect competitive, high-intent keyword clusters rather than blended account-wide averages.
- Practitioner insights (Reddit): CTR and ROAS benchmarks, along with common PPC pain points, were sourced from discussions in r/PPC, r/googleads, and r/digital_marketing. These reflect real-world practitioner experiences and general cross-industry benchmarks rather than industry-specific data.
-
 Albert Dandy Velasquez blends SEO strategy with compelling storytelling to help businesses boost their visibility and revenue online. With a B.A. in English and certifications from HubSpot, Semrush, and Google Analytics, he has written and optimized hundreds of articles on organic SEO, content strategy, and user experience. He regularly contributes to the WebFX blog and SEO.com, creating content that helps readers turn marketing goals into measurable results. When he’s off the clock, he’s usually exploring new neighborhoods on two wheels, filming travel content, or chasing golden hour with a coffee in hand.
 -

WebFX is a full-service marketing agency with 1,100+ client reviews and a 4.9-star rating on Clutch! Find out how our expert team and revenue-accelerating tech can drive results for you! Learn more
Try our free Marketing Calculator
Craft a tailored online marketing strategy! Utilize our free Internet marketing calculator for a custom plan based on your location, reach, timeframe, and budget.
Plan Your Marketing Budget
Table of Contents
- What is PPC benchmarking, and why does it matter?
- 2026 PPC benchmarks (and how you stack up)
- PPC cost benchmarks
- PPC performance benchmarks
- PPC profitability and planning benchmarks
- How to use PPC benchmarks to improve your ROI
- 1. Benchmark before you optimize
- 2. Contextualize your CPL with margins and deal cycle
- 3. Audit Quality Score if CPC is rising faster than industry averages
- 4. Use competitor spend as a reality check, not a target
- 5. Track the metrics that matter to your business
- 6. Revisit benchmarks quarterly
- FAQs about 2026 PPC benchmarks
- You know where you stand. Now get ahead.
- Data sources & methodology
Share this article

Proven Marketing Strategies
Try our free Marketing Calculator
Craft a tailored online marketing strategy! Utilize our free Internet marketing calculator for a custom plan based on your location, reach, timeframe, and budget.
Plan Your Marketing Budget
What to read next