

One of the most powerful assets businesses today have in their arsenal is data. But processing all trillions of data at your disposal can be a hassle. It doesn’t have tp be though, not when you have dozens of free website analytics tools to help!
With the right analytics tool, you can gain valuable insight into your user experience (UX) and see what’s driving success with your marketing campaigns.
Discover the top free website analytics tools you can use to gain more insight about your marketing campaigns!
[Summary] Best free website analysis tools
| Tool | Top Features | Difficulty rating | Premium cost (if you want to upgrade) |
| Google Analytics |
|
🟢 | Contact for pricing |
| Mixpanel |
|
🟡 | Starting at $20/month |
| Hotjar |
|
🟢 | Starting at $32/month |
| Clarity |
|
🟢 | No premium offerings |
| Open Web Analytics |
|
🟡 | No premium offerings |
| Matomo |
|
🟡 | Starting at $23/month |
| Woopra |
|
🟡 | Starting at $999/month |
| Clicky |
|
🟢 | Starting at $9.99/month |
| Heap |
|
🟡 | Contact for pricing |
9 Best free website analytics tools: Detailed reviews
Over 60% of marketers use multiple analytics tools to gain insight into their marketing. Here are the nine free website analysis tools and applications to help you gather and analyze data about your web content:
1. Google Analytics
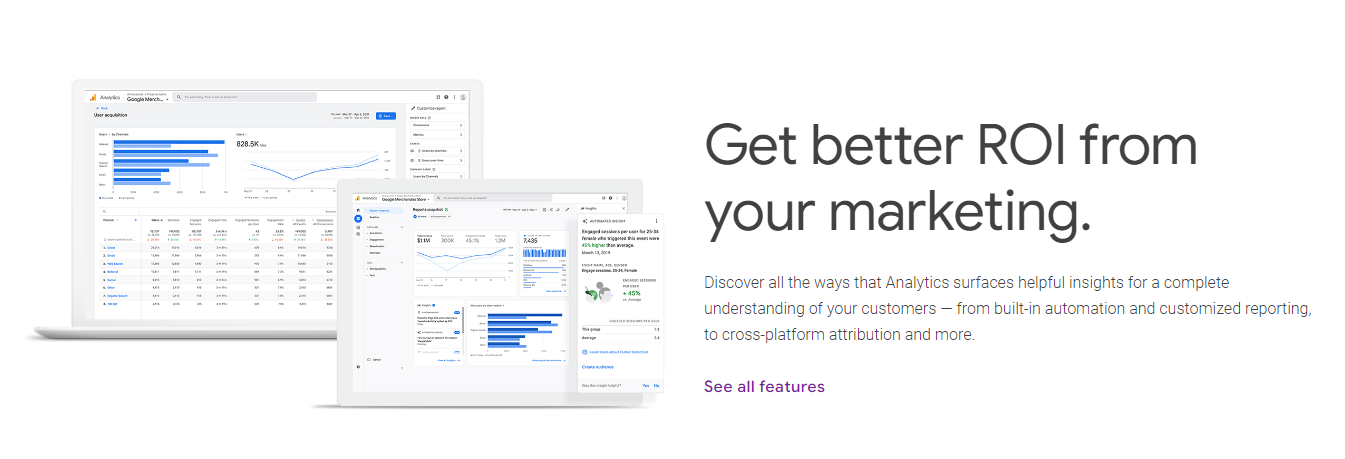
Google Analytics is a comprehensive, all-in-one tool that tracks website metrics, blog visits, social media post performance, and generates customized reports. Google Analytics is one of the best free analytics tools your business can rely on because of all the data it provides.
It’s also the most popular analytics tool — over 47% of all websites use Google Analytics.
Some of the key features Google Analytics offers includes:
- Built-in automation: Google Analytics offers tons of built-in automation to help you predict user behavior and use that insight to make better marketing decisions. It uses machine-learning models to predict actions users will take, like churning or making a purchase.
- Reporting: Want to see how customers interact with your website? Google Analytics offers reporting that enables you to take a deeper dive. From real-time reporting to engagement reports, you’ll have a clearer understanding of how users interact with your business.
- Explorations: Google Analytics allows you to explore your data through visualization to better understand your audience. From funnel exploration to path exploration, you can take the steps to better understand how your audience interacts with your business through these features.
- Data collection and management: Managing your data is a breeze with Google Analytics. Google Analytics enables you to import your own data, all while tying in data from your website.
2. Mixpanel
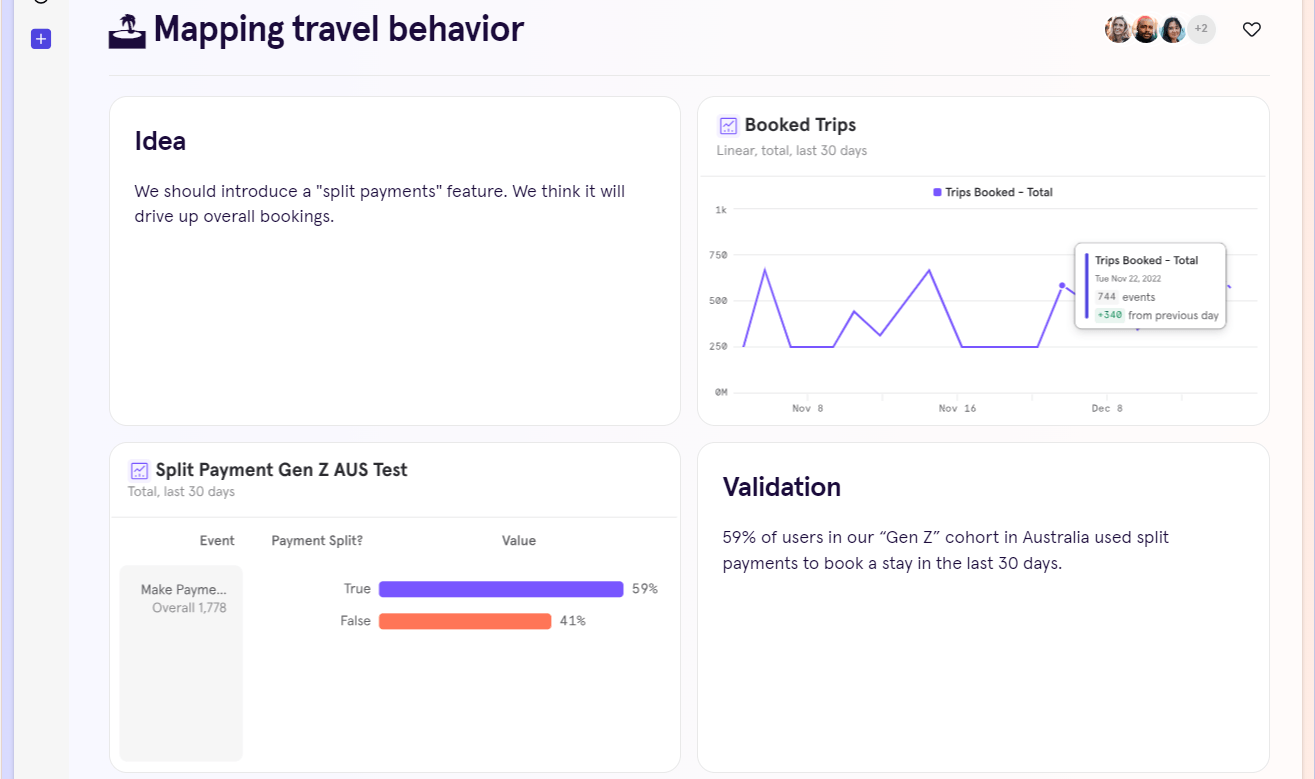
One of the best free analytics tools is Mixpanel. The free plan of this tool offers numerous great features that help you analyze your website’s data to better understand how your campaigns perform.
With Mixpanel, you can create customizable reports that provide insight on your key performance indicators (KPIs) that matter most. You can also get core reports on user journeys to better understand your audience.
Here are a few of the top features of this free website analysis tool:
- Data visualization: Mixpanel creates helpful and intuitive visualizations of your website’s data, making it easy to understand what you are looking at and track changes. Their dashboard features provide a concise look at valuable data.
- User profiles: Gain insight into your users’ behavior and other helpful information that will let you tailor your experience to them. You can even learn how to make your user experience better suited to their needs by making it easier to find popular pages.
- Compare users: Comparing different user profiles will help you understand more about the people who visit your website. The more you know about your users, the more you can improve your layout and content to appeal to them.
- Monitoring: Monitor conversion rates and other important KPIs closely with Mixpanel.
Keep in mind that Mixpanel’s free plan comes with some limitations. You have limits to the monthly users you can track, your events, and the number of saved reports you can have per user.
3. Hotjar
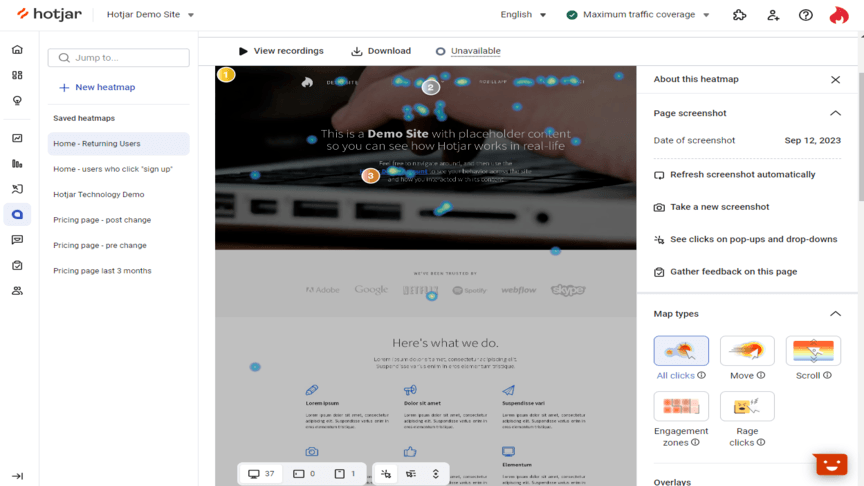
If you want to better understand how users interact with your website, Hotjar is one of the best free website analytics tools to give you insight. They offer automatic and continuous data capture that enables you to keep pulling in data to analyze your website performance.
From visual representation of user behavior, insightful feedback, and even one-to-one interviews, Hotjar provides incredible features with their free plan. You can access even more tools and features with their paid plans, but this free website analytics tool has a lot that makes it stand out from the rest:
- Various forms of visual data: Heatmaps and other forms of visual data representation will help you find actionable insights about your website’s visitors and most popular pages. You can see how people interact with your website, where they get stuck, and more.
- Privacy: Hotjar complies with the most significant internet data protection regulations to keep your data private and secure.
- User interviews: Gain access to more than 40 survey templates, Hotjar’s AI for surveys and up to 60 interviews a year on Hotjar’s free plan.
Hotjar’s free plan also has limitations. There’s a limit of the number of daily sessions per day, which also limits your session recordings. You also can only retain data for one month, so you can’t have a overview of data over the course of a few months.
4. Microsoft Clarity
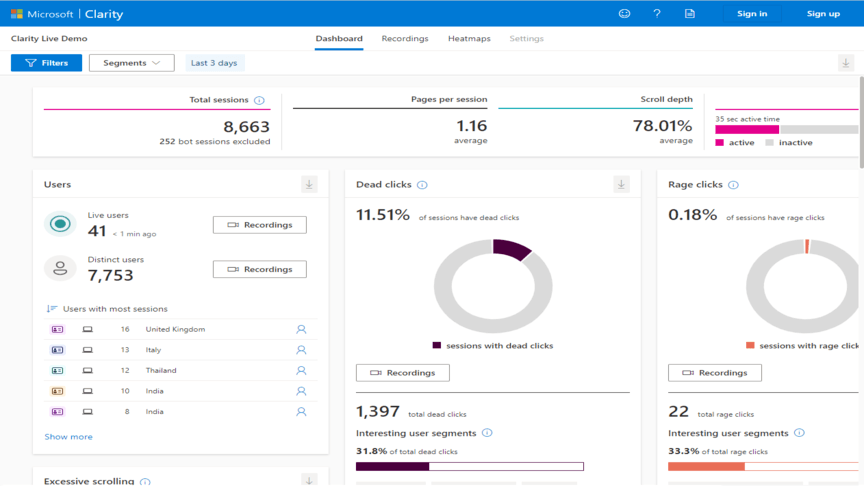
Clarity is a Microsoft tool that provides free website analysis and uses heatmap tools to track user interactions and behavior through functions like session recordings, heatmaps, and ML insights. Clarity can give you a thorough look into how people navigate your website and gain meaningful insights.
There are a lot of reasons to try out Microsoft Clarity when finding new ways to improve your website. The best features this free web analytics tool provides include the following:
- Session recordings: Session recordings involve filming a volunteer user as they accomplish set tasks given to them, like finding a specific page. These are used to determine how user-friendly your website is and lets you improve your UX.
- Real-time insights: Microsoft Clarity analyzes data and generates insights at almost real-time speeds. Machine learning and DeepAI are used to create invaluable insights and information while it analyzes user behavior.
- Unlimited offerings: With Clarity, you get a lot of unlimited features — unlimited traffic, heatmaps, websites, and team members. It’s built for businesses of all needs and scales.
- Advanced data analysis features: With Clarity, you have access to historical data to look at past performance to make smarter marketing decisions. You can also see where people rage click, dead click, and more. You get a more in-depth analysis of how people interact with your website to make improvements.
5. Open Web Analytics
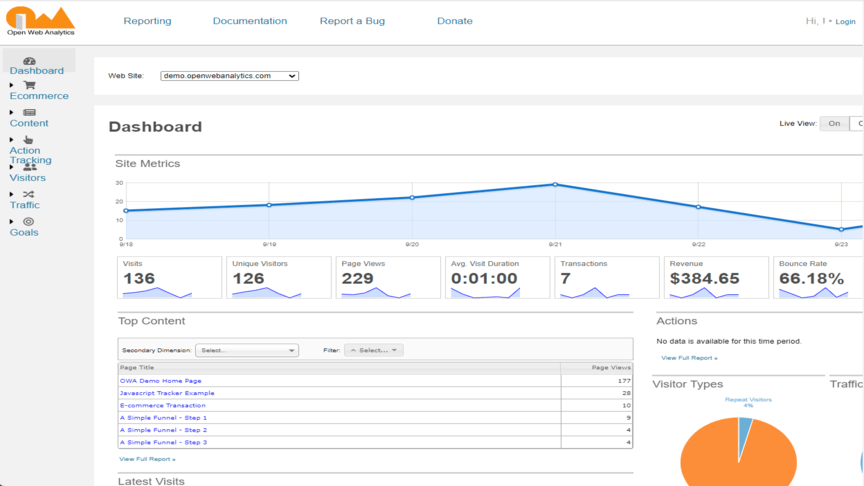
Open Web Analytics (OWA) is a free and open-source web analytics tool that gives you ways to track, monitor, and analyze the way people use your websites and applications.
There are a variety of benefits and advantages that make OWA a fantastic web analytics tool for any website developer or business to use:
- First-party control: You can run OWA as a part of your website under your domain.
- CRM systems: OWA provides website analytics with WordPress and MediaWiki support and integration.
- Reports and metrics: Monitor dozens of metrics and variables with OWA’s generated reports.
- Privacy: OWA is compliant with GDRP and many other Internet privacy frameworks, meaning your data and information will be protected and secure.
6. Matomo
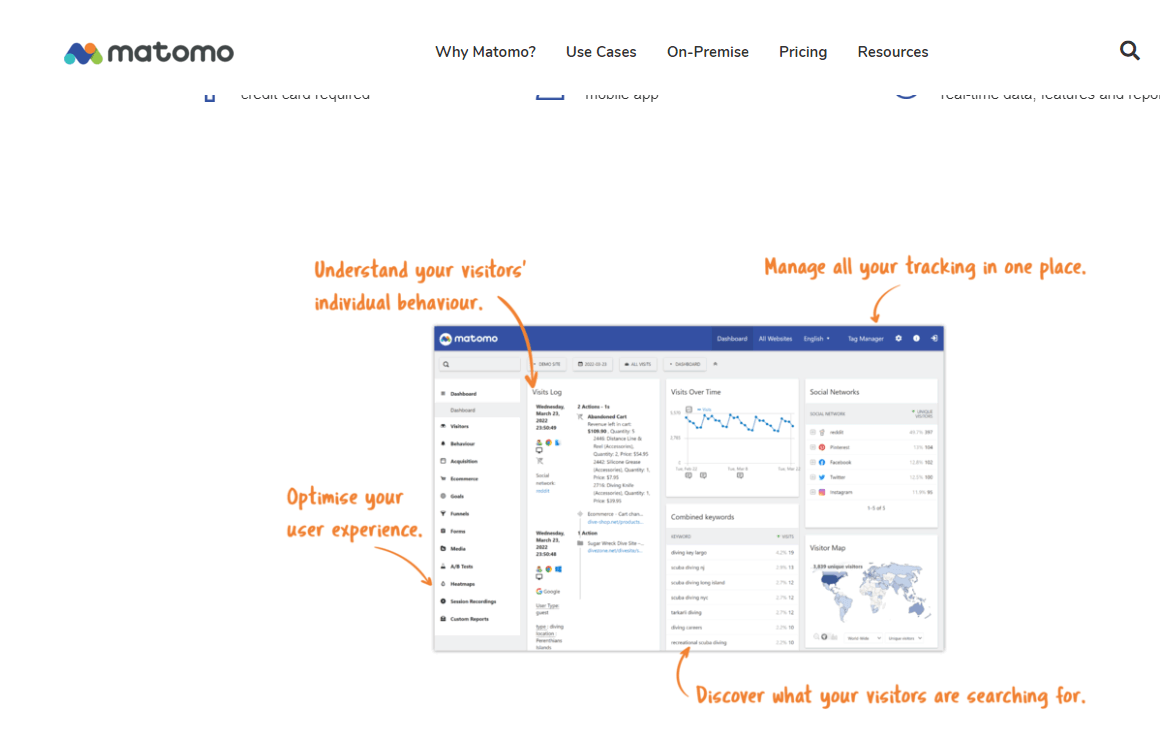
One of the best free website analytics tools is Matomo. Matamo is a high-powered website analytics platform that gives you ownership over your data. All you need to do is add a tracking code to your website and start tracking how visitors interact with your company.
Matomo provides a dashboard to help you keep all your tracking in one place, so you can easily see what’s happening and make the proper optimizations to improve.
Here are the best features of this website analysis tool:
- Unlimited features: Like some other free website analysis tools on this list, Matomo offers a lot of unlimited features. These unlimited features include unlimited websites, team members, segments, and goals.
- Full data analysis: Matomo doesn’t do data sampling. When Matomo analyzes your data, they analyze the whole thing to ensure you get the most accurate picture of your customer data.
- Raw data retention: Matomo will always retain your raw data, so you have the real numbers.
7. Woopra
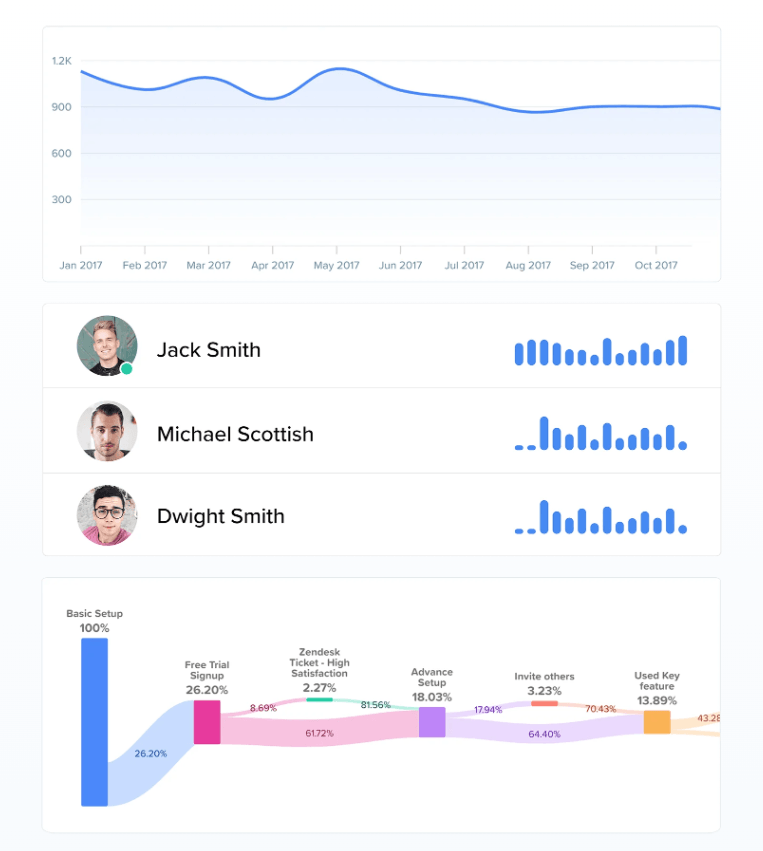
Looking for a free website analytics tool that helps you track the customer journey? If so, Woopra is the solution you need. Woopra is an end-to-end customer journey analytics platform that helps you better understand your audience as they engage on your website.
Woopra offers advanced analytics to help you acquire and retain more customers for your business, all by improving your website for a better customer experience.
Here’s what you get with Woopra as your free website analysis tool:
- Multiple report types: Woopra offers no shortage of reports. From journey to attribution to rentention reports, you get all the information you need about your audience.
- User journey tracking: With Woopra, you can track the user’s journey as they move from prospect to customer. You can discover what’s holding people up and keeping them from becoming a sale.
- Integrations: Woopra integrates with over 30 programs, including Salesforce, Google Drive, and Dropbox. You can automatically sync data between sources to ensure you have the right information, no matter where you keep it.
Woopra also has limits to consider when you’re only using the free plan. If you have a high traffic website, you’ll be limited with the number of actions you can track each month, which means missed data. Additionally, you can only retain data for up to 90 days, which makes long-term tracking difficult.
8. Clicky
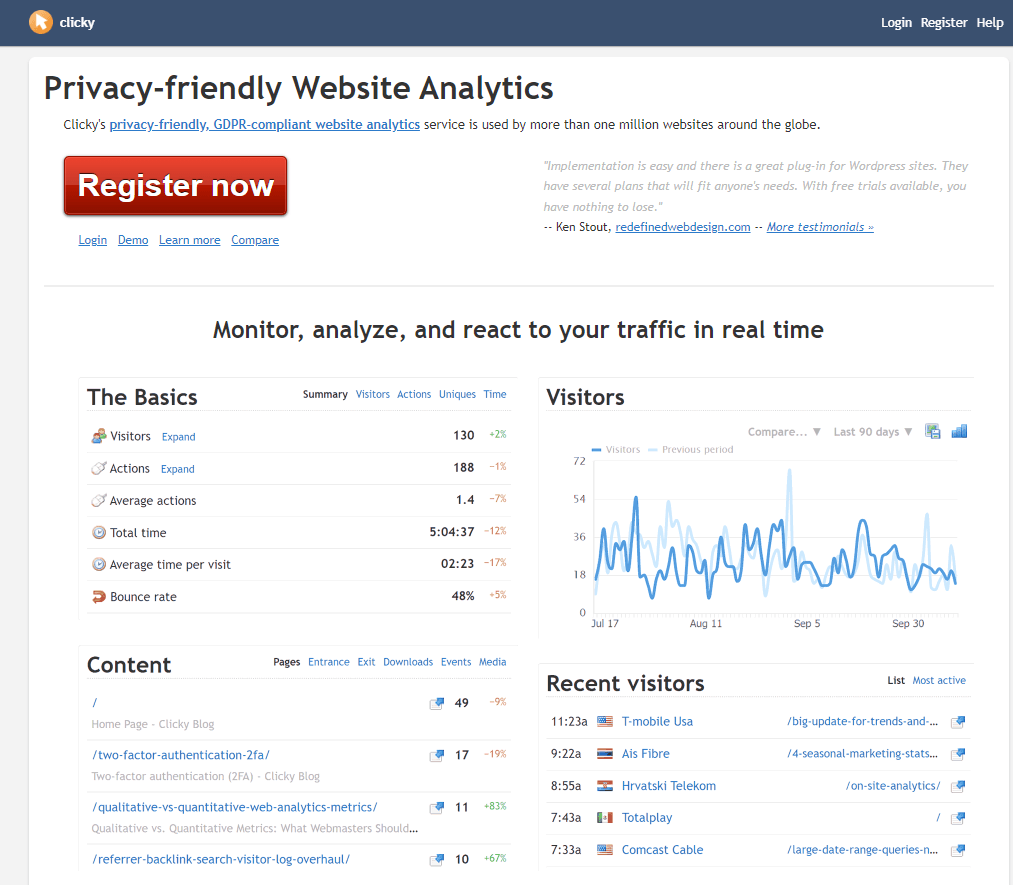
If you’re looking for free website analytics tools that offer data protection, put Clicky at the top of your list. This web analytics platform is GDPR compliant and privacy-friendly.
With Clicky, you gain access to an intuitive and friendly interface that makes it easy to track how people engage with your website.
Here’s why Clicky is one of the best free analytics tools:
- Real-time analytics: You can get real-time data on how people interact with your website. It’s a great way for you to gain insight into any roadblocks or problems your audience may face that keep them from having the best experience on your website.
- User interaction tracking: Whether someone downloads or clicks on a link, Clicky automatically tracks these user interactions. It helps you understand how users engage with your website.
- Page tracking: Want to know where people engage on your website? Clicky enables you to track content pages and see which ones drive engagement for your business.
9. Heap
To wrap up this list of the best free analytics tools, let’s look at Heap. Heap is a great tool for tracking website performance and understanding how people interact with your website.
With Heap, you can auto capture data to track every click, swipe, and form fill. It’s a great tool for helping you understand your audience better, so you can fine tune your website to meet their needs.
Here’s what Heap offers:
- Multiple analytics formats: From charts to funnels, Heap provides multiple analytics formats for you to analyze engagement on your website.
- Data enrichment: Heap enables you to enrich user profiles by pulling data from your apps.
- Personalization: Heap enables you to personalize your communications with customers. You can target behavior-driven cohorts to help you reach the right people with the right message.
How to choose the best free website analytics tool
With dozens of free website analytics tools available, it may be confusing to choose one that works for your business. While this list includes some strong contenders, all of them have some trade-offs. Below is a list of questions that can help you decide which free tool is good enough for your use.
What do you want to achieve with a free website analytics tool?
Before picking any of the tools, you must be clear on your analytics goals and objectives. Narrow down on analytics goals and ensure the tool you pick can uncover the metrics that matter most to your business.
Do you value data retention and reporting history?
If you intend to track trends over time, you need a tool that stores historical data for an extended period. Before choosing, check the tool’s maximum data retention period, whether you can archive older data, and if there are different retention rules for aggregate and raw data.
Do you need integrations?
Your free website analytics tool should be compatible with other systems, such as your customer relationship management (CRM) system, to ensure seamless data exportation.
Is the tool scalable?
If you expect your business to grow in the near future, you need a tool that offers paid upgrades. The upgrade should be capable of tracking increasing traffic and more events while also storing data for a longer period.
Do you have technical experience?
If you’re comfortable setting up analytics tagging, configuring dashboards, maybe self‐hosting a solution, then you can more easily leverage free tools. If you want a plug-and-play setup and full support, you might lean toward paid.
FAQs: Free website analytics tools and when to upgrade
Is a free website analytics tool enough for tracking my campaigns?
It can be, depending on which tool you use.
If you opt to use a tool like Google Analytics, for example, you’ll have everything you need to properly track data. The majority of businesses can use Analytics and get everything they need from it.
Other the other hand, if you opt for a tool like Mixpanel or Hotjar, you likely won’t get everything you need in the free version. You’ll run into data limitation issues, which can make it difficult to efficiently analyze your website and its performance.
When should I upgrade my free tool to the paid version?
If you’re interested in using the free version of a paid tool, you may wonder when the right time to upgrade is.
The answer depends upon your business and what your needs are. If you want continual, long-term tracking, for example, upgrading to the paid plans for many of these tools will ensure you get that.
Here are some common signs that you need to upgrade to the paid version:
- You’re hitting data limits
- You want to track data long-term (and not lose it)
- You need more advanced features
Basically, if you’re using the free version and finding that you want or need more from the tool, it’s likely time to upgrade to a paid plan.
Are free website analytics tools any good?
Yes! Actually, they’re pretty impressive. The top free website analytics tools we’ve featured in this post, for instance, have no barrier to entry and allow you to track, experiment, learn, and build your analytics processes.
They’re great for smaller traffic volumes and simpler measurement needs. However, you’ll miss out on advanced features and have to work around data limits, which is not the case when working with an advanced tool, like RevenueCloudFX.
Are there any free analytics tools that offer comprehensive insights?
Yes. There are free analytics tools that offer comprehensive insights, such as Google Analytics 4, Microsoft Clarity, and Matomo. They include event-based tracking, user behavior insights, acquisition analysis, data retention, and export options.
Is GA4 free or paid?
Google Analytics 4 is a free-to-use tool for all businesses. The free version of GA4 is ideal for small and medium-sized businesses looking to track events, custom dimensions, and user behavior funnels. However, it limits the amount of data you can save, the number of events before sampling, and custom metric quotas.
What are some simple, lightweight alternatives to Google Analytics 4?
While Google Analytics 4 is the most popular free website analytics tool, it can be complex or overwhelming for small businesses or marketers who simply want quick, privacy-friendly insights. Some lighter versions with a smoother learning curve include Microsoft Clarity and Matomo.
Enhance your website’s performance using free website analysis tools
These free website analysis tools can tell you a lot about your website, but what if you don’t know what to do with all the information?
That’s where the experts at WebFX can help.
WebFX has launched over 1,058 websites. With more than 750 marketing experts experienced in everything from website user experience analysis to website design, we have all you need and more to create a better website.
If you want to improve your bottom line, it’s time to partner with an agency that knows how to turn website analyses into revenue. Considering we’ve driven over $10 billion in revenue for our clients in the past few years, you can feel confident we’ll help you find little wins that have a big return.
Ready to ramp up your revenue? Contact us online or call us today at 888-601-5359 to speak with a strategist about our website user experience analysis services!
-
 Macy Storm is a Content Marketing Consultant at WebFX. She has 5+ years of experience creating content for all digital strategies and across 10+ industries. With a B.A. in Communications, she’s used her writing skills to write over 1,000+ pages for WebFX and SEO.com. Her work has been featured by Search Engine Journal, HubSpot, Entrepreneur, Clutch, and more. When she’s not clacking her keys, she’s playing video games, reading, or counting how many times people say her puppy Daisy is cute (it’s a lot of times). View full profile
 -

WebFX is a full-service digital marketing agency delivering revenue-driving strategies across online advertising, SEO and AI search optimization, and digital marketing. Backed by 1,100+ client reviews, a 4.9-star rating on Clutch, and proprietary revenue-tracking technology, our team helps businesses grow visibility and revenue across platforms, from Google to ChatGPT to LinkedIn. Discover how our expert team and revenue-accelerating tech can drive results for you. Learn more
Make estimating web design costs easy
Website design costs can be tricky to nail down. Get an instant estimate for a custom web design with our free website design cost calculator!
Try Our Free Web Design Cost Calculator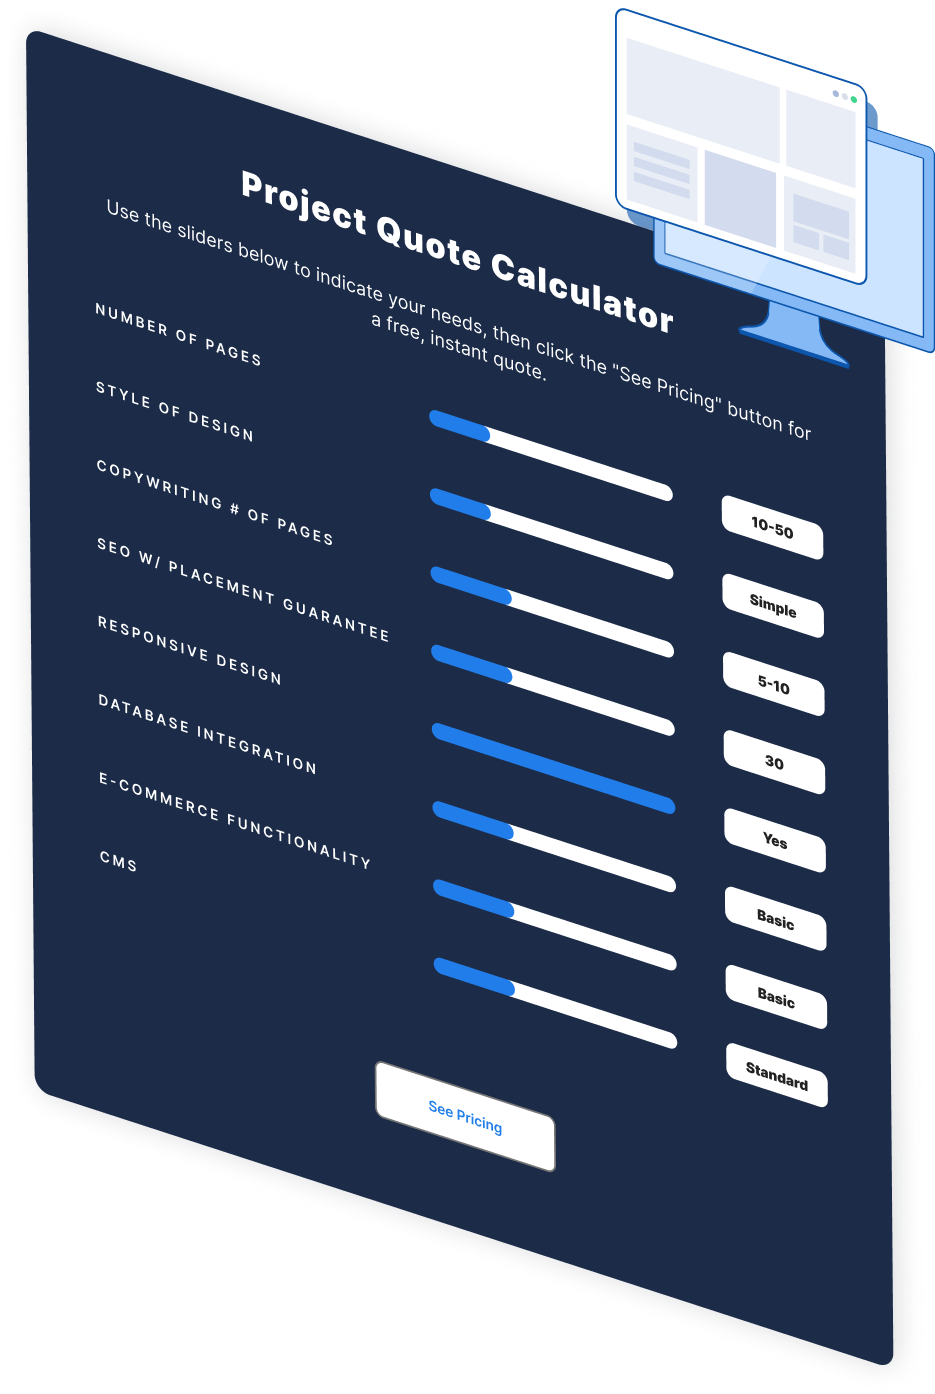
Share this article


Web Design Calculator
Use our free tool to get a free, instant quote in under 60 seconds.
View Web Design Calculator
Make estimating web design costs easy
Website design costs can be tricky to nail down. Get an instant estimate for a custom web design with our free website design cost calculator!
Try Our Free Web Design Cost Calculator