- Home
- Blog
- Web Design
- How to Create an Infographic in 5 Steps
How to Create an Infographic in 5 Steps
-
 Published: Jun 24, 2024
-
 7 min. read
-
 Celeste Yates
 Content Writer
- Celeste has worked in the online marketing space for twenty years. She has written for sectors including tourism, sustainability, education, lifestyle, food, and marketing. You can find her work featured by Green Building Media South Africa, Stodels Gardening, and The Post House Hotel. In magazines, you may have seen her in The Cape Times, Oprah South Africa, and The Property Magazine. While you can find her writing up on the latest SEO trends and exploring digital techniques during the day, her love of story-telling carries on in enriched games and books after hours.
If you’ve seen an infographic before, you know just how special this type of content can be. These tools are a great way to present complicated information, so your audience can quickly and easily understand it. The best infographics engage audiences and communicate a specific message.
Want to know how to do it? Learn how to create an infographic in this article!
If you’re ready to start on your infographics now, you can also go ahead and get in touch with WebFX to learn more about our infographic design services!
Discover More: 40 Useful and Creative Infographics
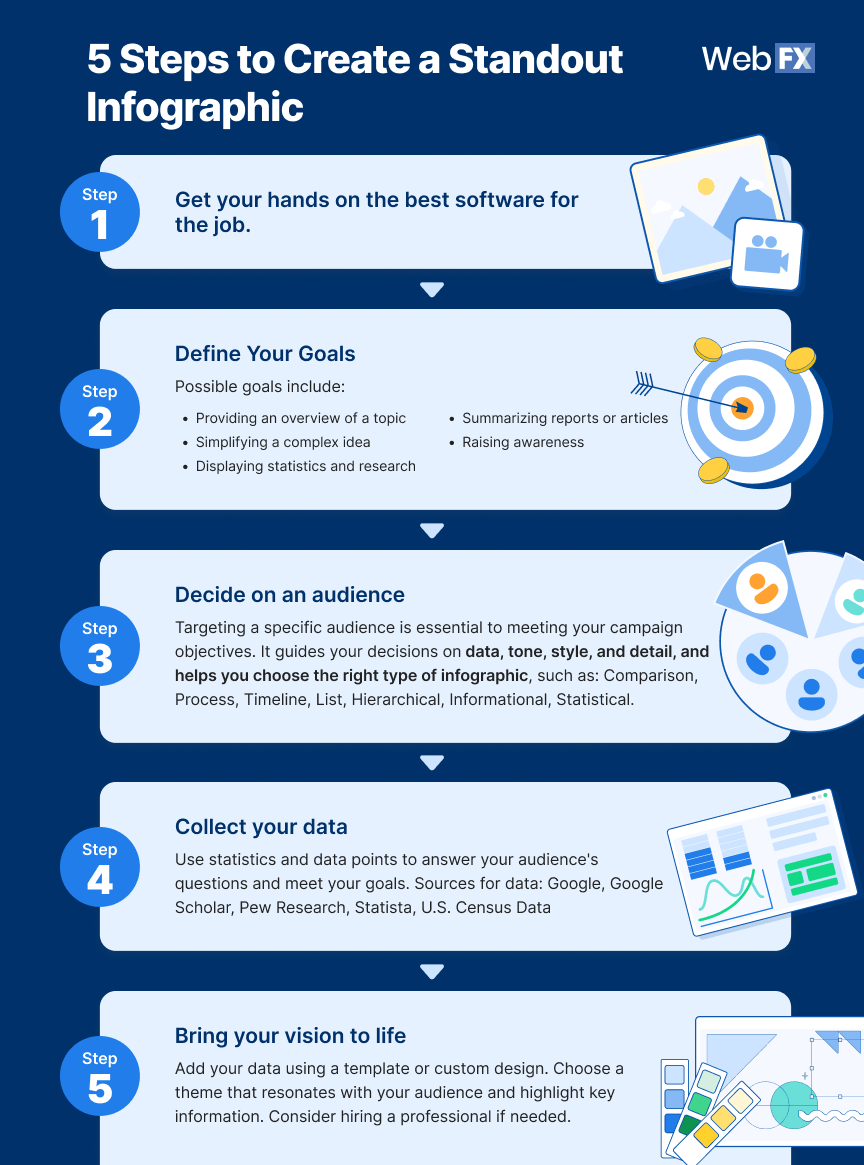
5 steps to create a standout infographic
Infographics are powerful marketing strategies that are worth investing your time, money, and effort in. Consider the following steps to start creating a successful infographic.

1. Choose your software

Before doing anything, you must decide how to create your infographic. If you plan on designing one in-house, you’ll have to get your hands on the best software for the job.
You can utilize many tools that offer templates with user-friendly capabilities. Some of these programs include:
- Canva: A free online software that comes with user-friendly interface tools and resources. If you want more control and resources, you can sign-up for one of their affordable packages.
- Piktochart: An online graphic design tool and infographic maker. This software is geared towards making infographic, but their ‘free’ option is more of a trial period, as it gives you a certain amount of credits.
- Adobe Illustrator: Adobe is well known in the design industry and is the bread and butter software for a lot of agencies. There is a free trial option available as it can be pricey for those just wanting to do a once-off image. However, if you plan on doing a lot of design work, then it is worth it.
- Infogram: Software to specifically create visual content such as infographics, charts, and graphs. The free version is comprehensive enough if you want to do just one or two infographics to try out. The upgrades are fairly affordable if you wish to do more.
2. Define your goals
What do you want to accomplish with your content? Answering this question will allow you to focus your efforts and create a powerful visual that successfully tells a story. You want to ensure you answer essential questions for your audience and offer a solution to their problems.
Some goals for your infographic could include:
- Providing an overview of a topic
- Simplifying and explaining a complex idea
- Displaying statistics and research
- Summarizing reports or articles
- Raising awareness
3. Decide on an audience
Once you know what you want to say and achieve with your infographic, you can define its audience. This step is essential to ensuring you complete all the campaign objectives. If you try to appeal to everyone, you’ll likely miss the mark and appeal to no one.
Determining the target audience will help you make crucial decisions during creation. It can help you select the data, your tone, your graphic style, how much detail is necessary, and much more.
Your audience will also help you decide which type of infographic to use. You can create the following infographics:
- Comparison
- Process
- Timeline
- List
- Hierarchical
- Informational
- Statistical

4. Collect your data
Now, it’s time to find information to build your infographic. The statistics and data points you use will help you answer your audience’s questions and accomplish your goals. Some helpful places to get you started include:
- Google Scholar
- Pew Research
- Statista
- U.S. Census Data for Social, Economic, and Health Research
5. Bring your vision to life
Time for the fun part! You can begin plugging your data into your infographic using a template or designing your own from scratch. Choose a theme that will connect with your audience and stand out to leave a lasting impact. You should also organize your information into a hierarchy, making the most important data stand out.
If you aren’t sure what will look pleasing to your audience and need help arranging the information, you can always contact a reliable design company to help.
Why are infographics effective?
Have you ever heard the saying, “A picture is worth a thousand words?” Visual information often sticks in our brains, making it more valuable than a block of text.
Infographics break information down to its bare essentials, displaying the knowledge vital for your audience to understand. Content with added visuals, such as an infographic, draws 94% more views than content with only text. Visuals tell a story by displaying essential information and weaving it together with exciting imagery.
Plus, there’s no guessing or trying to sift through filler words to conclude a final result. All the answers your readers need are right in front of them, enabling them to get what they want quickly.
What are the benefits of infographics?
Wondering what an infographic will do for your marketing campaign? Check out some of the following benefits of infographics.
They can go viral
If users find your infographic valuable, they can easily comment on it, give it a like, or share the graphic directly with other users on social media. With one click, your infographic has the potential to reach countless eyes, offering valuable exposure to your business’s products and services.
They increase interaction
It’s no secret that people are more drawn to visuals than big blocks of text. Humans process images and other visuals much quicker than anything else and can retain that information longer.
They display your expertise
Infographics are full of excellent information. Researching data and creating an interesting graphic to present to your audience will position you as a knowledgeable organization in the industry. Similarly, you’ll build trust with potential customers, giving them confidence that you know the facts and have the skills to help them with whatever they need.
They generate results
Infographics are fantastic resources for attracting new leads and converting them into customers. Our world revolves around shares and likes, so why not take advantage of that?
With share-worthy content, 15 people could quickly turn into 100 with one click. This factor may also lead Google to index your webpage higher, leading to even more eyeballs on your brand and people visiting your site.
They make communication simple
If you have ever seen text-heavy content, chances are you clicked out of there without giving it much thought. Users may feel overwhelmed and intimidated when they face a sizable chunk of complex and technical text, which will force them to scroll away.
Infographics thrive on presenting information in an exciting and digestible way. You’ll communicate important information without overwhelming or intimidating your audience. Plus, with a fun and exciting graphic, they’re more likely to interact and soak up everything you’re presenting.
WebFX has your back for all of your infographic needs
Infographics are terrific components of any content marketing plan. These graphics will help you grab attention and present easily comprehensible knowledge to your readers.
Learning how to create an infographic can be challenging if you don’t have design experience. That’s where we come in! WebFX is here to help you achieve your goals with visual content. As a full-service digital marketing company, we have vast experience creating infographics that drive results.
Ready to get started? Contact our specialists online or speak with us at 888-601-5359 for more information!
-
 Celeste has worked in the online marketing space for twenty years. She has written for sectors including tourism, sustainability, education, lifestyle, food, and marketing. You can find her work featured by Green Building Media South Africa, Stodels Gardening, and The Post House Hotel. In magazines, you may have seen her in The Cape Times, Oprah South Africa, and The Property Magazine. While you can find her writing up on the latest SEO trends and exploring digital techniques during the day, her love of story-telling carries on in enriched games and books after hours.
 -

WebFX is a full-service marketing agency with 1,100+ client reviews and a 4.9-star rating on Clutch! Find out how our expert team and revenue-accelerating tech can drive results for you! Learn more
Make estimating web design costs easy
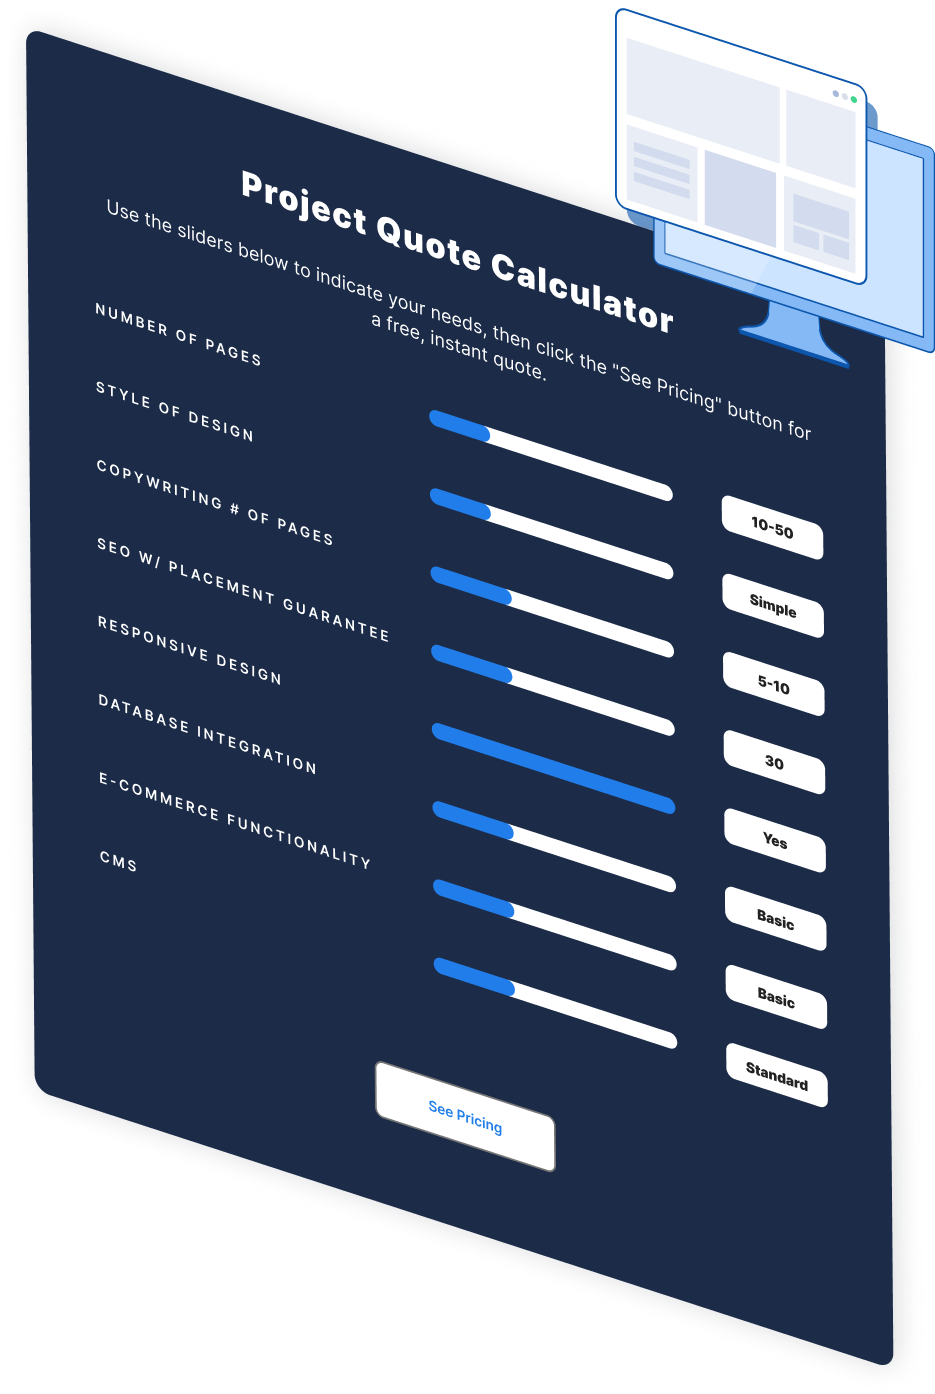
Website design costs can be tricky to nail down. Get an instant estimate for a custom web design with our free website design cost calculator!
Try Our Free Web Design Cost Calculator


Web Design Calculator
Use our free tool to get a free, instant quote in under 60 seconds.
View Web Design Calculator
Proven Marketing Strategies
Make estimating web design costs easy
Website design costs can be tricky to nail down. Get an instant estimate for a custom web design with our free website design cost calculator!
Try Our Free Web Design Cost Calculator
What to read next


