- Home
- Blog
- Content Marketing
- Visual Content Statistics for 2025: Continue to Engage and Amaze
Visual Content Statistics for 2025: Continue to Engage and Amaze
-
 Published: Nov 25, 2024
-
 16 min. read
-
 Celeste Yates
 Content Writer
- Celeste has worked in the online marketing space for twenty years. She has written for sectors including tourism, sustainability, education, lifestyle, food, and marketing. You can find her work featured by Green Building Media South Africa, Stodels Gardening, and The Post House Hotel. In magazines, you may have seen her in The Cape Times, Oprah South Africa, and The Property Magazine. While you can find her writing up on the latest SEO trends and exploring digital techniques during the day, her love of story-telling carries on in enriched games and books after hours.
I want to share with you some crazy insights in visual content statistics. We know the online world has changed dramatically since it started and that there are huge changes that no one at the beginning could have predicted, like how viewers are turning more and more to their phones for content than their desktops.
Do you think Alexander Bell, the inventor of the telephone, knew that one day we would do our shopping on it? No. That would sound nuts to him. And yet, here we are with 54% of all website traffic generated from mobile phones.
Content started out just as text and images and has evolved into so many other different formats, all that fall into the category of visual content. Content that inspires and captures our imagination and attention. Visual content gets 94% more views than text-only. 94%! Imagine how that could change your engagement strategy with your customers.
But that’s just one statistic that can change how you think about your content. This article will examine a whole lot more to give you a grasp on why visual content needs to be given a bigger priority when strategizing online.
But I don’t just want to blow your mind about the power of visual content; I want to show you how you can use this to blow the mind of your audience. After all, combining text and visuals can boost information retention by up to 65%!
What makes content visual?
Visual content is any form of content that utilizes visual elements to communicate information. The content is designed to capture attention and enhance understanding through visual means. By using visual content, you can capture large amounts of information more quickly and effectively than a solid wall of text.
The different types of visual content
Before diving into the visual content statistics, let’s look at some of the different formats you can use in your visual content strategy:
- Images: Photos, illustrations, and high-quality images can evoke emotions and messages in your audience. They often complement a blog post or article to give visual relief from large amounts of text.
- Video: Different types of videos are used for visual content purposes, such as vlogs or tutorials. However, the underlying purpose of presenting a concept or a story in an engaging way remains the same. Video content alone can increase organic traffic by a staggering 157%.
- Infographic: A static infographic can visually represent large amounts of data or statistics and convey complex information.
- Presentations: You can allow users to browse presentations in their own time with slides or participate in a webinar. Presentations combine the use of images, video, and audio, usually in an educational setting.
- GIFs and memes: GIFs and memes are used to inject humor into content that can be a bit dry or needs a boost. If done correctly, they can go viral, bringing in a significant traffic increase.
- Charts and graphs: Pie graphs and charts have been used to show analytical information before the Internet even existed. It is a popular way to show large amounts of data in an easily digestible form.
- Animations: Videos that use animation can share a story, illustrate an idea, or demonstrate a product. Motion graphics are a similar but equally effective method.
- Augmented Reality (AR) and Virtual Reality (VR): New kids are on the block, and this form of media is still evolving and growing as technology grows. AR is the integration of digital information with the environment, which can happen in real time. VR simulates a three-dimensional (3D) environment, with the aid of near-eye displays.
Visual content engagement stats for 2025
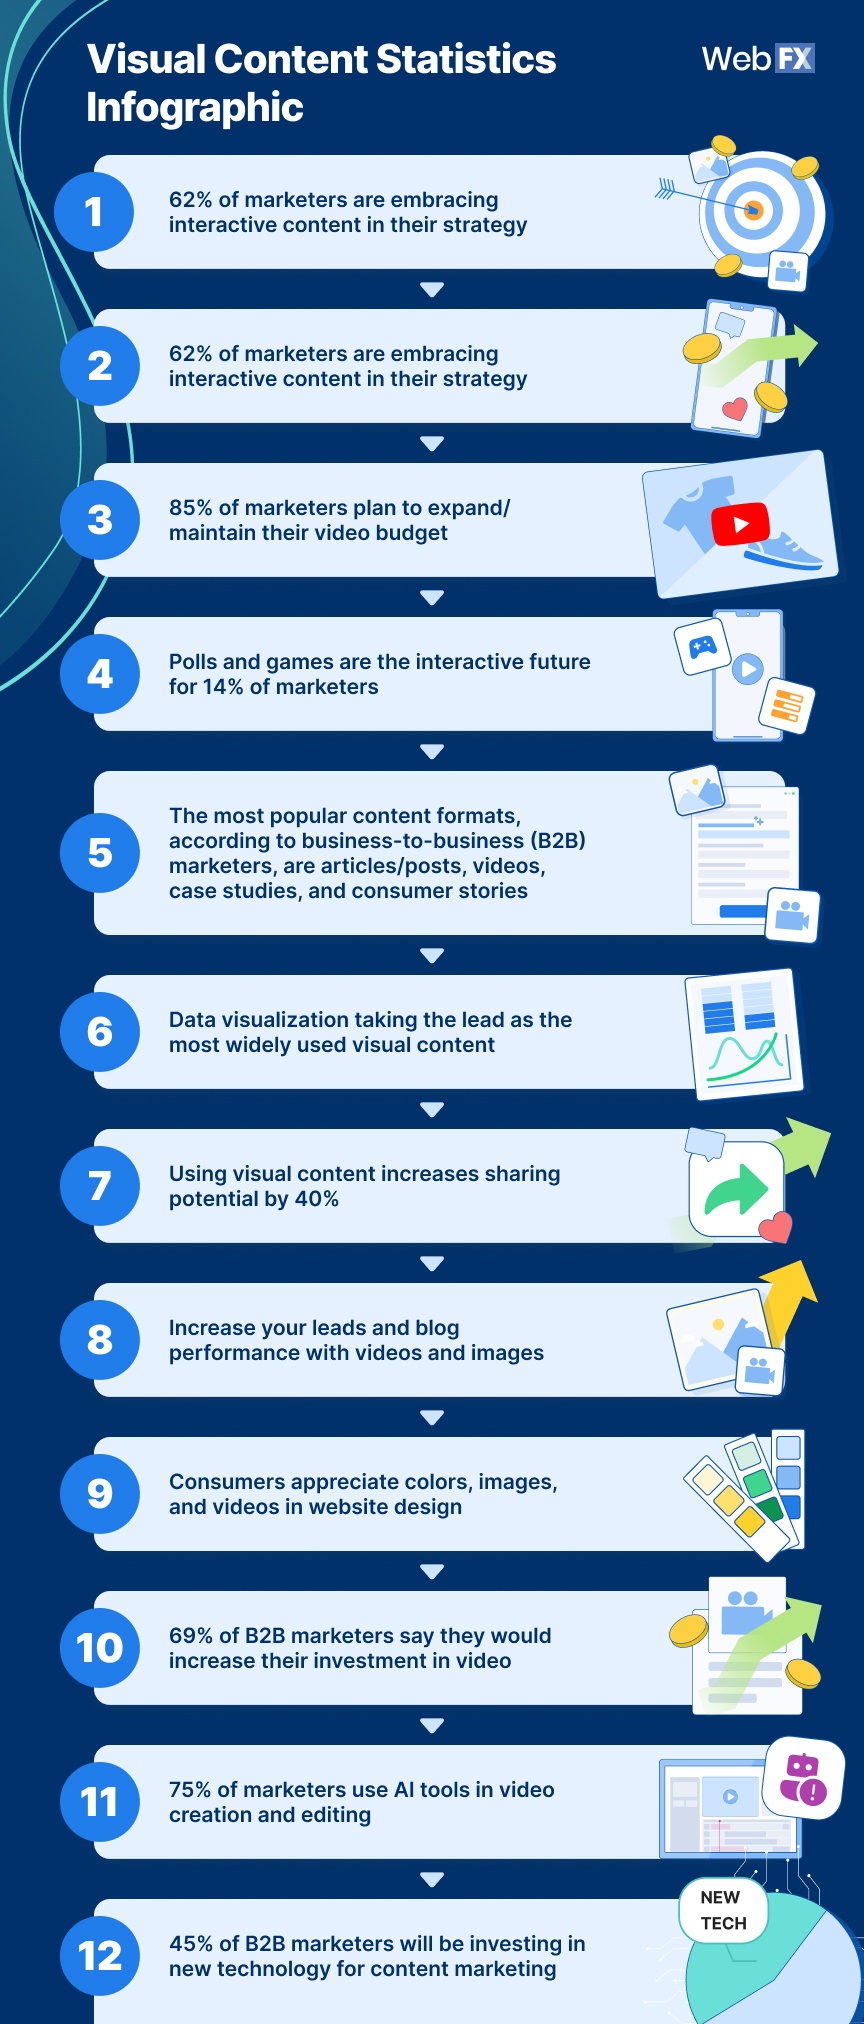
1. 62% of marketers are embracing interactive content in their strategy
Interactive content can make your content stand out as it transforms passive consumption into active engagement. Marketers can further personalize experiences by inviting users to participate with their brand, creating a more immersive experience.
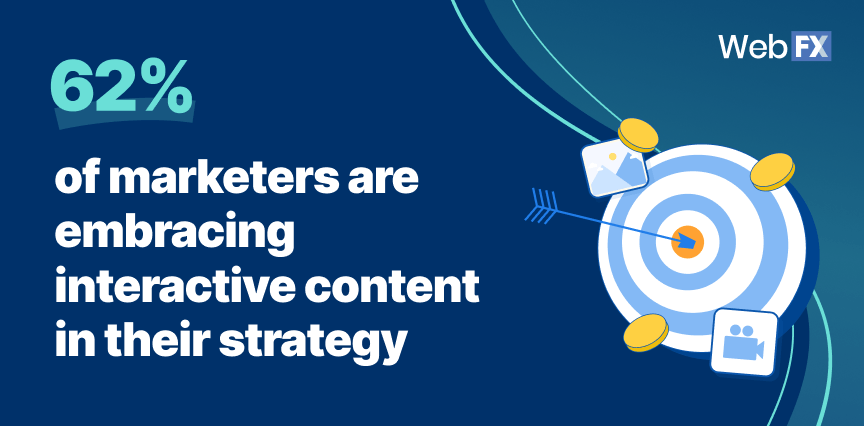
Interactive content is seeing an increase in 2025, with 62% of marketers wanting to incorporate it more in their strategy.
The added benefit of interactive content isn’t only the direct relation to the customer, but the possibility of expanding audiences. The fun and engaging element creates a higher social sharing, which amplifies reach and visibility.
Types of interactive content you can use include:
- Quizzes and surveys
- Interactive infographics
- Polls
- Interactive videos
- Calculators and tools
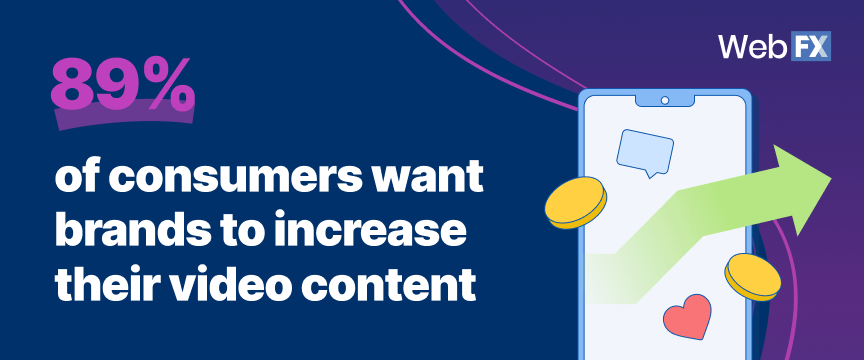
2. 89% of consumers want brands to increase their video content
Information presented in video format creates a rich, multisensory experience that is more impactful than text and images alone. It is not surprising that 89% of consumers expect brands to increase their video content in 2025.
Brands that have video already notice that customers are 10X more likely to interact with their video than text-only content. Strategies that can meet those objectives include:
- Investing in quality production: If your brand is high-quality, it is natural that consumers will associate quality with your business. If creating an in-house team isn’t an option, consider outsourcing to a company with custom video services.
- Creating diverse content: Your video strategy should consider the different stages of the buyer’s journey, just like your content strategy does. You can create educational information for soft sales, case studies, and testimonial videos for those at the tip of buying.
- Using all your channels: Videos don’t only have to be placed on YouTube or uploaded to your website. There are a number of different ways to showcase your videos, including on social media platforms.
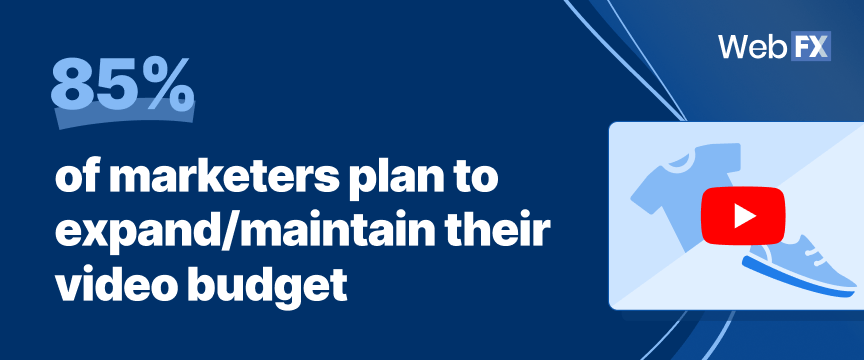
3. 85% of marketers plan to expand/maintain their video budget
Video content has consistently demonstrated its ability to captivate audiences by enhancing a brand’s storytelling. 85% of marketers aim to capitalize on the efficiency of video use for their visual content marketing strategy by increasing or maintaining their budgets for 2025.
It isn’t only consumers who enjoy video but search engines as well. You might think a keyword-induced article would be a search engine’s favorite form of content, but videos can increase SEO, as they increase the time visitors spend on a page. This reduces the bounce rate and can lead to a higher ranking in the search engine results pages (SERPS).
4. Polls and games are the interactive future for 14% of marketers
Fun and engaging content like polls and games is often shared more frequently on social media platforms. This visibility can boost your brand’s awareness and amplify its reach, attracting new audiences. The interactivity element also increases the longer time spent on the site, which is a very positive increase!

14% of marketers are focused on creating interactive content in 2025. Some of that interactive content includes:
- Polls: You can use them to engage your audience and gain insight into their needs or just for fun entertainment.
- Quizzes: Quizzes can be created to be fun and light-hearted at the outset, but you can sneak in a few questions that are insightful to you in terms of your audience.
- Games: Gamification elements are often added for loyalty programs or to encourage long-term use. For example, apps often use them to get their audience to return.
- Contents and challengers: Everyone loves winning a prize. You can also reward the challenge with recognition. For example, a cooking brand might challenge its audience to create a recipe. The winner gets featured on their site, book, or maybe be interviewed in their podcast.
5. The most popular content formats, according to business-to-business (B2B) marketers, are articles/posts, videos, case studies, and consumer stories.
Here are the statistics of the most popular content types in order of most liked:
- Articles and posts were liked 94%
- Videos were liked 84%
- Case studies and consumer stories were liked 78%
Remember that these are popular formats for B2B marketers, so it may not look the same for B2C marketers.
Test other types of formats with your audience and see if infographics, polls, quizzes or gamification elements can perhaps be used to set you apart from the crowd.
6. Data visualization taking the lead as the most widely used visual content
A recent survey showed that out of 105 respondents, over 50% declared that charts and data visualization were the most used visual content in . Statistics have revealed that a chart can enhance understanding by 80% within B2B content.
Large amounts of data often need to be conveyed to audiences, especially in industries such as finance and healthcare, where there are percentages involved. The easiest way to do this is to create charts and diagrams.
Types of charts and graphs that can be used include:
- Bar charts
- Line graphs
- Pie charts
- Scatter plots
- Histogram charts
- Area charts
- Bubble charts
7. Using visual content increases sharing potential by 40%
Visual content formats are 40X more likely to get shared on social media. Users can’t help it! Here is why:
- Instant engagement: Motion and visuals capture attention instantly. When a user is speeding through their feed, a striking image can cause them to halt and engage their curiosity.
- Emotional connection: Visual content can evoke emotions, and emotions play a role in why people share content. If you can get your audience to laugh, cry, or feel inspired, they will want to share that with others.
- Easy to digest: Visual content can convey complex information, making it easier to understand and remember. Think about infographics, where a lot of data is converted into a visually appealing format.
8. Increase your leads and blog performance with videos and images

Let me share two interesting statistics with you that are going to change the way you present blogs and text to your audience:
- Adding images and video to blog posts helped them perform better, according to 33% of businesses
- 87% of marketers say that adding video helped them generate leads
Your audience appreciates the added value of receiving information in different formats, but so do search engines. Search engines favor content that includes diverse media types and as a result, your audience will be able to discover them easier.
9. Consumers appreciate colors, images, and videos in website design
We all know that photos, video and color play an important role in web design because we appreciate it, so why should our clients be any different? But did you know that your consumers value images by 40%, color by 39%, and videos by 21%? In fact, 40% of users say they appreciate photos and images on company websites.

Why are we drawn to visual elements in web design?
- People love visual storytelling: Photos and images can be used as storytelling tools. They convey complex messages and emotions quicker than words can. Remember that old saying: An image is a thousand words? That sums it up.
- Images build trust: Well-chosen, high-quality images can instantly enhance the professionalism of a website. This builds trust and increases the chance of engagement with customers. Color plays a role in this as well.
- Visuals develop brand identity: Images, photos, videos, and color all give a visual concept of what a brand is about and whether you relate to it.
10. 69% of B2B marketers say they would increase their investment in video.
Videos are a great way to engage with your audience. They can be educational, funny, or share company culture and previous client testimonials. You can share insights into the way you create your products or do case studies on your services.
69% of B2B marketers are going to be investing more into their video content for 2025, and here is why:
- Broader reach: Videos are more likely to be shared on social media and other platforms. You can also see a higher interaction rate with likes, comments, and shares.
- In-depth analytics: Video can give you another angle on your analytics. By combining video with analytic tools, you can see their behavior such as watch time and drop-off rates.
- Enhanced personalization: Different marketing messages can be tried out with specific customer segments as part of their personalization journey.
11. 75% of marketers use AI tools in video creation and editing
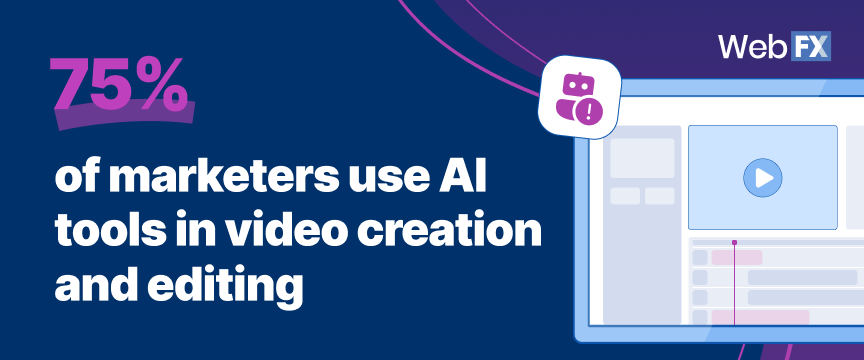
AI can be incredibly useful for pointing out potential issues or giving suggestions on how to round your video up. 75% of video marketers say they use AI tools to help them with their video creation. Here are some ways AI can help you with your video content:
- Enhance personalization: You can use AI algorithms to analyze viewer data to create personalized video content for specific segments. This also includes personalized ads and recommendations.
- Help with analytics: AI-powered analytics tools can give you deeper insights into your video performance, engagement, and drop-off points. Once you know what works and what doesn’t, you can refine your strategy.
- Consistency: You can run through your content through AI to ensure it is consistent with your brand guidelines. This helps with human error that might have missed the smaller details.
12. 45% of B2B marketers will be investing in new technology for content marketing
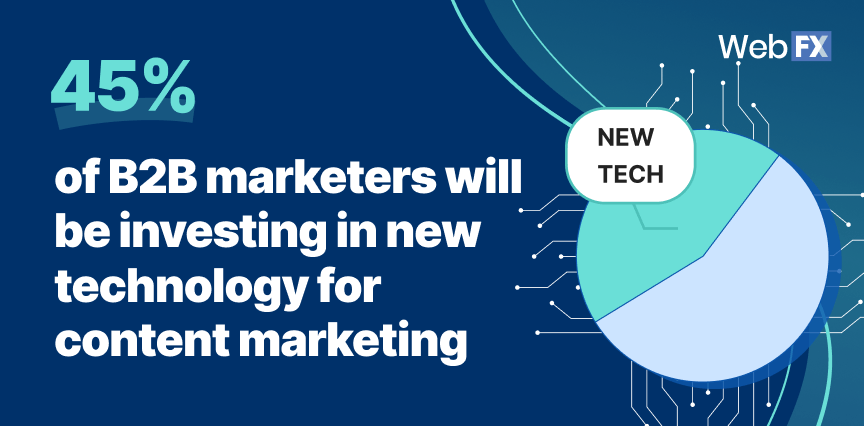
New technologies can provide advanced tools for content creation. Here are some technologies that are seeing an increase and could be the new technology that 45% B2B marketers will be investing in:
- Graphic design software
- AI-powered design tools
- Automated video editing
- Interactive content platforms
- 3D motion graphics software
- Voice and image recognition software
Visual content statistic questions
With 29, you can be sure we have been asked a lot of questions! Here are some of the most common questions people ask about visual content.
How effective is visual content?
Very! Visual content is processed 60,000 times faster than text-based information. It is also retained longer by consumers and can increase conversions by up to 80%. Marketers can use this insight to create content. The benefits of visual content are that:
- It has a higher engagement rate
- It increased sharing than other content
- Consumers spend a longer time with it
How many people prefer visuals
As we have seen in this article, marketers are increasing their use of visual content to appeal to their consumers and reach a larger audience. Over 56% of marketers are changing their perception and will be including visual content more in their strategies.
What types of visual content should I use on my website?
Great question! Not all types of visual content might be applicable for your audience. A great idea is to start looking around and doing a competitive analysis. By checking out competitors and seeing how they present their information, will give you a starting point to some ideas of how you can present yours.
Different visual content can also be used on different channels. Polls and quizzes are great for social media. Gamification is good for loyalty programs and apps. Images, gifts, and calculators can be used on your website.
If you would like some help creating visual content, give one of our strategists a call on 888-601-5359 or reach out online. We can help you brainstorm ideas and even help you create and distribute your visual content!
4 best practices for visual content
There is a lot more that goes into creating visual content than putting a poll on social media. You’ll need a strategic plan, a clear understanding of your goals and your audience, and attention to detail. Here are some steps to get you going on your visual content journey.
1. Understanding your audience
Know who your audience is by getting an understanding of what they care about and what type of visual content works for them. To get you going, consider doing surveys and analyzing demographic data to review engagement metrics. Doing a competitive analysis to see what kind of engagement your competitors are getting with their visual content will also give you a starting point.
2. Keep it consistent
Use a brand guideline to keep your color palette, typography, and style consistent throughout all your channels. Consistency and high-quality content will let your audience feel like you are professional and trustworthy. They will immediately recognize your brand, and it separates you from the competition.
3. Remember SEO
Interactive content should be optimized just like all your other content. Using search engine optimization (SEO) will increase your visibility and get you favored by search engines. A great tip is to also include the video transcript, which allows you to get your keywords in and make content accessible to a wider audience.
4. Make it mobile friendly
Ensure your visual content is optimized for viewing on mobile devices, as a lot of your audience is going to interact through them. Users tend to engage with social media more on their phones, and you don’t want slow loading times to cause an increase in bounce rates.
Give your content a visual boost with WebFX
After looking at these visual content stats, I hope you feel inspired and ready to tackle your marketing strategy in a new way, with interactive elements, games, and images to boost your engagement with your audience. If you need further help creating your visual content marketing master plan, we can help you get there.
Get started today or learn more about our content marketing services by contacting us online or calling us at 888-601-5359!
-
 Celeste has worked in the online marketing space for twenty years. She has written for sectors including tourism, sustainability, education, lifestyle, food, and marketing. You can find her work featured by Green Building Media South Africa, Stodels Gardening, and The Post House Hotel. In magazines, you may have seen her in The Cape Times, Oprah South Africa, and The Property Magazine. While you can find her writing up on the latest SEO trends and exploring digital techniques during the day, her love of story-telling carries on in enriched games and books after hours.
 -

WebFX is a full-service marketing agency with 1,100+ client reviews and a 4.9-star rating on Clutch! Find out how our expert team and revenue-accelerating tech can drive results for you! Learn more
Try our free Marketing Calculator
Craft a tailored online marketing strategy! Utilize our free Internet marketing calculator for a custom plan based on your location, reach, timeframe, and budget.
Plan Your Marketing Budget

Looking for More?
Get expert ideas, industry updates, case studies, and more straight to your inbox to help you level up and get ahead.
"*" indicates required fields

Proven Marketing Strategies
Try our free Marketing Calculator
Craft a tailored online marketing strategy! Utilize our free Internet marketing calculator for a custom plan based on your location, reach, timeframe, and budget.
Plan Your Marketing Budget
What to read next


