-
 13 min. read
-
 WebFX Team
 Digital Marketing Agency
- The WebFX team is made up of more than 500 subject matter experts in digital marketing, SEO, web design and web development, social media, and more. Together, they’ve helped WebFX’s clients earn more than $6 billion in revenue from the web — and that’s just in the past five years. @webfx
Marketing your business online offers lots of benefits. Many business-to-business (B2B) companies, however, encounter problems when it comes to tracking and measure the return on investment (ROI) of digital marketing. The good news is that it’s easy to track B2B marketing’s ROI — it just requires some preparation!
In this guide, you’ll learn how to measure your ROI on B2B marketing using Google Analytics and some optional (but helpful) tools like RevenueCloudFX.
Plus, you’ll get answers to common questions about B2B marketing and its ROI, like “What is the average ROI on B2B marketing?” Keep reading to get started now!
P.S. Get a direct line to digital marketing tips and trends by joining Revenue Weekly!
What is ROI in B2B marketing?
ROI in B2B marketing is a measurement of your marketing strategy’s return on investment. Measuring your ROI on B2B marketing helps your business understand how much revenue your marketing strategies produce, as well as which strategies perform best.
How to measure ROI on B2B marketing
You can measure your ROI on B2B marketing with the following formula: (Revenue – Investment) /Investment * 100. If your company generates $200,000 in digital marketing revenue, for example, and invests $65,000 into your B2B marketing budget, you would achieve a B2B marketing ROI of 208%.
What is a good B2B marketing ROI?
A good B2B marketing ROI depends on your industry, product or services, and online marketing investment. While you can reference ROI benchmarks, they rarely provide the level of accuracy or insight businesses want. That’s why it’s best to brainstorm in-house (or with your digital marketing agency) on an ROI goal.
Determine what’s realistic, as well as what’s preferred, to find a reasonable ROI goal to work towards throughout the year.
How to measure your ROI on B2B marketing
Learn how to measure your ROI on B2B marketing in four steps:
1. Set up website tracking software (i.e. Google Analytics)
The first step in determining ROI is to set up website tracking software for measuring your B2B’s marketing analytics. This seems like a no-brainer, but I’m amazed by how many B2B businesses have no game plan for judging their internet traffic.
Ignorance is not bliss! Unlike other forms of marketing, internet marketing is extremely easy to track, so take advantage of the available tools! Personally, I think Google Analytics is the best tracking software.
It’s relatively easy to setup, costs nothing, and provides a ton of information with the ability to create custom reports, setup scheduled emails and notifications for drops in traffic, etc.
2. Make sure you’re looking at the right data
The biggest mistake you can make when measuring B2B marketing’s ROI is to look solely at overall traffic to determine your ROI. There are many different ways (mediums) people come to your site, with the following being the most common:
- Unbranded, organic traffic
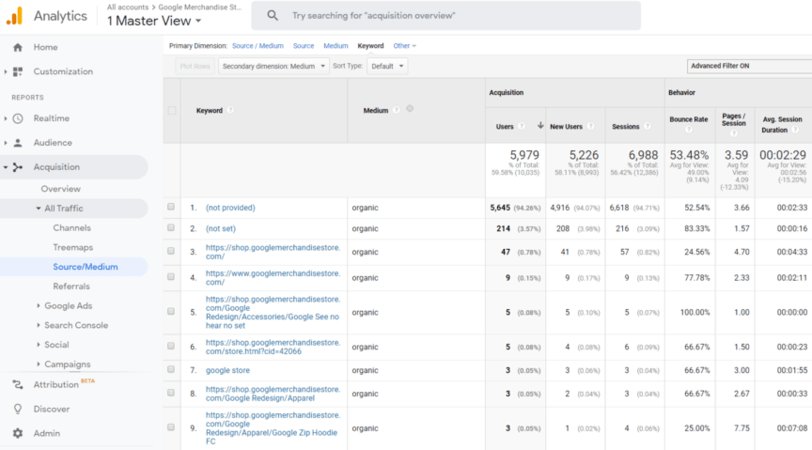
This data encompasses people who come to your site via non-paid traffic who are not already familiar with your brand. For the fictional company, Tuba Fixers, that would be a visit from someone who searched for “tuba repair” versus “tuba fixers.” Make sure you’re looking at unbranded, organic traffic. This is where most B2B businesses can look to improve, as well as see a huge ROI.
In Analytics, go to Acquisition > All Traffic > Source/Medium. Choose “Keyword” as your Primary Dimension, followed by “Medium” as your secondary dimension. Then, choose the advanced filter and select “Exclude,” “Keyword,” “Containing,” and your company name.
Click “Add a dimension or metric,” and select “Medium.” Then, enter “Include,” “Medium,” Containing,” and “organic.”  You can exclude multiple fields to exclude things such as any abbreviations, common misspellings, employee names, etc.
- Branded, organic traffic
This data includes non-paid traffic for people who are already familiar with your brand but did not type your website directly into their browser. For Tuba Fixers, that would be if someone typed “tuba fixers” into Google, rather than typing tubafixers.com into their browser. Branded Traffic is good to monitor to ensure people are aware of your brand.
Follow the same steps as above to find unbranded traffic, except include versus exclude keywords that include your company name. If there is not a lot of traffic for your brand, you may find that you are not even ranking #1 in Google for your brand. You may also see a trend in people searching for an incorrect variation of your brand name, which may show you that your branding is not providing a clear message.
- Paid traffic (if applicable)
If you are running pay-per-click (PPC) advertising through Google Ads, you’ll want to be sure you’re analyzing that traffic in Google Analytics. The difference between organic and paid traffic is that paid traffic is…paid. Each click on an ad (which leads to a visit to your website) costs you money.
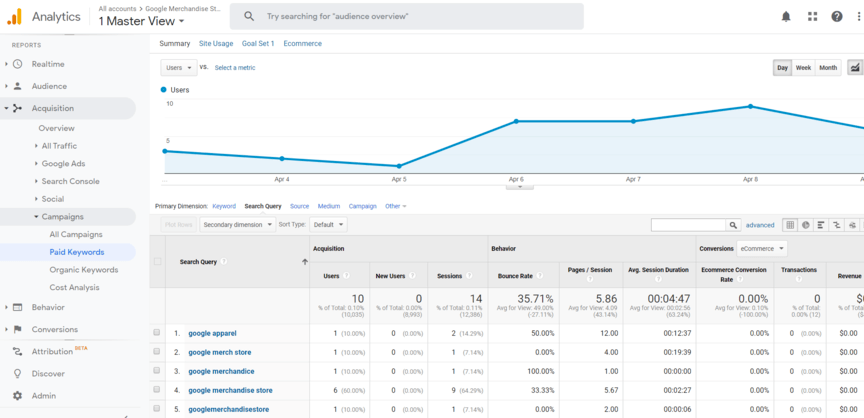 Paid traffic should absolutely be analyzed regularly — you’re paying for those clicks! If you have a high bounce rate (users who leave your site after viewing only one page), perhaps there is not a clear next step on your website. It could also be that the traffic is not relevant.
Go to Acquisition > Campaigns > Paid Keywords and select “Search Query” as your Primary Dimension. Check this data to make sure people aren’t searching for something unrelated to your business.
- Referral traffic
This data includes all traffic to your website that comes from a link on another website. If you are listed with your website on an industry directory and someone clicks on your website, that visit will show under referral traffic. Access referral traffic by viewing Acquisition > All Traffic > Referrals.
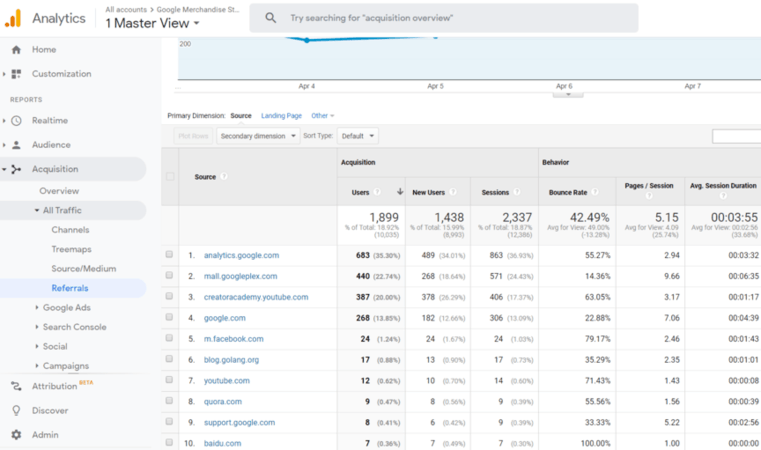 Referral traffic is useful to determine if a specific listing or mention on the web is bringing valuable traffic to your website. This can also be used to see social media referral traffic (i.e. Facebook, Twitter, LinkedIn, and YouTube).
- Direct traffic
This data encompasses all visits to your site for users who type your website directly into their browser. View direct traffic with these steps: Acquisition > All Traffic > Channels. Then, select “Direct.” 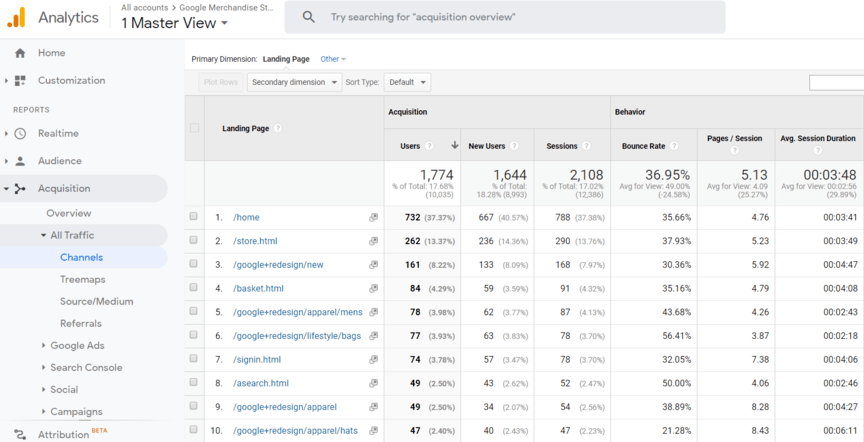
3. Set up measurable conversions in Google Analytics as Goals
Determine what a conversion is for your company.
A contact form being filled out? A phone call? A newsletter sign up?
Viewing the Directions Page? The easiest way to track form conversions is to set up a unique thank you page for all forms on your site (contact form, quote request, newsletter sign up, etc.) and then track the views of that thank you page as a goal. Go to Admin > View > Goals and see the screenshot below for a sample registration page setup.
You’ll want to enter a “Value,” which will assign a monetary value to someone contacting your company, for instance, or registering for an event.
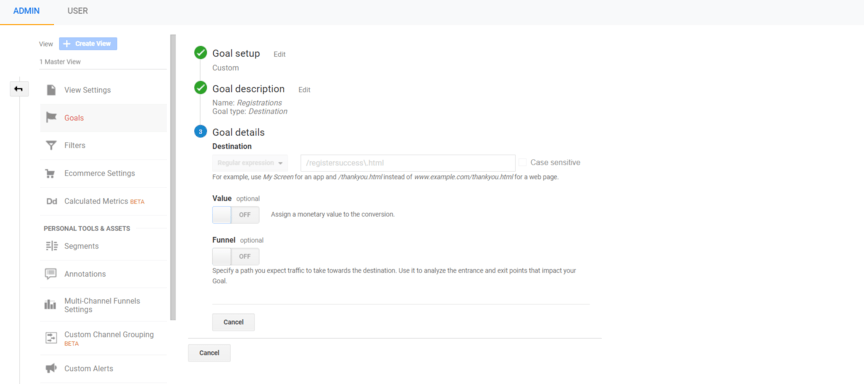
Along with form conversions, you may also want to track specific page views, such as a new product you’re offering or a directions page if you’re a local business. You can use the same process to set that up.
4. Use the B2B marketing ROI formula
Now that you are tracking the data from your website, you’re ready to do the math. I promise this isn’t as hard as it may seem! Get started with measuring your ROI on B2B marketing with the following formula:
(Revenue – Investment) /Investment * 100
First, calculate your revenue from digital marketing.
For example, determine how many leads you get each month. Separate those leads into contact forms, quote requests, newsletter sign ups, calls, and whatever else your company uses. Next, determine how many leads for each lead generation source actually converted.
This may need to be calculated after an entire year of data has been collected, depending on your business’s lead time. If you had 30 contact forms filled out in May and 15 became customers, for instance, you have a 50% conversion rate. If you have 5 newsletter sign-ups and 1 became a customer, you have a 20% conversion rate for that.
Finally, determine the value of a lead for your company. You may have already completed this step when creating goals in Google Analytics. If not, you’ll need to assign a value now.
This part can be tricky, especially if you offer a variety of different services. Don’t worry if you’re not 100% accurate. As an example, let’s say your business gets those 15 new customers and estimates that those customers are worth about $5000 each or $75,000 total.
You’ll now need to calculate your investment, which can include:
- Salaries
- Paid tools
- Professional digital marketing services
- And more
Let’s say your business invests around $5000 each month into marketing itself online. You now have a total revenue of $75,000 and a total investment of $5000. Let’s add these numbers to the B2B marketing ROI formula:
(Revenue – Investment) /Investment * 100
($75,000 – $5000) / $5000 * 100
$70,000 / $5000 * 100
14 * 100
1400%
In this example, your company earned a 1400% ROI, which is beyond impressive!
6 additional ways to measure your B2B marketing ROI
These additional reports are absolutely my favorite part of the process because you get to see how much your hard work has paid off, literally.
1. Conversions by medium report
This report will take some customization but is well worth the time as you can continue to rely on this report each month. It’s my absolute favorite for clients who are utilizing different online marketing sources. Go to Conversions > Multi-Channel Funnels > Assisted Conversions in Analytics. Under the Explorer Tab, select Conversions.
You’ll see a basic break down of website conversions based on the Medium (Organic, Paid, Referral, Direct), with the total value.
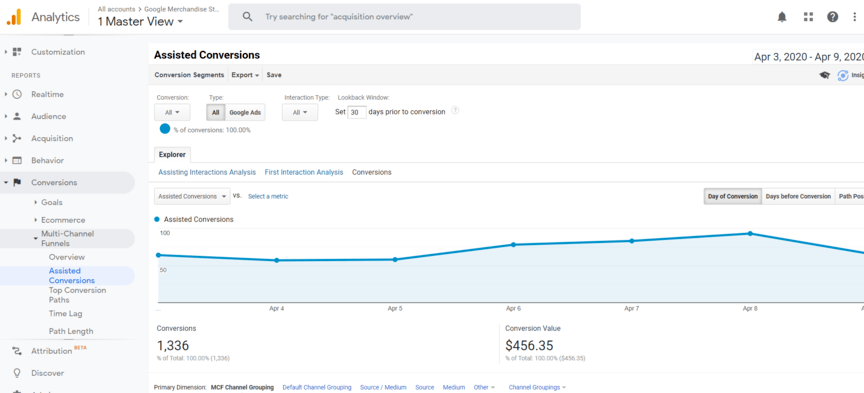
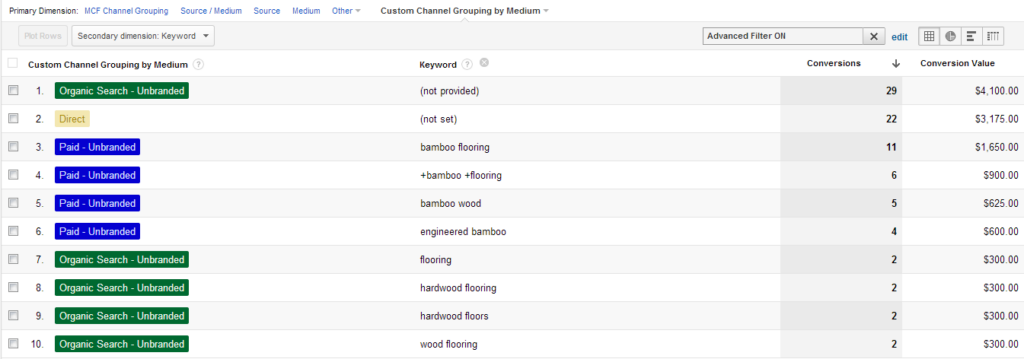
You can also create a custom channel grouping from the dropdown menu to see more clearly which medium is driving the most money. In this case, Organic Search – Unbranded, is driving the most money.

By selecting a secondary dimension, you can dig deeper into this data. My preferred secondary dimensions to use are “source” and “keyword,” both shown below:

2. Assisted Conversions by medium report
By simply selecting “Assisting Interactions Analysis” on the Explorer Tab in the previous report, you can now view which mediums brought in assisted conversions. This is especially important to review, since not all users convert after their first interaction on your website.  The column labeled “Assisted Conversions” shows us which traffic mediums played a role in a conversion in which they did not receive credit as the main source for the conversion.
If you do not see a traffic medium converting for you, make sure you’re checking the assisted conversions as well, as it may actually be playing a key role in the conversion process!
3. Top Conversion Paths report
Go to Conversions > Multi-Channel Funnels > Top Conversion Paths to view this report. I love showing clients this report, because it shows them how people come to their site that ultimately leads to a conversion.  It’s usually not the first time they visit the site!
4. RevenueCloudFX reports
At WebFX, we have our own software to help our clients determine the ROI for their campaigns.
RevenueCloudFX is a proprietary and client-exclusive software that provides in-depth, actionable data that our team and our clients can use to get even better results from online marketing campaigns. Tools within RevenueCloudFX, like LeadManagerFX and CompanyTrackerFX, give your business an unmatched view into the journey of leads. This data can help you better understand the customer journey, which can lead to improvements in your content marketing, search engine optimization (SEO), and any other digital marketing tactics your company uses.
Start measuring (and improving) your B2B marketing ROI
While there are several ways to calculate ROI and determine what is working best for your B2B business, these techniques have proven to be the most effective for measuring B2B marketing’s ROI.
While setting up Google Analytics requires some time upfront, this initial investment allows you to track your website ROI and compare data from month-to-month and year-to-year. Ultimately, this process will help you invest your time in the areas that provide the best ROI and allow you to show your boss, shareholders, or board of directors that you are on top of your game! Looking for help measuring your B2B marketing ROI?
Check out our Google Analytics consulting services!
-
 The WebFX team is made up of more than 500 subject matter experts in digital marketing, SEO, web design and web development, social media, and more. Together, they’ve helped WebFX’s clients earn more than $6 billion in revenue from the web — and that’s just in the past five years.@webfx
 -

WebFX is a full-service marketing agency with 1,100+ client reviews and a 4.9-star rating on Clutch! Find out how our expert team and revenue-accelerating tech can drive results for you! Learn more
Try our free Marketing Calculator
Craft a tailored online marketing strategy! Utilize our free Internet marketing calculator for a custom plan based on your location, reach, timeframe, and budget.
Plan Your Marketing Budget

Proven Marketing Strategies

Proven Marketing Strategies
Try our free Marketing Calculator
Craft a tailored online marketing strategy! Utilize our free Internet marketing calculator for a custom plan based on your location, reach, timeframe, and budget.
Plan Your Marketing Budget
What to read next


