Analytics Resources for Digital Marketing From WebFX


Marketing Mix Modeling Services
ServicesNot all channels perform equally. Marketing mix modeling services show you exactly where your marketing spend works hardest and where it doesn't.
Channel Attribution & Forecasting Services
ServicesDrive a bigger marketing ROI with channel attribution and forecasting services from WebFX. Learn more about our custom plans now!
Web Analytics Services: Find a Top Web Analytics Service Provider
ServicesWhat are web analytics services and how can you find a top website analytics service provider that you can trust to drive results? We have all the answers!
Explore one of these categories to go more in-depth on a specific analytics topic or keep reading for our beginner’s guide to digital marketing analytics, complete with additional resources.

Learn the basics of marketing analytics


Learn about marketing analytics technology

Learn about marketing analytics for SMBs


Learn about marketing analytics for B2C companies

Learn about marketing analytics for ecommerce companies

Learn about marketing analytics for enterprise companies
What is marketing analytics?
Marketing analytics refers to analyzing data to measure, evaluate, and manage marketing performance to maximize effectiveness and optimize your business’s return on investment (ROI). By applying technology and analytical processes to marketing-related data, businesses can understand what drives consumer actions, refine their marketing campaigns, and increase their ROI.
Learn more about the basics of marketing analytics
Marketing analytics basics resources
- What Is Marketing Analytics and How Can You Use It?
- What Is Marketing Analytics? Definition and Tips
- Digital Marketing Analysis: Build Your Marketing Strategy With Data
- Marketing Data Management: How to Leverage Your Data
- Data Analytics: What It Is and How to Use It
- How Can Data-Driven Marketing Improve Your Marketing?
- What Is Predictive Marketing? (And Why Does It Matter Now?)
- Marketing Analytics Glossary: 60 Must-Know Analytics Terms
 Why is analytics important for digital marketing?
Analytics is important for digital marketing because it enables marketers to make data-driven decisions.
Analytics allows you to quantify the effects of the various techniques in your marketing strategy so that you can improve and optimize your campaigns.
With analytics, you can combine all of your marketing data in one place and improve your understanding of trends over time.
Learn more about the benefits of marketing analytics
Marketing analytics benefits resources
- Why Analytics Are So Important for Internet Marketing
- Why Are Analytics Important for Digital Marketing?
- 6 Best Benefits of Digital Marketing
How to get started with digital marketing analytics
How can you get started with marketing analytics? Here are a few essential steps to follow.
1. Set SMART goals for your marketing campaign
Setting goals helps you measure your progress and have a clear end in mind to aim for. To create more effective goals, use the SMART method by creating goals that are specific, measurable, attainable, relevant, and timely.
2. Choose your marketing performance metrics
This will enable you to keep all your campaign data in one place and analyze performance. These metrics, or key performance indicators (KPIs), help you quantify your progress toward your goals.
3. Set up marketing performance measurement tools
Digital marketing efforts are Internet-based, so you have access to accurate, detailed information about how your campaigns perform. Some tools you can use include:
4. Start measuring your marketing performance
Once you have your marketing goals, metrics, and tools ready to go, start tracking your metrics. Tracking important marketing performance metrics will tell you what’s working in your campaign and what you need to change.
Get more tips for getting started with marketing analytics
These marketing analytics resources are filled with actionable tips to help you measure, evaluate, and improve your marketing campaigns.
Marketing analytics tips
- 5 Tips for Using Data-Driven Marketing to Create Effective Campaigns
- Measuring Marketing Performance: 4 Steps to Success
- 6 Tips for Creating an Effective Marketing Plan
- Digital Marketing Report: Create Your Report in 5 Easy Steps
- 8 Expert Digital Marketing Optimization Tips to Follow
- Digital Marketing ROI: Our Guide to Measuring & Improving It
- Increase Marketing ROI With These 5 Valuable Tips
- How to Collect First-Party Data
- Marketing Attribution: Everything You Need to Know
Digital marketing metrics
Learn about the most important digital marketing metrics with these free marketing analytics resources. Get definitions of essential KPIs, learn how they impact your marketing, and get tips on using them to improve your campaigns.
Digital marketing metrics resources
- Website Metrics Definition: What Are Website Metrics?
- What Are Marketing KPIs? (Plus 11 Marketing KPIs to Monitor)
- 14 Digital Marketing Metrics to Measure
- How to Measure Digital Marketing Success: 7 Metrics to Watch
- 12 Marketing KPIs That’ll Revolutionize Your Campaigns
- 25 Digital Marketing KPIs You Should Be Monitoring
- Digital Marketing ROI Metrics: 7 Key Items to Track
- Website KPIs: 8 Website Performance Metrics to Track
- 7 Most Useful Conversion Rate Metrics to Track
- What Metrics Are Important for Successful SEO?
- 5 Essential Metrics in Email Marketing
- 5 Key Paid Search Metrics to Watch for Your PPC Campaign
Marketing analytics technology
Successful marketing analytics depends on having the right tools and technologies available. Explore these resources to learn about the best marketing analytics tools.
Marketing analytics technology resources
- Marketing Analytics Technology: 10 Platforms to Try
- Martech Basics: Your Guide to Marketing Technology
- The Best Analytics Platforms
- What Is a Data Management Platform (DMP)?
- The Best Data Management Tools for Your Business
- Best Data Analysis Software: 6 Data Analytics Tools to Consider
- What Is Customer Data Management? Definition & Best Practices
- 13 Paid & Free Data Visualization Tools: Which Will You Use?
- How To Implement Google Analytics
- How to Set Up Google Analytics
- 7 Awesome Google Analytics WordPress Plugins
- Google Analytics Dashboards: An All-Encompassing Guide
- The Google Analytics Glossary: 55+ Terms and Definitions
- The 7 Best Google Analytics Reports for Marketers in 2022
- What is Google Search Console? | Guide to Getting Started
- Google Search Console: 4 Tips for Making It Work for You
- What Is Ahrefs? | How to Leverage Ahrefs for Your Business
- What Is SEMrush and Why Should I Use It for My Business?
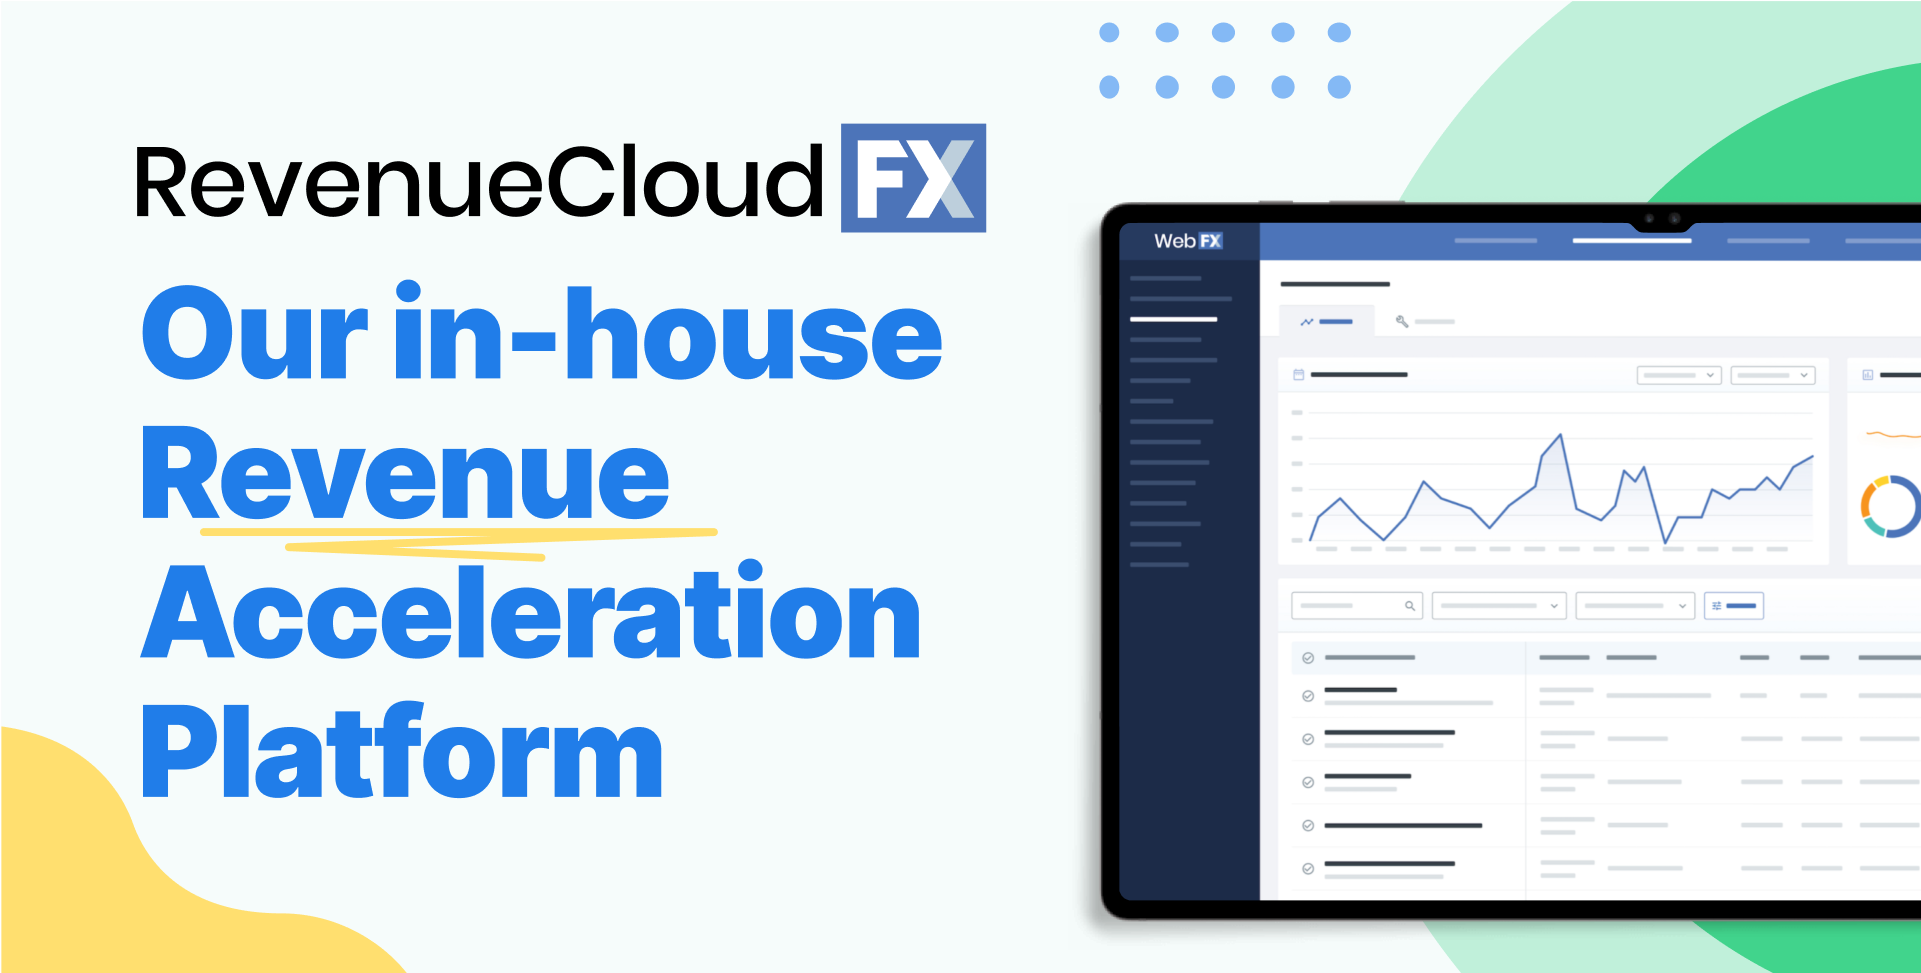
- RevenueCloudFX | Marketing automation software by WebFX
- What is LeadManagerFX?
- LeadNurtureFX: A RevenueCloudFX Feature
- What Can CallTrackerFX Do for You?
- CRM Integration: RevenueCloudFX
 Working with a marketing analytics agency
Marketing analytics companies help you collect information about your website, marketing campaigns, and potential customers. They will also break that information down for you so you understand it.
Professional marketing analytics firms stay on top of the analytics industry so you don’t have to. This helps them ensure you have the most valuable data and insights available, enabling you to stay ahead of the competition and maximize your marketing’s ROI.
It’s essential to choose the right marketing analytics company to help you make the most of your analytics and improve your marketing campaigns.
Learn more about working with marketing analytics companies
Get the inside scoop on marketing analytics services with the resources below. Learn what a marketing analytics company does, what services they offer, how to choose the right company to work with, and more. Plus, learn about the expert marketing analytics services we offer here at WebFX.
Marketing analytics agency resources
- 7 Tips for Choosing a Top Marketing Analytics Company
- How to Choose a Marketing Analytics Service
- A Marketing Analytics Agency That Helps You Gain New Insight
- Marketing Analytics Services From WebFX
- Marketing Analytics Pricing: The Cost of Marketing Analytics
- Top-Rated Big Data Analytics Consulting Firm | WebFX
- Channel Attribution & Forecasting Services | WebFX
- Find a Top Web Analytics Service Provider
- Internet Analytics Consulting
- Website Call Tracking Services | Call Tracking Software | WebFX
- Google Analytics Consulting – Put Your Data To Work!
- Improve Your Website With Visitor Analytics | WebFX
Analytics resources by marketing channel
Measuring and analyzing your campaigns’ performance is essential no matter what channels and strategies you use. From SEO to PPC and beyond, browse marketing analytics resources by channel below.
Analytics resources by channel
- SEO Analytics: The 10-Minute Guide for Beginners
- PPC Analysis: 4 Tips for Conducting an Impactful PPC Analysis
- The 6 Most Important KPIs for Google Ads
- Email Marketing Analytics: 8 Metrics You Need to Measure
- 8 Email Marketing Metrics You Should Always Track
- Measure Content Marketing: Content Marketing Metrics to Watch
- How to Measure the Effectiveness of Web Designs
- Video Marketing Analytics
- Mobile App Analytics: Your 2022 Guide to App Analytics
- 12 Social Media Metrics to Track in Your Online Marketing
- 8 Twitter Analytics That Help You Create a Better Campaign
- 4 Benefits of Using Instagram Analytics for Marketing
- Facebook Analytics Report: How to Create Your 1st Report
Marketing analytics for different types of businesses
The ideal analytics tools and techniques might differ depending on the type of business you run. Explore marketing analytics resources for various kinds of companies here:
Marketing analytics for B2C companies
Marketing analytics for B2B companies
Marketing analytics for SMBs
Marketing analytics for enterprise companies
Marketing analytics for ecommerce companies
Marketing analytics FAQs
These free resources answer some of the most common marketing analytics FAQs.
Analytics FAQs
- What Are the Best Traffic Sources?
- What is a Good Bounce Rate?
- What is Bounce Rate and How Can it Be Reduced?
- What Is Call Tracking?
- What is Dwell Time?
- What Are KPIs in Marketing?
- What Web Marketing Analytics Are Most Important?
- Why Are Analytics So Important for Internet Marketing?
- Why Does My Website Have a High Bounce Rate?
- What’s the Difference Between Bounce Rate and Exit Rate?
- Why Does My Website Get Irrelevant Traffic?
Additional Channels and Strategies
Learn how to market (and measure) your company’s success with other digital marketing strategies, like content marketing, social media marketing, and email marketing, with the following resources!
Learn more about marketing analytics
If you’re ready to learn more about how analytics can improve your marketing campaigns, sign up for WebFX emails to get the latest marketing tips and actionable advice delivered straight to your inbox.
We look forward to helping your business grow!