

Table of Contents
- What is SEO benchmarking?
- 2026 SEO benchmarks (and how you compare)
- SEO visibility and ranking benchmarks
- SEO authority and backlink benchmarks
- SEO content benchmarks
- SEO performance and timeline benchmarks
- How to use SEO benchmarks to improve ROI
- 1. Audit your current performance against industry standards
- 2. Prioritize high-impact gaps first
- 3. Set realistic timelines and milestones
- 4. Track business outcomes, not vanity metrics
- 5. Build a content refresh calendar
- 6. Monitor AI Overview exposure
- 7. Use benchmarks to secure buy-in and budget
- FAQs about 2026 SEO benchmarks
- Benchmark and break through with a proven SEO partner
- Data sources & methodology

TL;DR: 2026 SEO benchmarks (fast facts)
- Visibility and rankings: Position 1 captures around 27.6% of organic clicks. AI Overviews now appear in 25.8% of searches overall, jumping to 51.6% in health and 65.9% for long informational queries.
- Authority and backlinks: Position 1 demands ~365 referring domains on average, with YMYL industries like finance and legal requiring 500 to 600. Quality beats quantity: Top 3 results have 13% more high-DR backlinks than positions 4 to 10.
- Content depth and freshness: Top-ranking pages average 1,750 words. 72% of top 3 results were updated within the past year, with ecommerce and healthcare content refreshed every 6 to 9 months.
- Performance and timelines: Expect 6 to 12 months for stable rankings. Practitioners report conversions and revenue as the most valuable metrics, while raw rankings are increasingly seen as vanity.
Is your SEO actually working, or are you just guessing?
That question haunts marketing managers, business owners, and growth leaders who invest thousands into organic search without a clear way to measure success. Traffic is up, but is it good? Rankings improved, but compared to what?
This is where SEO benchmarking comes in. SEO benchmarks give you the reference points to measure your performance against industry standards, spot gaps before they become problems, and prove ROI to leadership without hand-waving.
This guide draws from our proprietary WebFX data, third-party ranking research, and practitioner insights from Reddit SEO communities. Inside, you’ll find 2026 SEO industry benchmarks for keyword difficulty, backlinks, content, AI Overviews, and more, broken down by industry so you can see exactly where you stand.
Let’s get to work:
- What is SEO benchmarking?
- 2026 SEO benchmarks (and how you compare)
- How to use SEO benchmarks to improve ROI
- FAQs about 2026 SEO benchmarks
Don’t miss our Revenue Weekly emails!
Join 200K smart marketers for the hottest marketing news and insights in your inbox.
Inline Subscription Form
“*” indicates required fields

What is SEO benchmarking?
SEO benchmarking is the process of comparing your website’s search performance against industry standards, competitors, or your own historical data. It answers one simple question: how do your results stack up?
Think of it like a health checkup for your organic search strategy. Without benchmarks, you’re flying blind. You might celebrate a 3% conversion rate without realizing your industry averages 5%. Or panic over a 45% bounce rate that’s actually normal for your vertical.
The goal isn’t to hit every benchmark perfectly. It’s to know where you stand, identify gaps worth closing, and set realistic targets that tie back to revenue.
For marketing managers reporting to leadership, benchmarks turn “trust me, SEO is working” into “here’s exactly how we compare to industry standards.” That’s the difference between getting budget approved and getting questioned.
2026 SEO benchmarks (and how you compare)
Now for the numbers. We’ve organized the SEO benchmarks into four categories based on what actually moves the needle for organic search performance.
Each section includes industry breakdowns, data tables, and key insights so you can quickly compare your metrics against what top-performing sites achieve. Treat this as your baseline for auditing what’s working and identifying where to push harder.
Here’s your roadmap:
- SEO visibility and ranking benchmarks: keyword difficulty, organic CTR by position, and AI Overview exposure
- SEO authority and backlink benchmarks: referring domains needed to rank, backlink quality distribution, and link building priorities
- SEO Content benchmarks: word count by intent, freshness patterns, and publishing frequency
- SEO Performance and timeline benchmarks: time to rank, metrics that matter vs. vanity metrics, industry pain points, and realistic ROI expectations
SEO visibility and ranking benchmarks
Organic visibility is getting harder to earn and easier to lose. These SEO industry benchmarks show what it takes to rank in your industry, how much of that visibility converts to clicks, and where AI Overviews are siphoning attention away from traditional results.
Keyword difficulty by industry
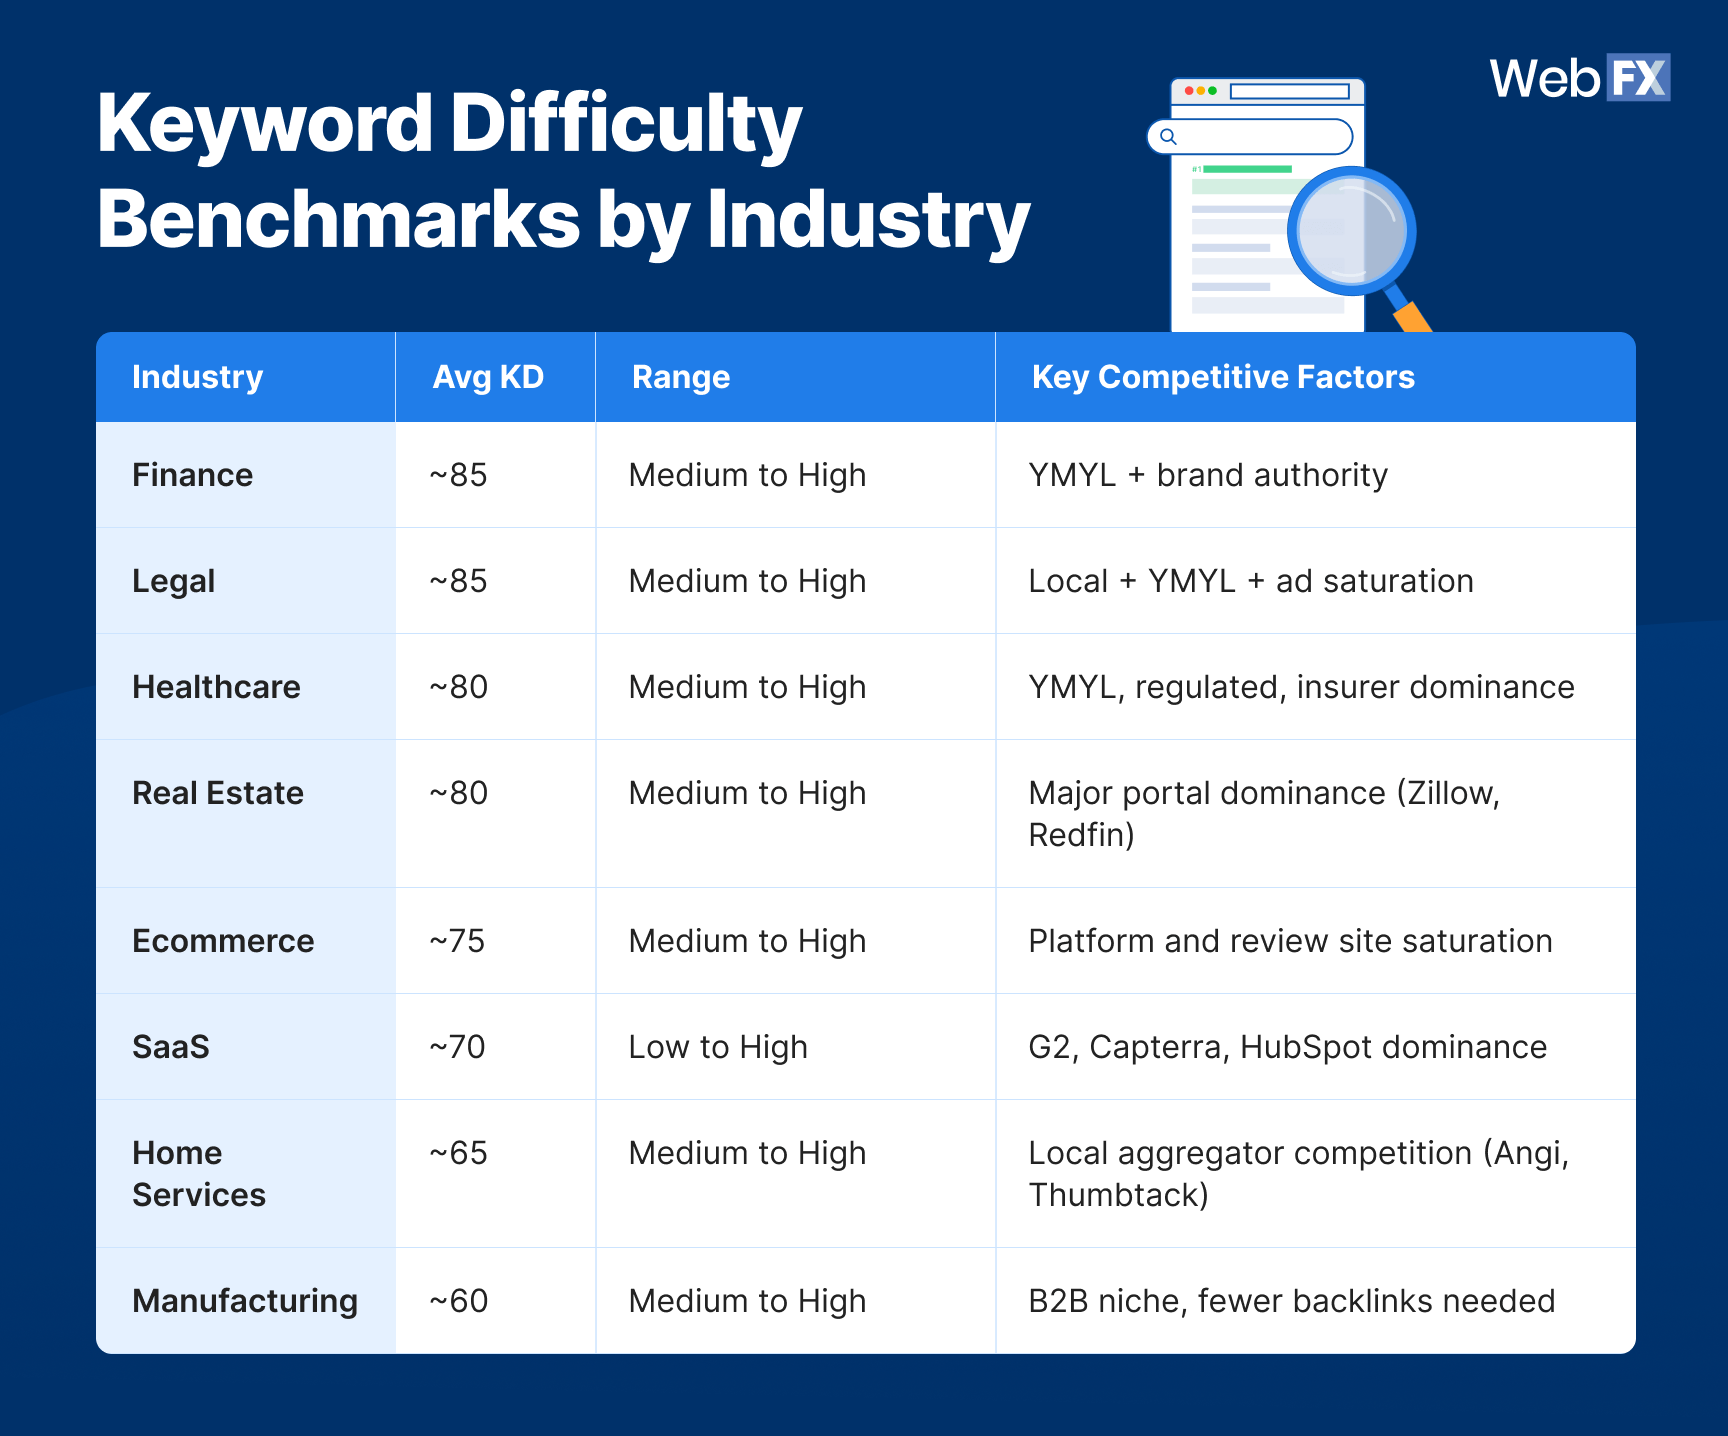
Keyword difficulty (KD) measures how hard it is to rank on page one for a given term. The higher the score, the more backlinks, authority, and content quality you’ll need to compete.
Source data
| Industry | Avg KD | Range | Key Competitive Factors |
| Finance | ~85 | Medium to High | YMYL + brand authority |
| Legal | ~85 | Medium to High | Local + YMYL + ad saturation |
| Healthcare | ~80 | Medium to High | YMYL, regulated, insurer dominance |
| Real Estate | ~80 | Medium to High | Major portal dominance (Zillow, Redfin) |
| Ecommerce | ~75 | Medium to High | Platform and review site saturation |
| SaaS | ~70 | Low to High | G2, Capterra, HubSpot dominance |
| Home Services | ~65 | Medium to High | Local aggregator competition (Angi, Thumbtack) |
| Manufacturing | ~60 | Medium to High | B2B niche, fewer backlinks needed |
YMYL (Your Money or Your Life) industries like finance, legal, and healthcare face the steepest competition. Google holds these verticals to higher trust and authority standards, which means ranking requires more than just good content.
Organic CTR by SERP position
Ranking on page one is only half the equation. Click-through rate (CTR) determines how much of that visibility turns into actual traffic.
| Position | Avg Organic CTR |
| Position 1 | ~27.6% |
| Position 2 | ~15 to 18% |
| Position 3 | ~10 to 12% |
| Positions 4 to 10 | Steep drop-off (single digits) |
Position one captures nearly a third of all clicks. By position four, you’re fighting for scraps. This is why the jump from “page one” to “top three” matters more than most teams realize.
AI Overview benchmarks
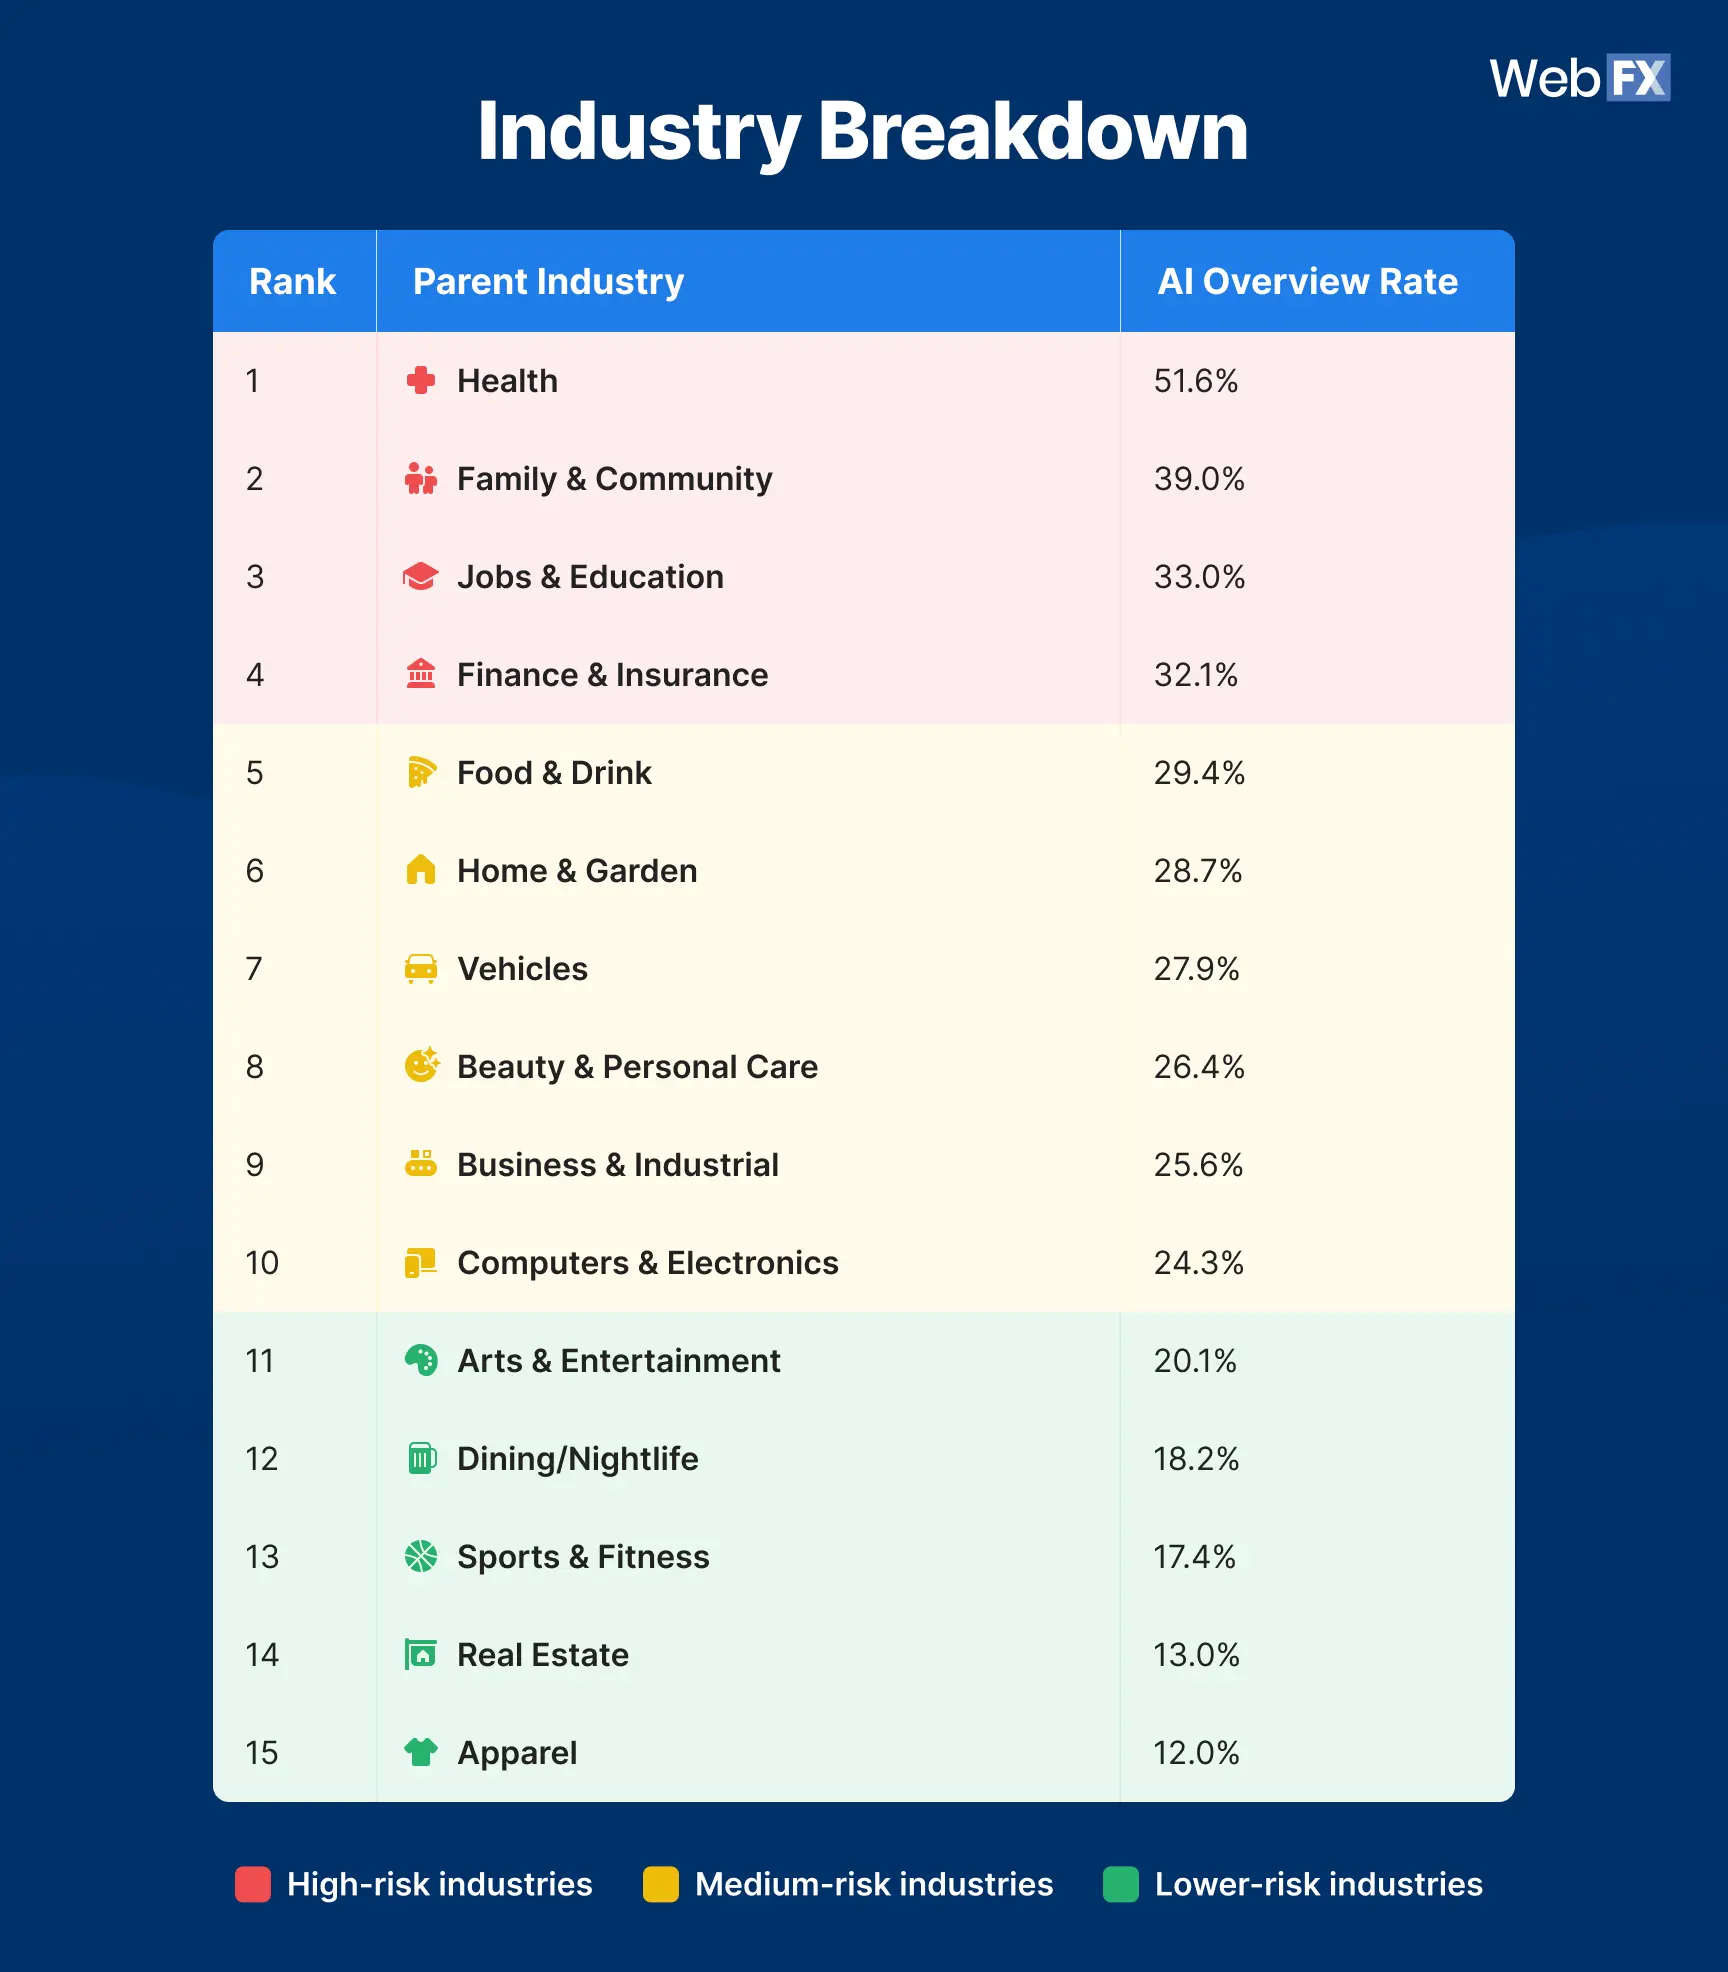
Google’s AI Overviews are changing how users interact with search results. Based on our study of 2.3 million US keywords, here’s how often they appear and what triggers them.
AI Overview rate by industry
Source data
| Rank | Parent Industry | AI Overview Rate |
| 1 | Health | 51.6% |
| 2 | Family & Community | 39.0% |
| 3 | Jobs & Education | 33.0% |
| 4 | Finance & Insurance | 32.1% |
| 5 | Food & Drink | 29.4% |
| 6 | Home & Garden | 28.7% |
| 7 | Vehicles | 27.9% |
| 8 | Beauty & Personal Care | 26.4% |
| 9 | Business & Industrial | 25.6% |
| 10 | Computers & Electronics | 24.3% |
| 11 | Arts & Entertainment | 20.1% |
| 12 | Dining & Nightlife | 18.2% |
| 13 | Sports & Fitness | 17.4% |
| 14 | Real Estate | 13.0% |
| 15 | Apparel | 12.0% |
Health leads at 51.6%, meaning more than half of health-related searches now show an AI-generated answer before traditional organic results. Visual-heavy industries like apparel and real estate remain more protected.
AI Overview rate by query length
| Word Length | AI Overview Rate |
| 1 to 2 words | 19.6% |
| 3 to 4 words | 24.1% |
| 5 to 6 words | 33.6% |
| 7+ words | 54.7% |
Longer queries trigger AI Overviews at much higher rates. Once a query hits seven words, you’re essentially flipping a coin on whether Google shows an AI answer first.
AI Overview rate by search intent
| Search Intent | AI Overview Rate (All Lengths) | AI Overview Rate (7+ Words) |
| Informational | 39.4% | 65.9% |
| Commercial | 22.2% | 46.1% |
| Transactional | 16.5% | 31.8% |
| Navigational | 12.0% | 23.1% |
Informational queries face the highest AI Overview rates. If your content strategy relies heavily on “what is” and “how to” content, expect increased competition from AI-generated answers.
What the data tells us
- YMYL industries face a double challenge. High keyword difficulty plus elevated AI Overview rates (health at 51.6%, finance at 32.1%) mean these verticals need stronger E-E-A-T signals and more authoritative backlinks to compete.
- Position one is worth fighting for. The gap between position one (27.6% CTR) and position four (single digits) represents a massive traffic difference, even for the same keyword.
- AI Overviews reward informational content creators less. With 39.4% of informational queries showing AI answers (65.9% for long-form queries), traditional blog traffic is increasingly at risk.
- Visual and local industries have natural protection. Apparel (12%), real estate (13%), and dining (18.2%) see lower AI Overview rates because these searches require images, maps, or real-time information that AI cannot easily replicate.
How to act on it
- Audit your keyword portfolio by industry KD. If you’re in a high-KD vertical like finance or legal, prioritize long-tail keywords and build topical authority before going after head terms.
- Prioritize top-three rankings, not just page one. The CTR drop-off after position three is steep. Focus resources on moving from “ranking” to “winning.”
- Track AI Overview exposure for your target keywords. Use tools like SEO.com’s free AI Overview checker to see which of your keywords trigger AI answers and adapt your strategy accordingly.
- Diversify beyond informational content. If AI Overviews dominate your core queries, consider shifting toward transactional content, interactive tools, or video formats that AI cannot easily summarize.
SEO authority and backlink benchmarks
Backlinks remain one of the strongest ranking signals in Google’s algorithm. But how many do you actually need, and does quality matter more than quantity? These SEO benchmarks break down referring domain requirements by industry and position, plus the link quality distribution that separates top performers from everyone else.
Referring domains needed to rank by industry
The number of referring domains (RD), or the number of unique websites linking to you, correlates strongly with ranking position. Here’s what it takes to compete across industries:
![]()
Source data
| Industry | Avg RDs (Position 1) | Avg RDs (Positions 2 to 5) | Avg RDs (Positions 6 to 10) | Competitiveness Summary |
| Finance | 600 | 400 | 220 | Extremely high; YMYL + financial authority weighting means strong link requirements |
| Legal | 500 | 320 | 180 | Local competition varies, but national keywords require large backlink portfolios |
| Healthcare | 420 | 280 | 150 | High YMYL competition; dominated by authoritative gov/edu/medical publishers |
| Real Estate | 380 | 240 | 130 | Dominated by portals (Zillow, Redfin); independent sites need strong local backlinks |
| Ecommerce | 350 | 220 | 120 | High due to Amazon, Shopify, and retail platforms with massive link equity |
| SaaS | 270 | 180 | 90 | High competition for category terms; B2B content marketing dominates backlink equity |
| Home Services | 250 | 150 | 80 | Competitive at local level; citations, local press, and aggregator sites drive authority |
| Manufacturing | 150 | 90 | 50 | Moderate; technical niches depend on trade publication backlinks and supplier directories |
Position one demands roughly 3x the referring domains of positions 6 to 10 across all industries. The gap is even wider in YMYL verticals like finance and legal, where trust signals carry extra weight.
Cross-industry referring domain benchmarks
| Rank Group | Avg RDs (Cross-Industry) | What It Takes |
| Position 1 | ~365 | Usually backed by top-tier DR (70+) sites or strong local authority |
| Positions 2 to 5 | ~235 | Can compete with solid DR (50 to 65) and optimized content |
| Positions 6 to 10 | ~125 | Often mid-authority domains (DR 40 to 60) or niche-optimized long-tail results |
Backlink quality distribution
Not all backlinks are created equal. Domain Rating (DR) is an Ahrefs metric that scores a website’s backlink authority on a scale of 0 to 100. Here’s how link quality typically breaks down for pages ranking on page one:
| Domain Rating (DR) Tier | Avg % of Backlinks | Typical Range | What It Means |
| DR 50+ (High Authority) | ~39% | 35% to 50% | Editorial, contextual links from strong sites. Top-ranking pages usually have 35% to 50% from high-DR sources. |
| DR 30 to 49 (Mid Authority) | ~37% | 30% to 45% | Blogs, industry directories, guest posts, and PR mentions. Common across all top 10 results. |
| DR below 30 (Low Authority) | ~24% | 15% to 35% | New, low-authority, or spam-adjacent links. Adds diversity but contributes little to ranking power. |
The top three results have roughly 13% more high-DR backlinks than positions 4 to 10. When more than 50% of your backlinks come from DR below 30 domains, ranking power typically drops sharply.
Backlink quality distribution by industry
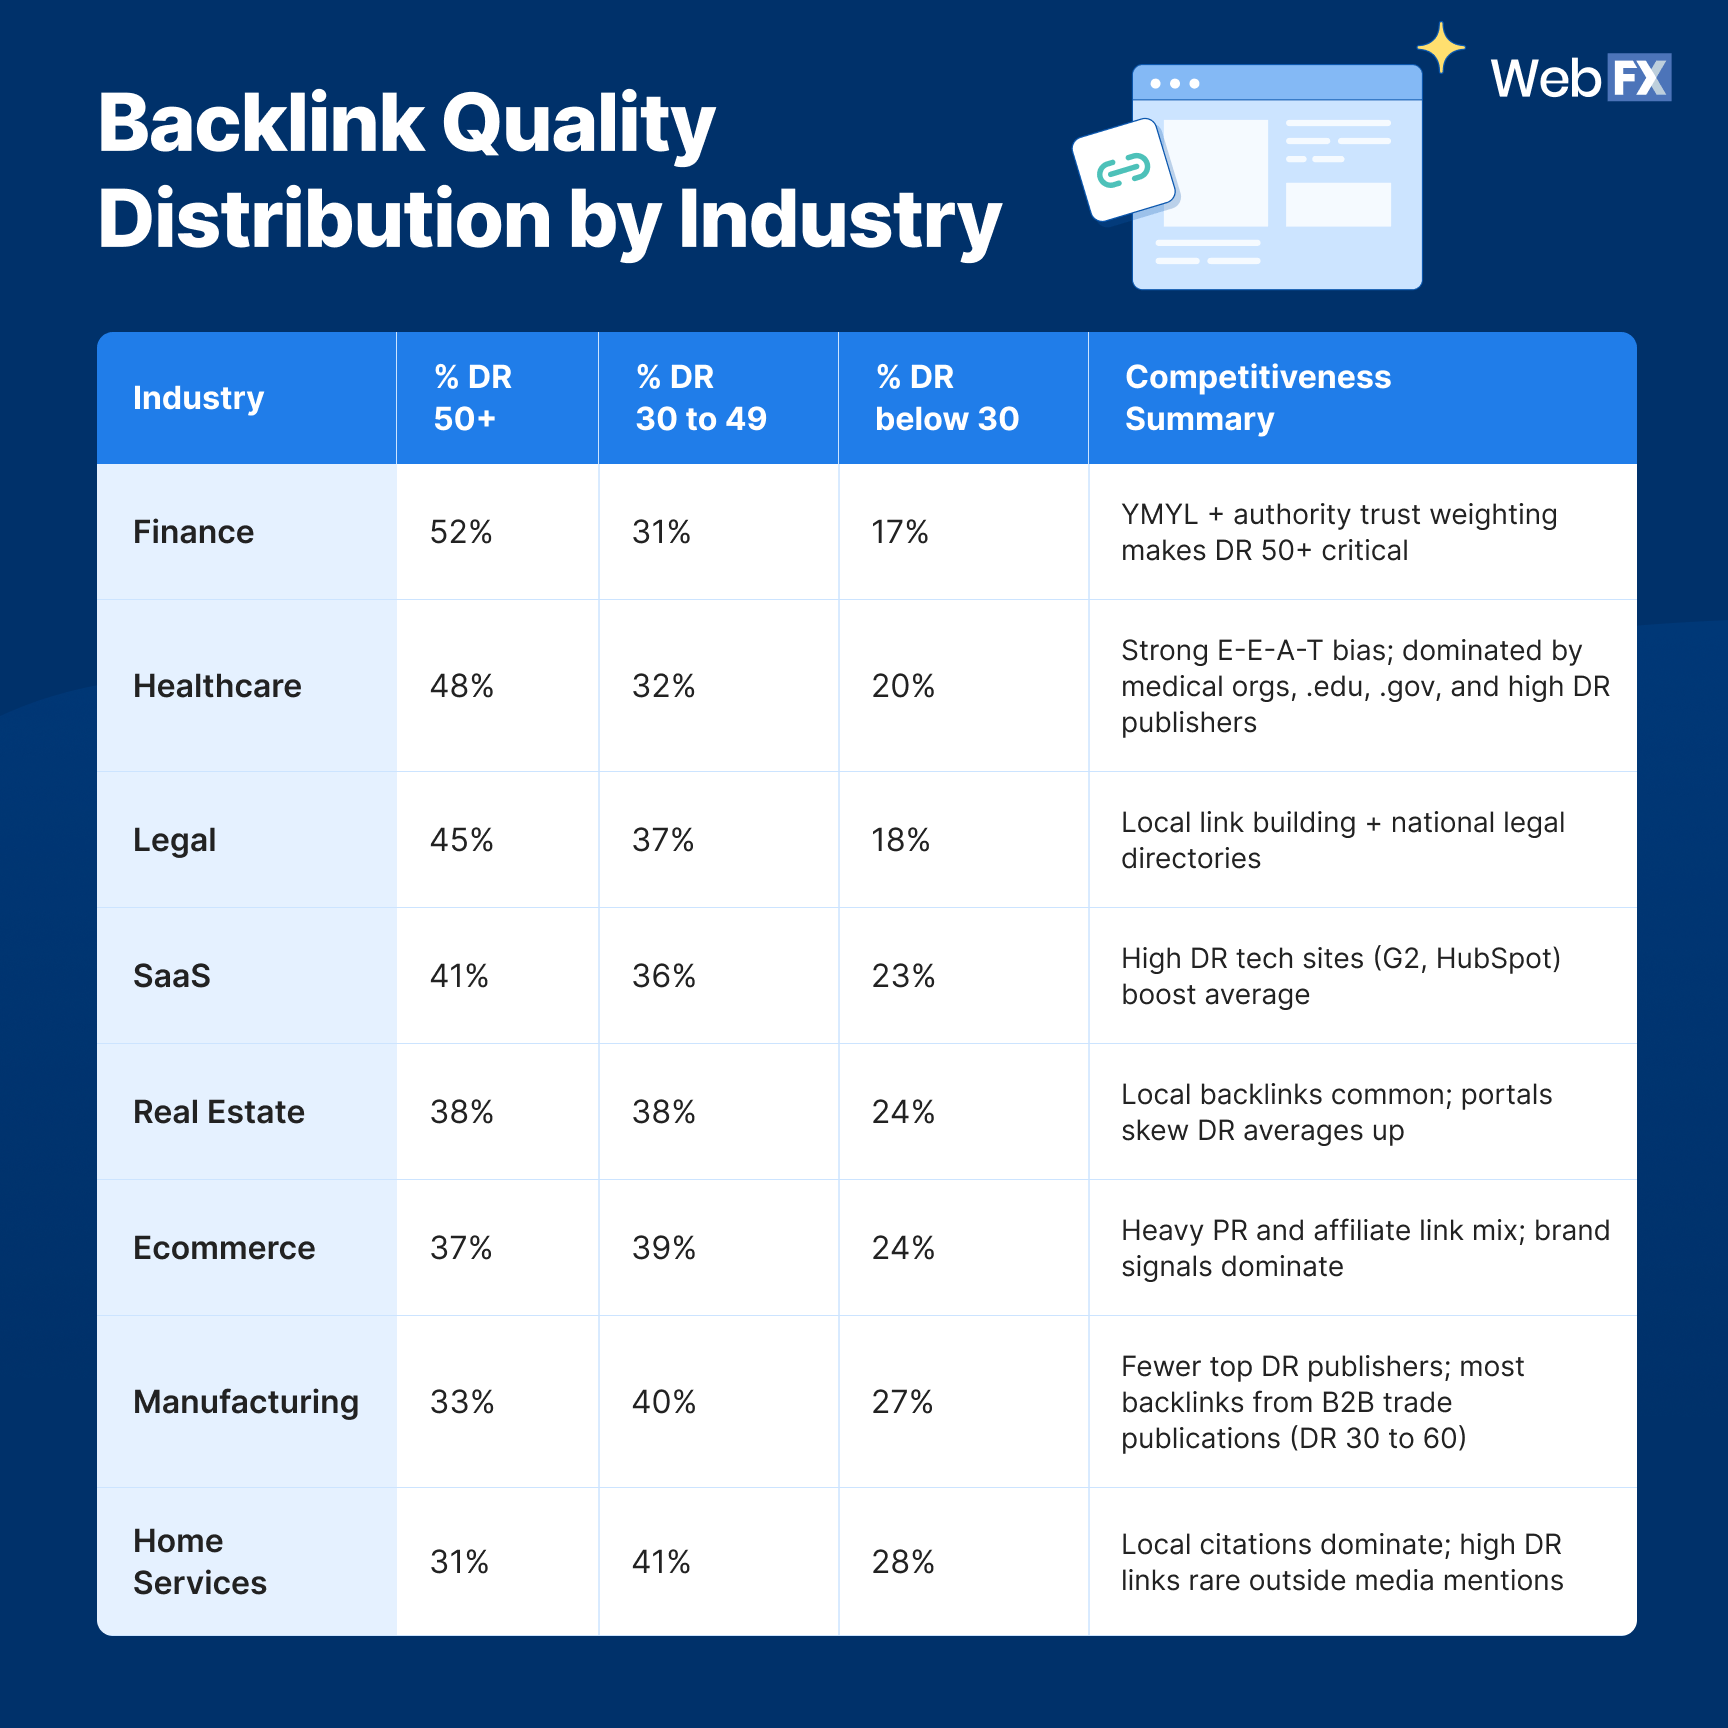
Source data
| Industry | % DR 50+ | % DR 30 to 49 | % DR below 30 | Notes |
| Finance | 52% | 31% | 17% | YMYL + authority trust weighting makes DR 50+ critical |
| Healthcare | 48% | 32% | 20% | Strong E-E-A-T bias; dominated by medical orgs, .edu, .gov, and high DR publishers |
| Legal | 45% | 37% | 18% | Local link building + national legal directories |
| SaaS | 41% | 36% | 23% | High DR tech sites (G2, HubSpot) boost average |
| Real Estate | 38% | 38% | 24% | Local backlinks common; portals skew DR averages up |
| Ecommerce | 37% | 39% | 24% | Heavy PR and affiliate link mix; brand signals dominate |
| Manufacturing | 33% | 40% | 27% | Fewer top DR publishers; most backlinks from B2B trade publications (DR 30 to 60) |
| Home Services | 31% | 41% | 28% | Local citations dominate; high DR links rare outside media mentions |
Quality vs. quantity: what matters more
| Industry | Link Priority |
| Finance | Quality ≫ Quantity |
| Healthcare | Quality ≫ Quantity |
| Legal | Quality > Quantity |
| SaaS | Quality > Quantity |
| Manufacturing | Quality > Quantity |
| Home Services | Quality > Quantity (local relevance key) |
| Real Estate | Balanced (local + authoritative) |
| Ecommerce | Balanced |
For YMYL industries, a single high-DR link from a trusted source often outweighs dozens of low-quality links. For local and ecommerce verticals, a balanced mix of authority and relevance tends to perform best.
What the data tells us
- YMYL industries require 2 to 3x more referring domains. Finance (600 RDs for position 1) and legal (500 RDs) demand significantly more backlink investment than B2B niches like manufacturing (150 RDs).
- Position 1 demands nearly 3x the backlinks of positions 6 to 10. Across industries, the jump from mid-page to top three requires serious link building investment.
- Quality beats quantity in most industries. Only ecommerce and real estate show balanced priority. Everywhere else, relevance and authority outweigh raw link count.
- Top 3 results have 13% more high-DR links than positions 4 to 10. The jump from “ranking” to “winning” often comes down to link quality, not just volume.
How to act on it
- Benchmark your referring domains against industry standards. If you’re in finance with 100 RDs, you know the gap to close. If you’re in manufacturing with 100 RDs, you might already be competitive.
- Prioritize high-DR link acquisition for YMYL verticals. In healthcare, finance, and legal, focus on earning links from authoritative publishers, .edu, .gov, and industry-leading sites.
- Audit your backlink quality distribution. If more than 50% of your links come from DR below 30 sites, prioritize quality over quantity in your next campaign.
- For local and service businesses, balance authority with local relevance. Citations, local press, and community links can compensate for fewer high-DR national backlinks.
SEO content benchmarks
Content is the foundation of organic visibility. But how long should your pages be? How often should you update them? And how much do you need to publish to see traction? These SEO industry benchmarks cover word count by industry and intent, content freshness patterns, publishing frequency, and engagement metrics that signal whether your content is actually punching above its weight.
Average word count by industry
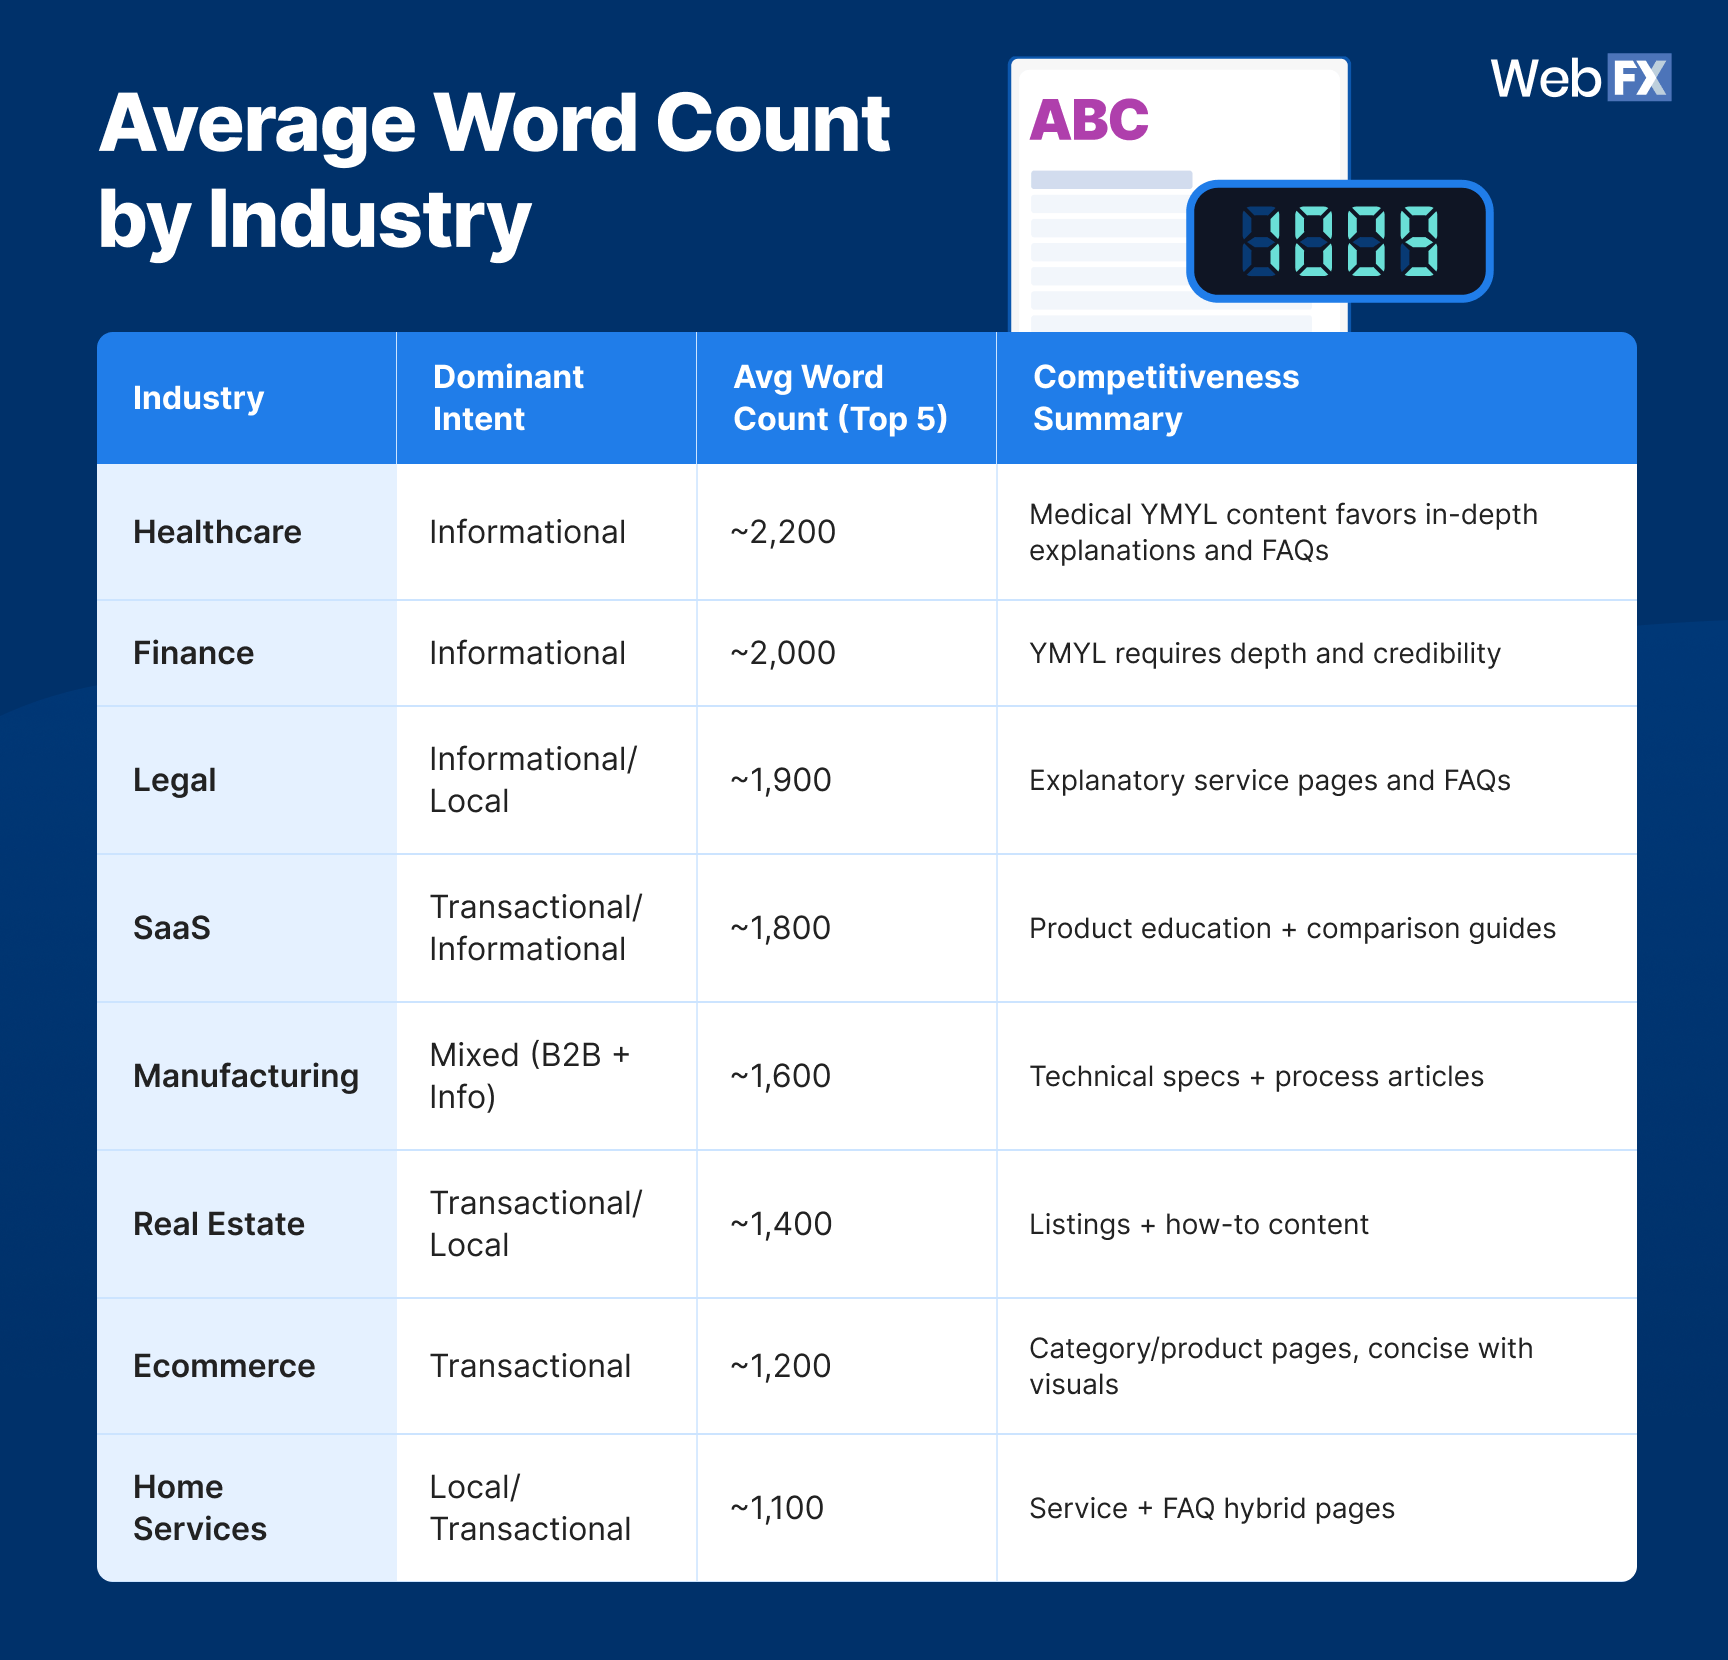
Content depth varies by industry based on dominant search intent and user expectations. Here’s what top-ranking pages look like across verticals:
Source data
| Industry | Dominant Intent | Avg Word Count (Top 5) | Notes |
| Healthcare | Informational | ~2,200 | Medical YMYL content favors in-depth explanations and FAQs |
| Finance | Informational | ~2,000 | YMYL requires depth and credibility |
| Legal | Informational/Local | ~1,900 | Explanatory service pages and FAQs |
| SaaS | Transactional/Informational | ~1,800 | Product education + comparison guides |
| Manufacturing | Mixed (B2B + Info) | ~1,600 | Technical specs + process articles |
| Real Estate | Transactional/Local | ~1,400 | Listings + how-to content |
| Ecommerce | Transactional | ~1,200 | Category/product pages, concise with visuals |
| Home Services | Local/Transactional | ~1,100 | Service + FAQ hybrid pages |
YMYL industries like healthcare and finance require the most content depth. Transactional verticals like ecommerce and home services can rank with shorter, more focused pages.
Word count by search intent
Search intent shapes content length more than industry alone. Here’s how word count breaks down by intent type:
| Intent Type | Avg Word Count | Typical Range | Content Style |
| Informational | 1,900 to 2,400 | 1,200 to 3,000 | Long-form guides, definitions, “what is/how to” articles with structured sections, images, and lists |
| Transactional | 1,000 to 1,500 | 700 to 2,000 | Product or service pages combining marketing copy, FAQs, and comparison sections |
| Navigational | 400 to 800 | 200 to 1,000 | Branded or category-level pages. Less content depth needed. |
Position 1 pages average ~1,750 words. Positions 2 to 5 average ~1,500 words. But word count alone doesn’t cause rankings. It reflects topic completeness. Covering subtopics, FAQs, and structured sections matters more than hitting an arbitrary word target.
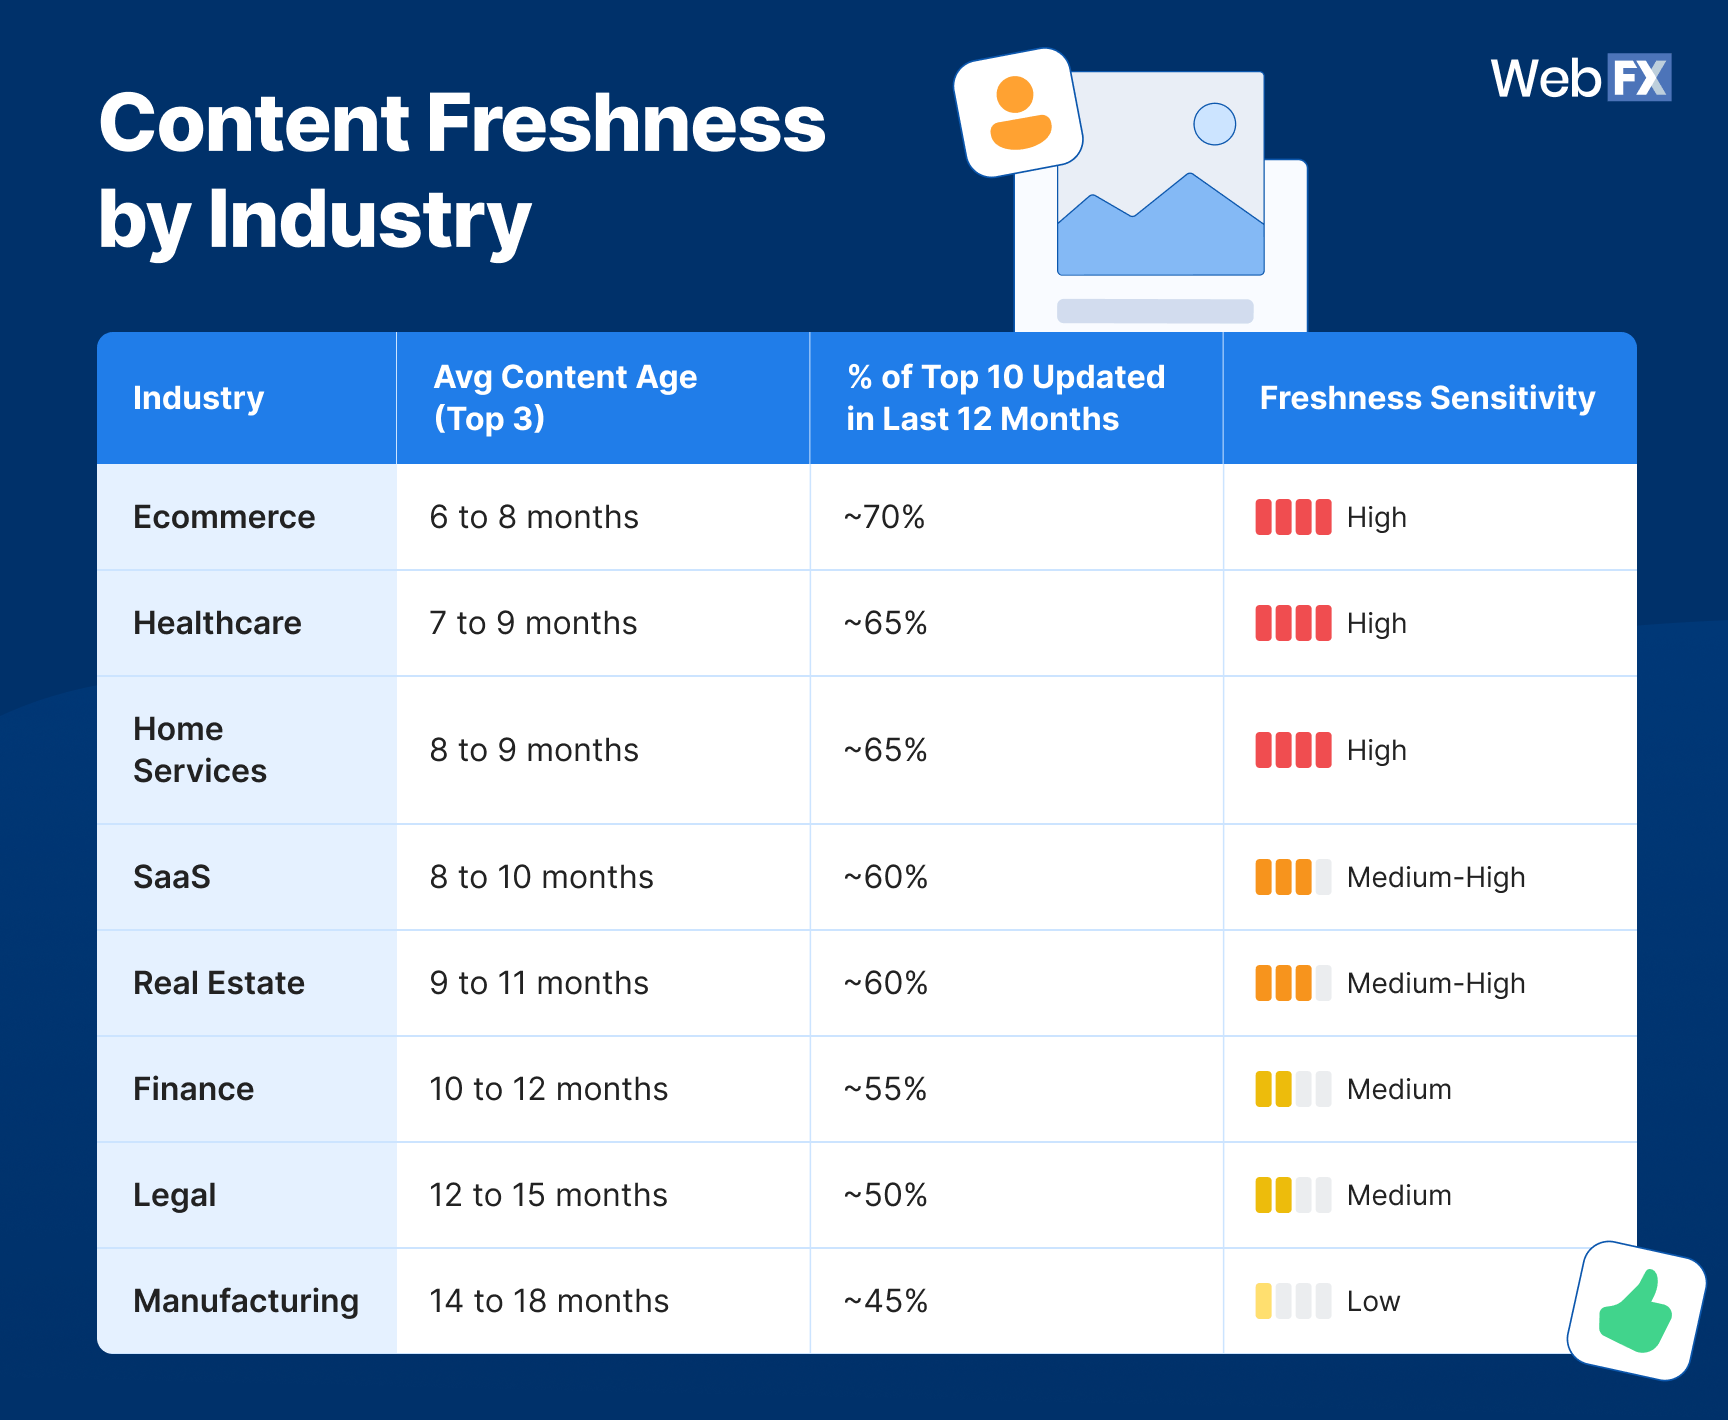
Content freshness by industry
Google rewards fresh content, but how fresh depends on your industry. Here’s how content age breaks down for top-ranking pages:
Source data
| Industry | Avg Content Age (Top 3) | % of Top 10 Updated in Last 12 Months | Freshness Sensitivity |
| Ecommerce | 6 to 8 months | ~70% | High |
| Healthcare | 7 to 9 months | ~65% | High |
| Home Services | 8 to 9 months | ~65% | High |
| SaaS | 8 to 10 months | ~60% | Medium-High |
| Real Estate | 9 to 11 months | ~60% | Medium-High |
| Finance | 10 to 12 months | ~55% | Medium |
| Legal | 12 to 15 months | ~50% | Medium |
| Manufacturing | 14 to 18 months | ~45% | Low |
Top 3 results are nearly 2x fresher than positions 4 to 10 (average content age of ~9.5 months vs. ~18 months). 72% of top 3 pages were updated within the past year.
Recommended refresh frequency by intent
| Intent Type | Avg Age (Top 3) | % Updated in Last 12 Months | Recommended Refresh Frequency |
| Informational | 8 to 10 months | 65% | Every 6 to 9 months |
| Transactional | 9 to 12 months | 55% | Every 9 to 12 months |
| Navigational | 12 to 18 months | 45% | Annually or when brand changes occur |
Evergreen content doesn’t mean untouched. Even stable content benefits from periodic updates with fresh stats, examples, and references.
Content volume and publishing frequency
How much content do you need to see SEO traction? Based on practitioner insights:
| Question | Benchmark | Notes |
| How many pages before you see traction? | 10 to 20 quality posts | No magic number, but a foundational content base helps establish topical authority |
| Publishing frequency (new sites) | 4 to 8 posts per month | Higher velocity helps build momentum, but quality cannot be sacrificed |
| Publishing frequency (mature sites) | 2 to 4 in-depth posts per month | Focus shifts to depth, updates, and topical coverage |
| Content refresh cycle | Every 3 to 6 months for high-traffic pages | At a minimum, annually for evergreen content |
Quantity without quality dilutes authority. A site with 50 thin posts often underperforms a site with 20 comprehensive, well-structured pages.
Engagement benchmarks
Traffic means nothing if users bounce immediately. Here’s what healthy engagement looks like for organic traffic:
| Metric | Excellent | Average | Poor |
| Bounce Rate | 20 to 40% | 40 to 60% | 60%+ |
| Session Duration | 2 to 3+ minutes | 1 to 2 minutes | Below 1 minute |
| Industry | Avg Session Duration |
| Real Estate | ~3:52 |
| Manufacturing | ~3:37 |
| Legal | ~3:02 |
| Ecommerce | ~2:03 |
B2B and YMYL industries like legal and manufacturing see longer session durations because content is more complex and trust-heavy. Ecommerce sessions tend to be shorter as users either convert quickly or leave.
What the data tells us
- YMYL industries require the most content depth. Healthcare (~2,200 words) and finance (~2,000 words) demand comprehensive, well-structured content to compete.
- Top 3 results are nearly 2x fresher than positions 4 to 10. Average content age of ~9.5 months vs. ~18 months shows Google rewards recently updated content.
- 72% of the top 3 pages were updated within the past year. Freshness isn’t optional for competitive rankings. It’s actually expected.
- Comprehensiveness beats length. Word count alone doesn’t cause rankings. Covering subtopics, FAQs, and user questions matters more than hitting an arbitrary number.
How to act on it
- Match your content depth to industry standards. If you’re in healthcare writing 800-word posts, you’re likely underinvesting. If you’re in ecommerce writing 2,500-word product pages, you might be overengineering.
- Refresh high-traffic pages at least once a year. For fast-moving industries like ecommerce and healthcare, aim for every 6 to 9 months.
- Prioritize quality over publishing frequency. 20 comprehensive pages outperform 50 thin ones. Build topical authority through depth, not volume.
- Monitor engagement metrics alongside traffic. High traffic with 70% bounce rate signals a content or intent mismatch. Aim for 40 to 60% bounce rate and 2+ minute session duration.
SEO performance and timeline benchmarks
SEO is a long game, but how long? And what should you actually measure along the way? These SEO benchmarks cover realistic timelines for ranking, the metrics practitioners actually track, common pain points by industry, and the challenges of proving SEO ROI to leadership.
Time to rank expectations
How long does it take to see SEO results? Based on practitioner reports and industry research:
![]()
Source data
| Timeframe | What to Expect | Context |
| 4 to 8 weeks | Quick wins possible | Low-competition keywords, technical fixes, small sites |
| 3 to 6 months | Noticeable improvements | Mid-competition keywords, solid optimization, some link building |
| 6 to 12 months | Stable rankings and traffic | Realistic target for meaningful, sustained results |
| 12 to 18+ months | Competitive verticals | High-competition niches, new sites, or significant SEO debt |
Most practitioners agree: Expect 6 to 12 months before seeing stable results. Very fast wins (weeks) are usually exceptions for low-competition keywords or quick technical fixes, not full-scale SEO campaigns.
Variables that affect ranking speed
| Variable | Impact |
| Existing domain authority / backlink profile | Sites with history and authority rank faster, often within a few months |
| Niche competition and keyword difficulty | High-KD industries like finance and legal take longer (12+ months) |
| Technical health and on-page optimization | Fixing crawl issues and improving page speed can yield quick gains |
| Content quality, relevance, and depth | Comprehensive, well-structured content performs better but still needs time to attract backlinks |
| Ongoing link building and promotion | Sustained effort required for page 1 rankings, not a one-time push |
Time to rank is highly contextual. “Fast” in a low-competition niche might still be “slow” compared to enterprise-level SEO expectations.
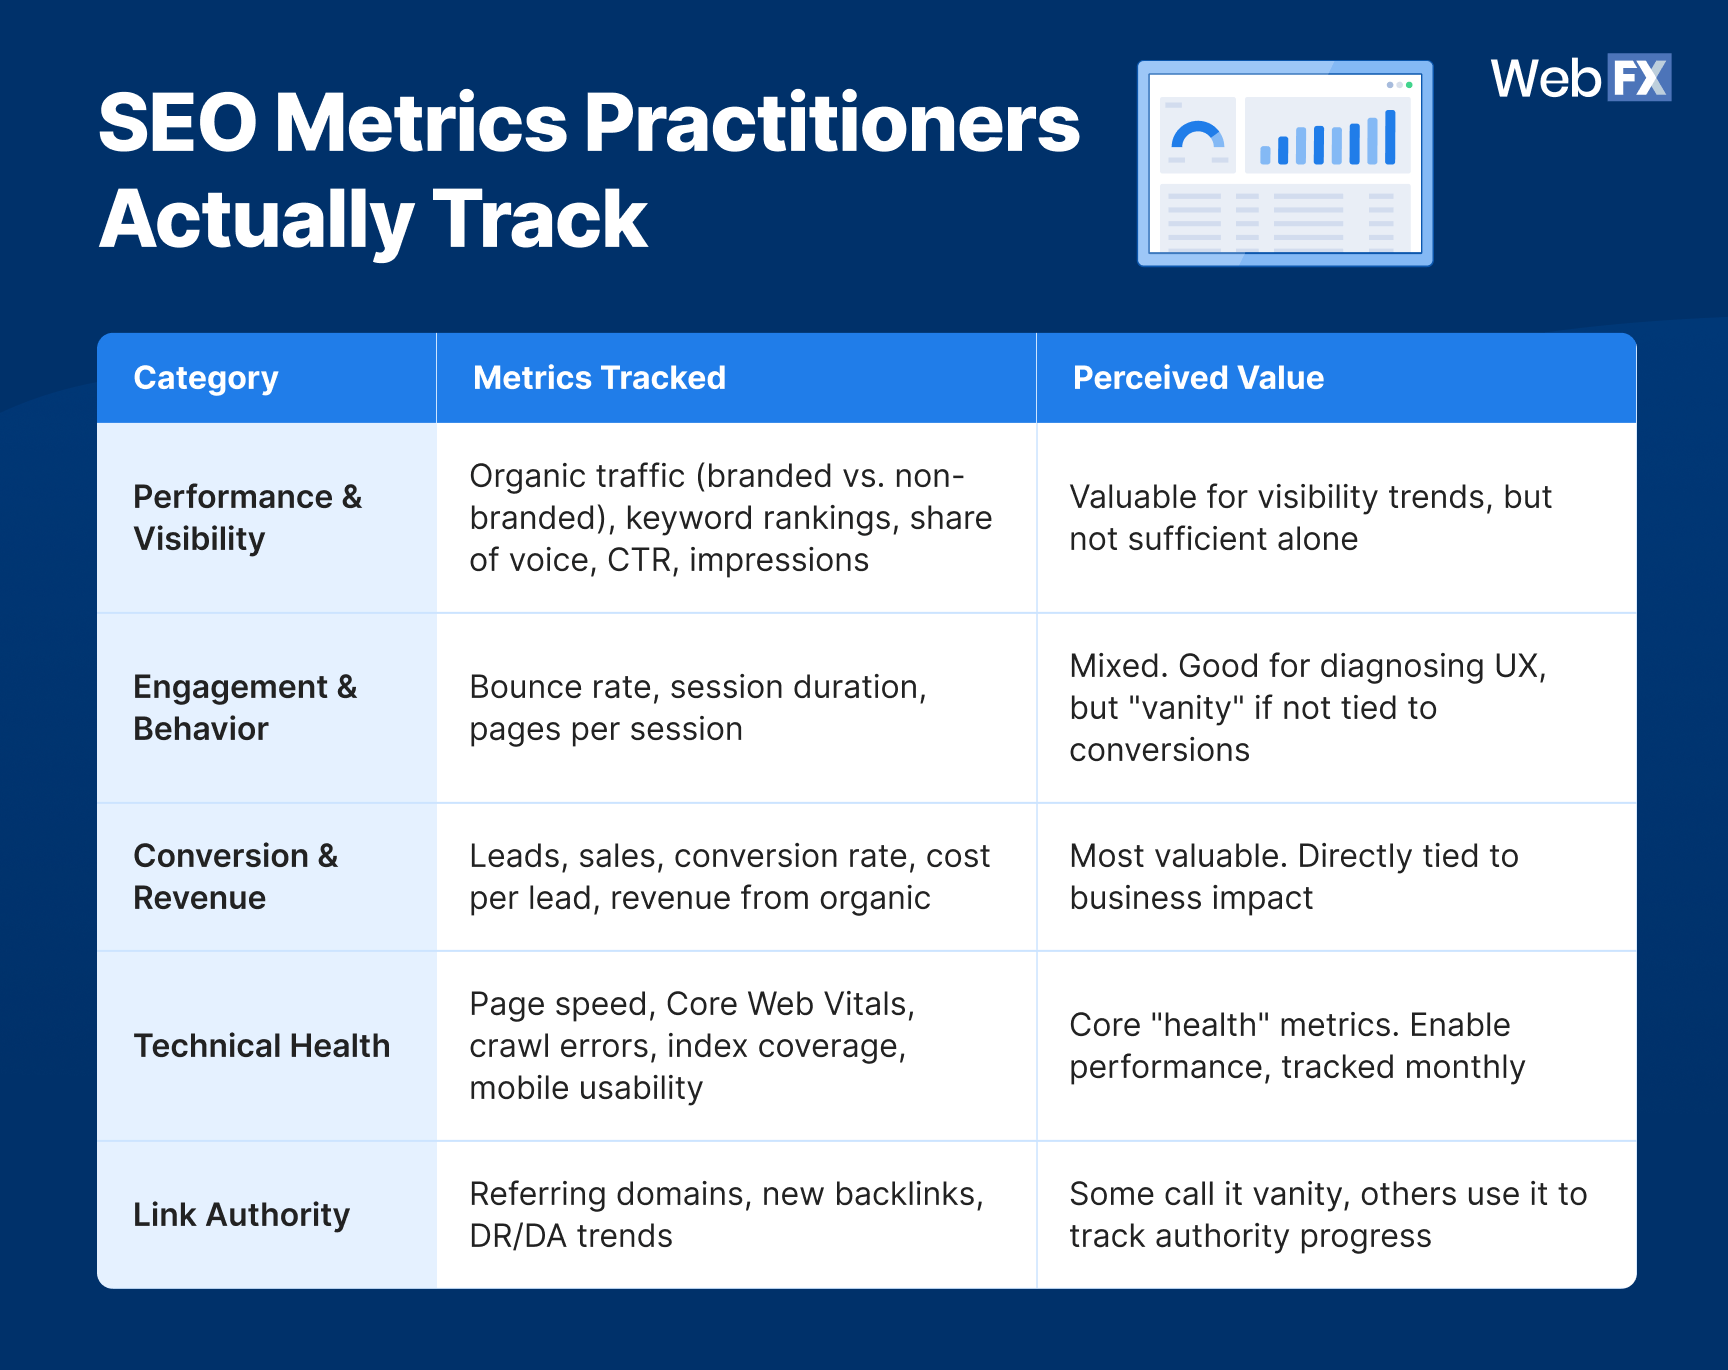
SEO metrics practitioners actually track
Some metrics move the needle. Others just look good in reports. Here’s what SEO practitioners report tracking and how they view each metric’s value:
Source data
| Category | Metrics Tracked | Perceived Value |
| Performance & Visibility | Organic traffic (branded vs. non-branded), keyword rankings, share of voice, CTR, impressions | Valuable for visibility trends, but not sufficient alone |
| Engagement & Behavior | Bounce rate, session duration, pages per session | Mixed. Good for diagnosing UX, but “vanity” if not tied to conversions |
| Conversion & Revenue | Leads, sales, conversion rate, cost per lead, revenue from organic | Most valuable. Directly tied to business impact |
| Technical Health | Page speed, Core Web Vitals, crawl errors, index coverage, mobile usability | Core “health” metrics. Enable performance, tracked monthly |
| Link Authority | Referring domains, new backlinks, DR/DA trends | Some call it vanity, others use it to track authority progress |
The consensus: Business outcomes beat vanity metrics. Practitioners emphasize conversions, leads, revenue, and cost per acquisition over raw rankings or traffic numbers.
Valuable vs. vanity metrics
| Valuable Metrics | Vanity Metrics |
| Conversions from organic (especially non-branded) | Raw keyword rankings (volatile, personalized) |
| Revenue or pipeline attributed to organic | Domain Authority / DR scores (nice to know, not business-impacting) |
| Cost per lead from organic | Traffic spikes without conversion context |
| Non-branded CTR growth | Total backlinks (quantity without quality) |
| Share of voice vs. competitors | Generic “organic growth” charts with no segmentation |
As one practitioner put it: “Traffic and rankings mean nothing if they don’t convert. The best teams report on cost per qualified lead from non-branded organic.”
SEO pain points by industry
What do practitioners struggle with most? Here are the most common SEO challenges across verticals:
| Pain Point | Why It’s Hard |
| Duplicate content and site cannibalization | Google doesn’t know which page to rank; authority gets diluted |
| Technical SEO issues (page speed, crawl errors, JS rendering) | Blocks crawlability and hurts UX. Often easy to fix but frequently ignored |
| Strong competition and saturated SERPs | High-KD industries like SaaS and ecommerce have many players fighting for the same keywords |
| Low conversion despite good traffic | Traffic without conversions signals poor targeting or UX problems |
| Keeping up with algorithm changes | Google updates and evolving SERP features make SEO a moving target |
| Lack of resources and content velocity | Creating and updating quality content consistently is resource-intensive |
| CMS and platform limitations | Technical constraints (meta control, JS issues, indexing) hamper SEO before content or links even come into play |
SaaS and ecommerce teams frequently cite content velocity and competition as top challenges. Local and service businesses struggle more with technical SEO and aggregator dominance (Angi, Thumbtack, Yelp).
SEO buy-in challenges
Proving SEO value to leadership or clients remains one of the hardest parts of the job. Common challenges include:
| Challenge | Why It’s Hard |
| SEO’s impact is slow and cumulative | Rankings may improve before conversions, making attribution tricky |
| Multi-touch customer journeys | Organic is often one of many touchpoints. Last-click attribution undervalues SEO |
| Disconnected data systems | Many organizations lack integrated analytics + CRM + sales tracking |
| Time lag between effort and outcome | SEO work shows results after months, but stakeholders expect quick wins |
| Vanity metrics vs. business metrics | Traffic and rankings look good, but don’t actually prove revenue impact |
Unrealistic stakeholder expectations
| Expectation | Reality |
| Fast results (weeks) | SEO takes 6 to 12 months for stable results |
| Rankings = revenue | Traffic doesn’t guarantee qualified leads or conversions |
| Last-click attribution is enough | Undervalues SEO’s role in early and mid-funnel influence |
| Set-and-forget | SEO requires ongoing investment as competition and algorithms evolve |
The key to buy-in: Frame SEO in business outcomes (leads, revenue, cost per acquisition), not SEO metrics (rankings, traffic, impressions). Stakeholders care about pipeline, not position tracking.
What the data tells us
- Expect 6 to 12 months for stable SEO results. Quick wins are possible for low-competition keywords, but meaningful, sustained results take time.
- Business outcomes matter more than SEO metrics. Practitioners who report on leads, revenue, and cost per acquisition earn more trust than those reporting rankings and traffic.
- Technical debt and content velocity are universal pain points. Regardless of industry, duplicate content, crawl issues, and resource constraints slow SEO progress.
- Attribution remains the hardest part of proving SEO ROI. Multi-touch journeys and disconnected data systems mean SEO often goes uncredited.
How to act on it
- Set realistic timeline expectations upfront. Tell stakeholders to expect 6 to 12 months before stable results. Manage expectations early to avoid budget cuts at month three.
- Report on business outcomes, not vanity metrics. Frame SEO performance in terms of leads, revenue, and cost per acquisition. Save ranking reports for internal tracking.
- Audit for technical debt before scaling content. Fix crawl errors, page speed, and indexing issues first. Technical health enables everything else.
- Implement closed-loop tracking. Connect organic traffic to CRM and sales data so SEO gets credit for pipeline and revenue, not just clicks.
How to use SEO benchmarks to improve ROI
SEO benchmarks are only valuable if you act on them. This section covers how to turn the data above into a practical action plan that drives results and proves value to leadership.
1. Audit your current performance against industry standards
Start by mapping your metrics to the SEO benchmarks in this guide. Identify where you’re ahead, where you’re behind, and where the gaps are costing you traffic or conversions.
Key questions to answer:
- How does your keyword difficulty compare to your industry average?
- Are your referring domains competitive for the positions you’re targeting?
- Is your content depth and freshness aligned with top performers?
- What percentage of your target keywords trigger AI Overviews?
If you’re in finance with 80 referring domains targeting position 1 keywords, the benchmark (600 RDs) tells you exactly how big the gap is.
2. Prioritize high-impact gaps first
Not all gaps are worth closing. Focus your SEO efforts on the ones that will move revenue, not just rankings.
| High Impact | Lower Impact |
| Backlink gaps for high-converting keywords | Backlink gaps for low-traffic informational pages |
| Content depth issues on BOFU pages | Word count on navigational pages |
| Technical issues blocking crawlability | Minor Core Web Vitals improvements |
| Freshness updates on the top 10 revenue-driving pages | Refreshing low-traffic blog posts |
Prioritize gaps that affect pages tied to leads, sales, or pipeline. A 50-position improvement on a page that doesn’t convert is worth less than a 3-position improvement on a page that does.
3. Set realistic timelines and milestones
Use the timeline benchmarks to set expectations internally:
| Milestone | Realistic Timeframe |
| Technical fixes and quick wins | 4 to 8 weeks |
| Noticeable ranking and traffic improvements | 3 to 6 months |
| Stable rankings and measurable ROI | 6 to 12 months |
| Competitive positioning in high-KD verticals | 12 to 18+ months |
Build these timelines into your reporting cadence. If leadership expects results in 60 days, reset that expectation early with data from this guide.
4. Track business outcomes, not vanity metrics
SEO benchmarking helps you measure progress, but the metrics you report to leadership should tie directly to revenue.
| Report to Leadership | Keep for Internal Tracking |
| Leads and conversions from organic | Keyword rankings |
| Revenue attributed to organic traffic | Impressions and clicks |
| Cost per lead vs. other channels | Domain Rating changes |
| Non-branded organic traffic growth | Total backlinks acquired |
Stakeholders care about pipeline and SEO ROI. Save the ranking screenshots for your internal Slack channel.
5. Build a content refresh calendar
Use the freshness benchmarks to schedule regular updates:
| Content Type | Refresh Frequency |
| High-traffic pages in fast-moving industries (ecommerce, healthcare, SaaS) | Every 6 to 9 months |
| Informational content targeting competitive keywords | Every 9 to 12 months |
| Evergreen content in stable industries (legal, manufacturing) | Annually |
Add “last updated” dates to your pages. Google and users both reward visible content freshness signals.
6. Monitor AI Overview exposure
Google’s AI Overviews are reshaping organic visibility. Track which of your target keywords trigger AI answers and adjust your strategy accordingly.
Action steps:
- Use tools like SEO.com’s free AI Overview checker to audit your keyword portfolio
- Identify high-value keywords where AI Overviews dominate and consider alternative content formats (video, tools, transactional pages)
- Double down on queries with low AI Overview rates where traditional rankings still drive clicks
If 65% of your informational keywords trigger AI Overviews, it’s time to rethink your content mix.
7. Use benchmarks to secure buy-in and budget
SEO industry benchmarks give you the data to make the case for more resources. Instead of “we need more content,” you can say:
- “Our competitors average 350 referring domains. We have 120. Closing that gap requires investment in link building.”
- “Top-ranking pages in our industry average 2,000 words. Our key pages average 900. We need content depth improvements.”
- “72% of top 3 results were updated in the last 12 months. Half of our top pages haven’t been touched in two years.”
Data beats opinions. SEO benchmarking turns budget conversations from debates into decisions.
FAQs about 2026 SEO benchmarks
What is SEO benchmarking?
SEO benchmarking is the process of comparing your website’s search performance against industry standards, competitors, or your own historical data. It helps you understand whether your rankings, traffic, backlinks, and content are competitive or falling behind.
What are the most important SEO benchmarks to track?
The most important SEO benchmarks depend on your goals, but most practitioners focus on:
- Keyword difficulty by industry to assess competition
- Referring domains needed to rank for target positions
- Content depth and freshness compared to top-ranking pages
- Organic CTR by SERP position
- AI Overview exposure for your target keywords
- Conversion rate and cost per lead from organic traffic
Track visibility metrics for progress, but report business outcomes (leads, revenue, cost per acquisition) to leadership.
How long does SEO take to show results?
Most practitioners report:
- 4 to 8 weeks for quick wins (low-competition keywords, technical fixes)
- 3 to 6 months for noticeable improvements in rankings and traffic
- 6 to 12 months for stable, sustainable results
- 12 to 18+ months for competitive industries like finance, legal, and healthcare
SEO is a long-term investment. Set expectations early to avoid frustration at month three.
How many backlinks do I need to rank on page 1?
It depends on your industry and target position. Based on aggregated Ahrefs data:
| Industry | Avg RDs for Position 1 |
| Finance | 600 |
| Legal | 500 |
| Healthcare | 420 |
| Real Estate | 380 |
| Ecommerce | 350 |
| SaaS | 270 |
| Home Services | 250 |
| Manufacturing | 150 |
Cross-industry average: ~365 referring domains for position 1, ~235 for positions 2 to 5, and ~125 for positions 6 to 10.
Quality matters as much as quantity. In YMYL industries, a single high-DR link from a trusted source often outweighs dozens of low-quality links.
What’s a good bounce rate for SEO?
General benchmarks for organic traffic:
| Rating | Bounce Rate |
| Excellent | 20 to 40% |
| Average | 40 to 60% |
| Poor | 60%+ |
Bounce rate varies by industry and intent. Blog posts typically see higher bounce rates (65 to 80%) than service pages. A “high” bounce rate isn’t always bad if users find what they need quickly.
What’s a good organic CTR?
Organic click-through rate (CTR) depends heavily on SERP position:
| Position | Avg Organic CTR |
| Position 1 | ~27.6% |
| Position 2 | ~15 to 18% |
| Position 3 | ~10 to 12% |
| Positions 4 to 10 | Single digits (steep drop-off) |
CTR also depends on SERP features. Keywords with AI Overviews, featured snippets, or heavy ad presence typically see lower organic CTR.
How often should I update my content for SEO?
Based on content freshness benchmarks:
| Content Type | Recommended Refresh Frequency |
| High-traffic pages in fast-moving industries (ecommerce, healthcare, SaaS) | Every 6 to 9 months |
| Informational content targeting competitive keywords | Every 9 to 12 months |
| Evergreen content in stable industries (legal, manufacturing) | Annually |
72% of top 3 results were updated within the past year. Add visible “last updated” dates to signal freshness to both Google and users.
How do AI Overviews affect SEO?
AI Overviews now appear in 25.8% of US searches, with rates climbing to:
- 51.6% for health-related queries
- 54.7% for queries with 7+ words
- 65.9% for long informational queries
AI Overviews can reduce organic CTR by answering queries directly in the SERP. To adapt:
- Track which of your keywords trigger AI Overviews
- Diversify into transactional content, video, or interactive tools that AI can’t easily summarize
- Focus on queries with low AI Overview rates where traditional rankings still drive clicks
How do I prove SEO ROI to leadership?
The key is framing SEO in business outcomes, not SEO metrics. Report on:
- Leads and conversions from organic (especially non-branded)
- Revenue or pipeline attributed to organic traffic
- Cost per lead compared to paid channels
- Non-branded organic traffic growth over time
Avoid leading with rankings, impressions, or Domain Rating. Stakeholders care about pipeline and revenue, not position tracking.
Use benchmarks to make the case: “Our competitors average 350 referring domains. We have 120. Closing that gap requires investment.”
Independent research from Clutch has named WebFX the top SEO company in the United States.
Clutch has personally interviewed more than 250 WebFX clients to discuss their experience partnering with us.
Benchmark and break through with a proven SEO partner
You’ve seen the numbers. You know where the benchmarks stand. The question now is: How does your site compare?
If the gaps feel overwhelming, you’re not alone. Most businesses don’t have the time, tools, or team to audit their SEO performance against industry standards, build a data-driven action plan, and execute it consistently.
That’s what WebFX does best.
With 30 years of digital expertise and more than 750 in-house experts, we’ve generated over $10 billion in revenue for our clients. We don’t just hit SEO benchmarks. We exceed them.
SEO goals are good, but hitting them is better. Contact us online or call 888-601-5359 to speak with a strategist today about our high-impact SEO services. Let’s turn those benchmarks into bragging rights.
Data sources & methodology
The benchmarks in this guide are pulled from proprietary WebFX data and third-party intelligence, including:
Proprietary research
- WebFX AI Overview Study (2025): 2.37 million US keywords analyzed for AI Overview rates by industry, query length, and search intent.
Third-party research
- Ahrefs Ranking Factor Studies (2018 to 2025): Keyword difficulty, referring domains, backlink quality, content length, and freshness patterns.
- Backlinko (2022 to 2024): Organic CTR by SERP position.
- First Page Sage, Adilo, HulkApps (2024 to 2025): Engagement and session duration benchmarks.
Practitioner insights
- Reddit (r/SEO, r/bigseo): Time to rank expectations, metrics practitioners track, and common pain points (2023 to 2025 discussions).
A few notes: Some benchmarks are modeled estimates based on aggregated research. AI Overview data reflects US search results. SEO benchmarks evolve as Google updates its algorithms, so we recommend revisiting annually.
-
 Albert Dandy Velasquez blends SEO strategy with compelling storytelling to help businesses boost their visibility and revenue online. With a B.A. in English and certifications from HubSpot, Semrush, and Google Analytics, he has written and optimized hundreds of articles on organic SEO, content strategy, and user experience. He regularly contributes to the WebFX blog and SEO.com, creating content that helps readers turn marketing goals into measurable results. When he’s off the clock, he’s usually exploring new neighborhoods on two wheels, filming travel content, or chasing golden hour with a coffee in hand.
 -

WebFX is a full-service marketing agency with 1,100+ client reviews and a 4.9-star rating on Clutch! Find out how our expert team and revenue-accelerating tech can drive results for you! Learn more
Try our free Marketing Calculator
Craft a tailored online marketing strategy! Utilize our free Internet marketing calculator for a custom plan based on your location, reach, timeframe, and budget.
Plan Your Marketing Budget
Table of Contents
- What is SEO benchmarking?
- 2026 SEO benchmarks (and how you compare)
- SEO visibility and ranking benchmarks
- SEO authority and backlink benchmarks
- SEO content benchmarks
- SEO performance and timeline benchmarks
- How to use SEO benchmarks to improve ROI
- 1. Audit your current performance against industry standards
- 2. Prioritize high-impact gaps first
- 3. Set realistic timelines and milestones
- 4. Track business outcomes, not vanity metrics
- 5. Build a content refresh calendar
- 6. Monitor AI Overview exposure
- 7. Use benchmarks to secure buy-in and budget
- FAQs about 2026 SEO benchmarks
- Benchmark and break through with a proven SEO partner
- Data sources & methodology
Share this article

SEO Success with KOA

Try our free Marketing Calculator
Craft a tailored online marketing strategy! Utilize our free Internet marketing calculator for a custom plan based on your location, reach, timeframe, and budget.
Plan Your Marketing Budget