60+ Tourism and Hospitality Statistics to Know for 2026
Understanding tourism and hospitality can help marketers and industry professionals alike offer better customer experiences. Explore over 60 tourism and hospitality stats including general, domestic and international tourism, as well as online marketing trends for the industry.
-
 insights from 38,900+ hours of hospitality marketing experience

On this page, we’ve gathered over 60 tourism and hospitality statistics that provide insight into industry trends and changes. Skip ahead to what stats you want to see:
- General statistics on tourism
- Domestic tourism stats
- International tourism statistics
- Hospitality statistics
- Online marketing for tourism stats
Keep reading for more tourism stats for 2026!
General statistics on tourism
First on this list of tourism stats, we’ll cover some general statistics about the tourism industry, including its economic impact, what influences people to travel, and more.
Let’s dive in!
- 1 In 20 jobs depend on the travel and tourism industry.
- $916 billion is how much revenue the travel and tourism industry is expected to generate by the end of 2024.
- $1.1 billion is how much revenue the industry is expected to generate by 2029.
- $5.8 trillion is how much the travel and tourism sector adds to the global economy.
- 40.6 million flights happened in 2024.
- Air travel numbers are expected to reach 4 billion passengers by 2024.
- Over 270 million is how many people the tourism industry employed in 2024.
- $4500 is the average cost of a trip for a family of four.
- 88% of travelers want to go on a nostalgic getaway trip.
- 80% of Americans notice a significant drop in stress after traveling.
- 78% of millennials would rather spend money on experiences.
- 74% of travelers are willing to pay for sustainable trips.
- 73% of people aged 55 or older experience health benefits from traveling, including more energy and increased productivity.
- 72% of people ages 18-30 are more willing to spend money on traveling.
- 70% of Millennials and Gen Z travelers seek out experiences people in their life haven’t discovered or heard of.
- 68% of people said they feel more positive after taking a vacation.
- 61% of travelers plan to map out their travels ahead of time to get a better deal.
- 60% of business trips are extended for personal vacation time.
- 60% of people are more flexible about when and where they travel.
- 55% of travelers want to book a trip to “escape reality.”
- 51% of U.S. travelers are women.
- 50% of people won’t pay more for free airfare cancellation options.
- Over 50% of English-speaking travelers also speak Spanish.
- 46% of female travelers are concerned about their safety when traveling solo.
- 44% of American vacation budgets are spent traveling to and from their destination.
- 40% of people ages 18-33 choose a vacation spot based on how “Instagrammable” the location is.
- 38% of solo travelers spend $1000 to $2000 for their trips.
- 1% is how much the average airfare cost rose in 2025 compared to 2024.
- 31% of travelers plan a vacation six or more months in advance.
- 26% of people plan to book a vacation three to six months in advance.
- 20% of travelers agree that cultural activities are a priority when traveling.
- 17% of travelers in the U.S. have a travel-related subscription.
- 10% of travelers want pet-friendly vacations.
- 13% is how much travel spending increased in 2024.
Domestic tourism statistics
Next on this list of travel and tourism statistics, let’s look at stats related to domestic tourism within the United States.
Here are some insights into domestic travel:
- Food is the biggest expense for domestic travelers.
- 60 days is how far in advance travelers book domestic travel.
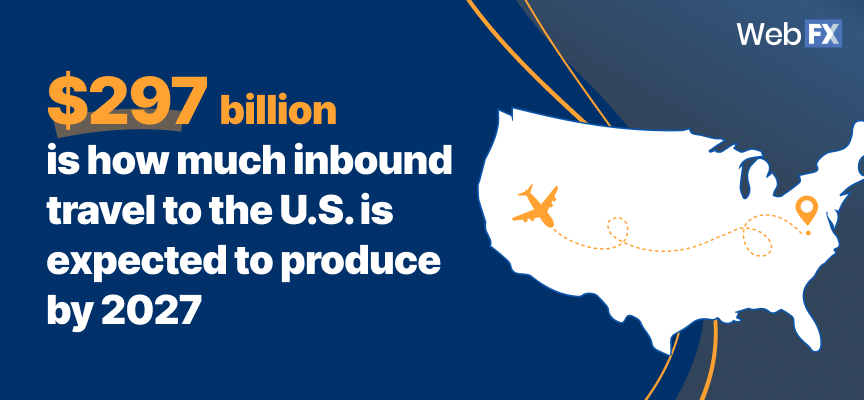
- $297 billion is how much inbound travel to the U.S. is expected to produce by 2027.
- 84% of U.S. travelers are 40 or older.
- 75% of American travelers prioritize seeing new places when traveling.
- 70% of American travelers deem cleanliness a top factor when finding a place to stay.
- 51% of Americans take trips to rest and relax.
International tourism statistics
Another aspect of tourism is international traveling. Here are some tourism statistics on international travel:
- The United States, Chinese, and German tourism industries contribute the most to the overall GDP.
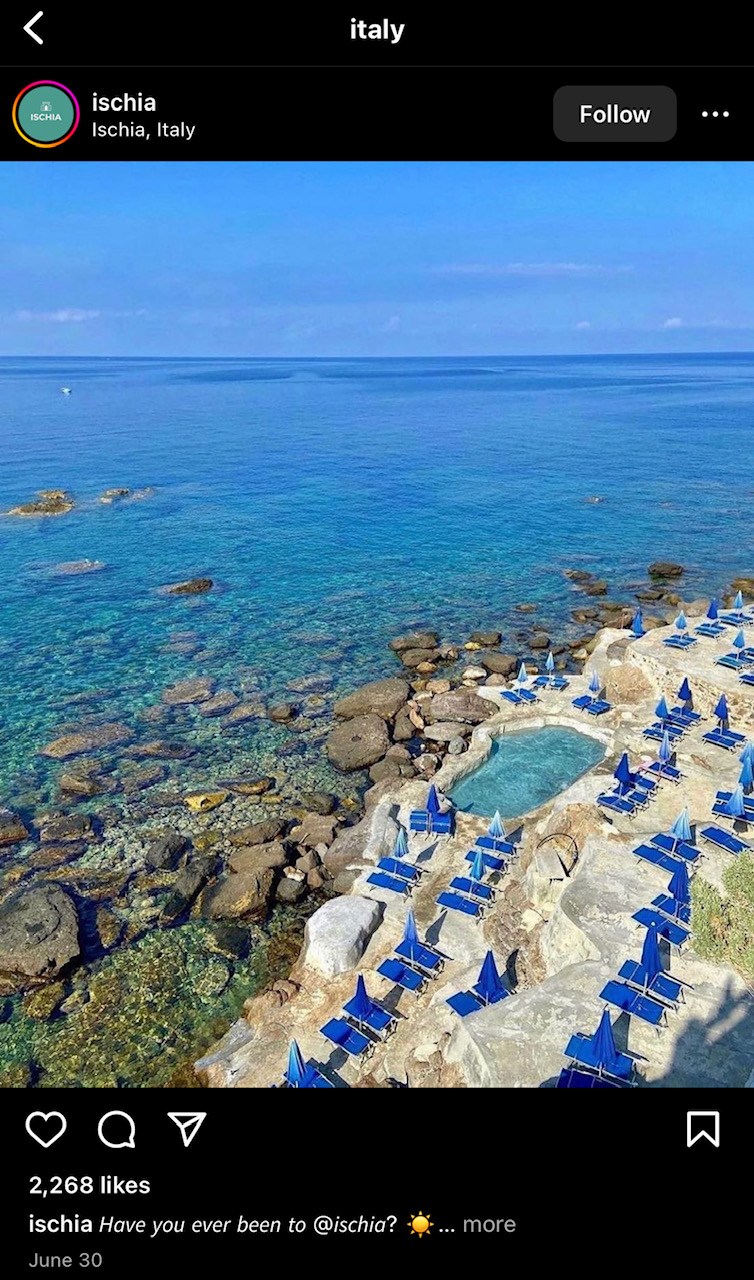
- Italy is one of the most-desired travel destinations.
- Thailand, Türkiye, and United Kingdom were the most popular travel destinations for international tourists in 2024.
- 90 days is how far in advance travelers book international travel.
- International travel spending is set to reach $198 billion in the U.S. by 2025.
- 51% of global travelers say culture and language immersion matter when traveling.
- 17% of all global travelers are solo travelers.
Hospitality statistics
When traveling domestically or internationally, people will book a place to stay. Here are a few quick hospitality statistics for you’ll want to know:
- There are over 187,000 hotels worldwide.
- 64% is the average U.S. hotel occupancy rate.
- 60% of people who travel internationally will pay for lodging.
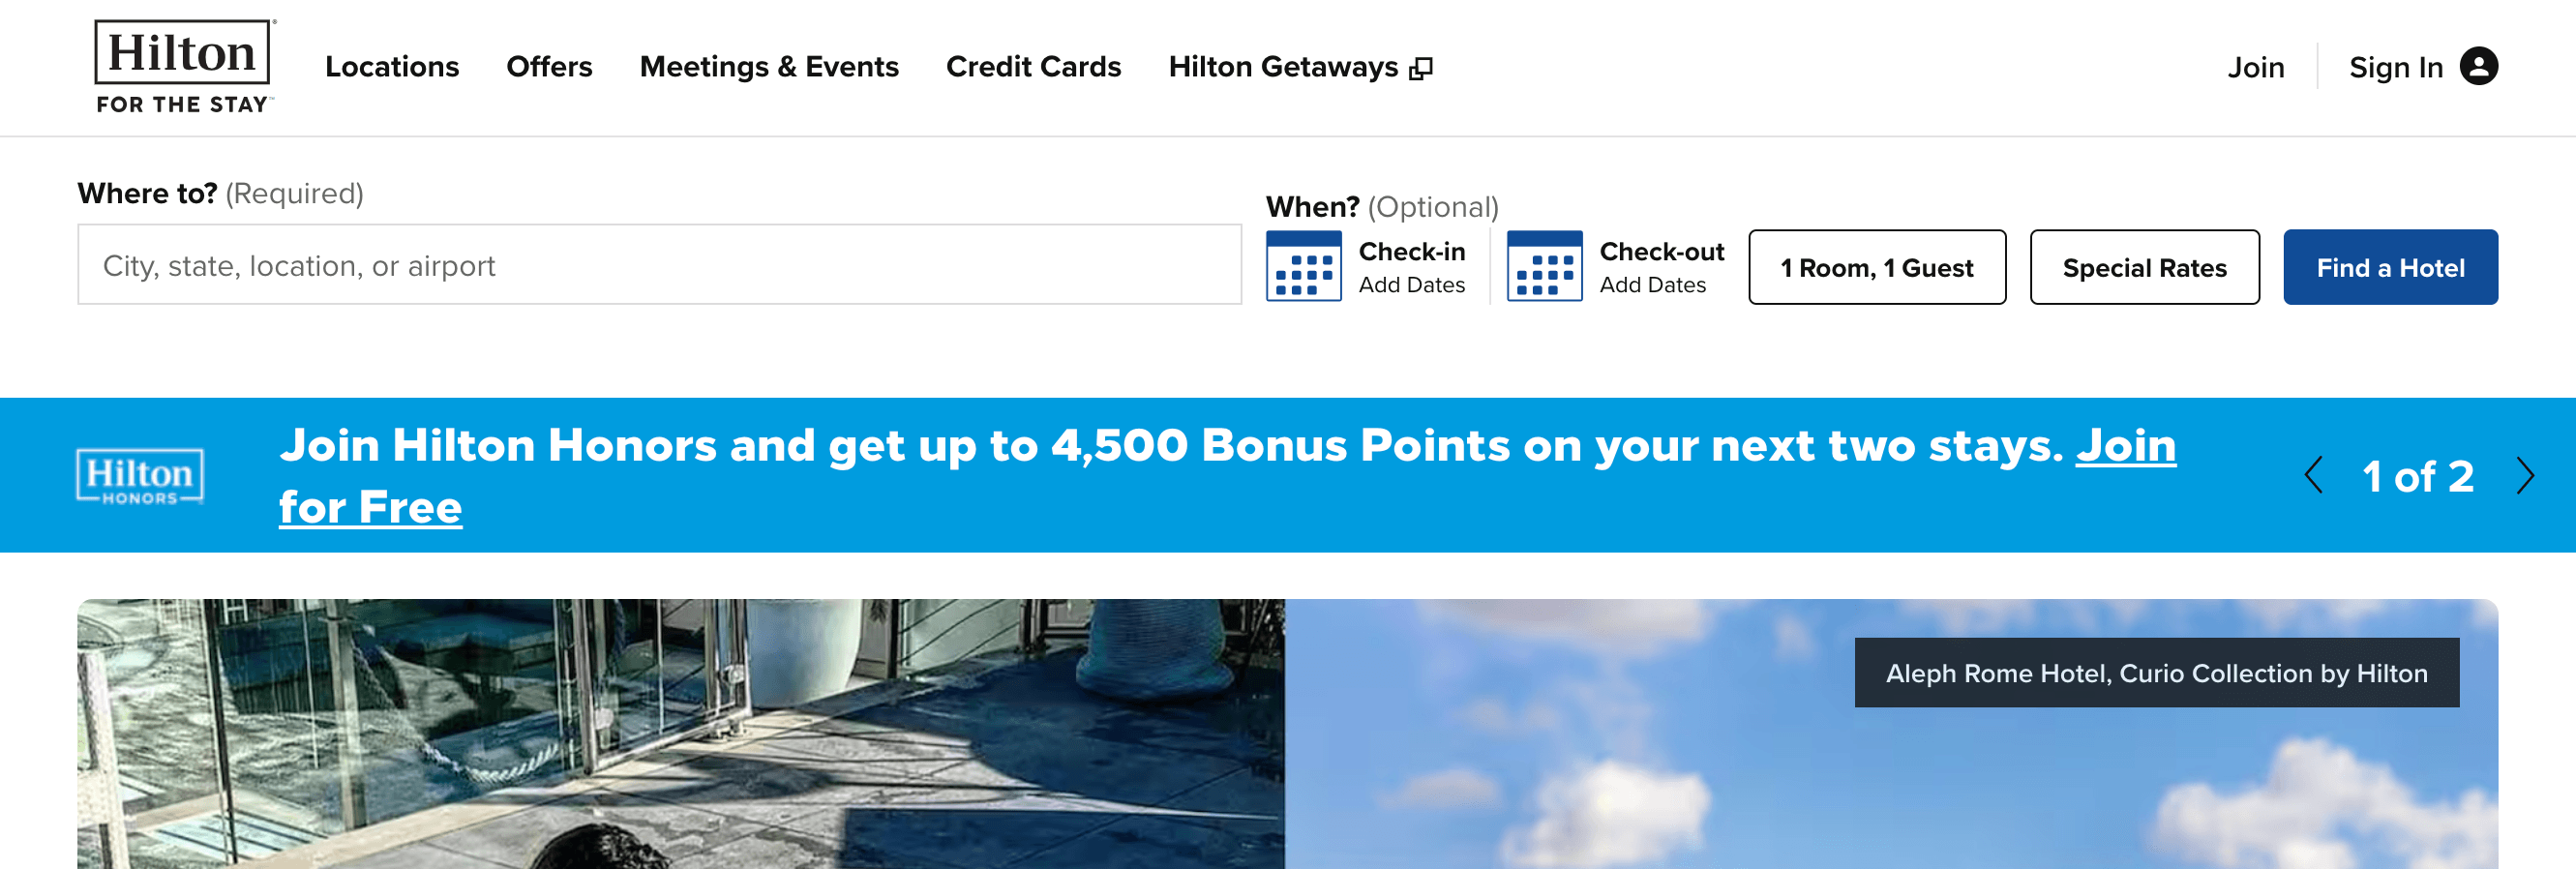
- 49% of Americans stay at a hotel chain when traveling.
- 19% is the growth rate of the hotel industry.
Tourism and hospitality statistics: Online marketing
To get people to visit your destination or stay at your hotel, you must market your place. Online marketing is crucial for helping new people discover your destination. Here are some stats on tourism marketing:
- 86% of travelers consult online travel sources before booking a trip.
- 83% of travelers research on a mobile device before finishing their traveling plans.
- 81% of travelers read reviews before booking their accommodations.
- 73% of people use review sites to find the right destination.
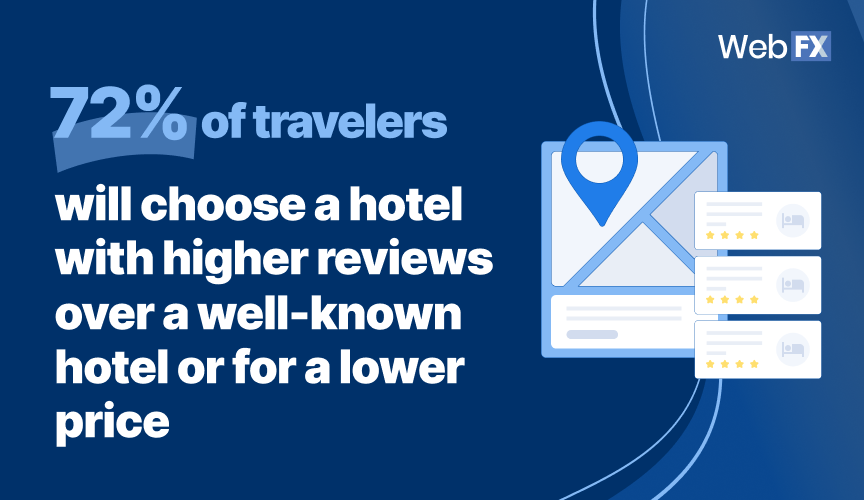
- 72% of travelers will choose a hotel with higher reviews over a well-known hotel or for a lower price.
- Online sales will account for 75% of all sales in tourism were made online by 2029.
- 48% of hotel guests write a review after a negative experience.
- 40% of hotel guests leave reviews after a positive experience.
- 40% of U.S. hotels are independent.
- 39% of users would rather download a traveling app over using a company’s website because of the speed.
- 36% of people use social media to find the right destination.
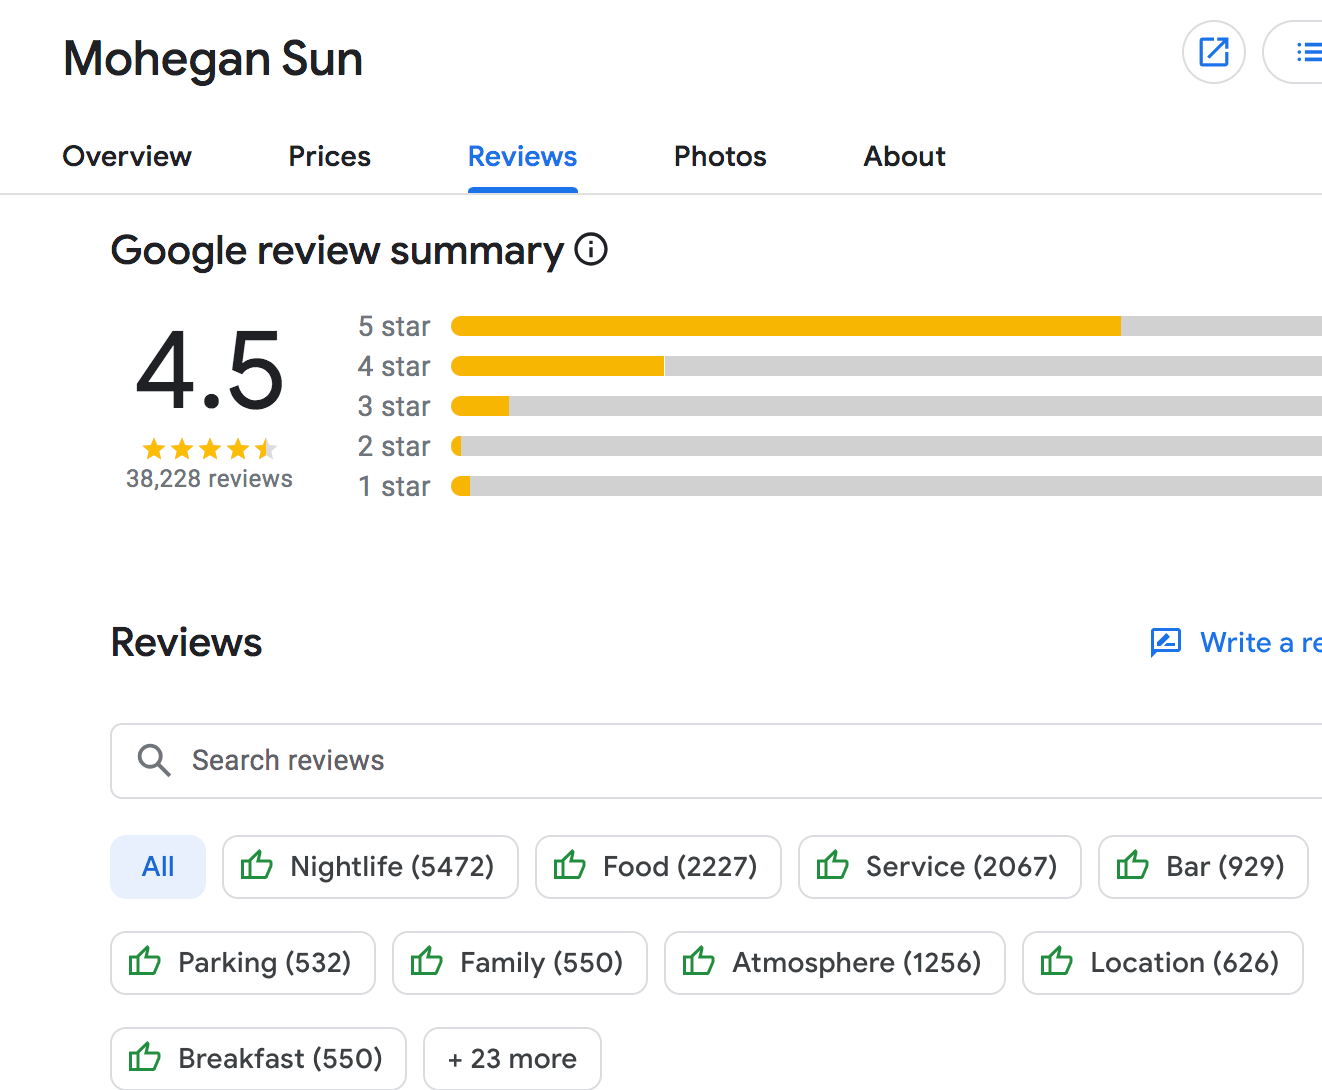
- Guests will pay 35% more for a hotel with a score of 4.4 compared to a 3.9.
Get more insights for marketing your tourist destination
Now that you have insight into how people perceive tourism and what motivates them to travel, it’s time to start marketing your destination to people looking to take a trip.
If you want the latest tips and tricks for marketing your tourist spot online, subscribe to our email newsletter!
We Drive Results for Tourism Agencies
- Dedicated account manager backed by 750+ digital experts
- Renowned for our communication and transparency


Solving key challenges for tourism
We’re not driving enough traffic to our website
Our SEO and web design services help increase your website’s ranking in the search results when people search for your travel services or vacation spots, so you can enjoy more web traffic and sales.

We’re expanding
Set your new hotel or location package up for future success with compelling web pages and marketing messages that get your new location in front of your audience where they spend their time.

We’re not selling enough of our packages
Not selling enough of your trip packages or missing out on hotel sales? We can help you provide a seamless user experience on your website and craft personalized marketing messages that encourage your visitors to purchase your packages.

We’re not attracting new customers
Our marketing specialists help you launch strategies that expand your reach and online visibility so more people can discover your travel services online.
