- Home
- Social Media
- Learn
- Facebook 101: Tracking Ads
Facebook 101: Tracking Ads
These metrics include

- Results: The overall results of your ads.
- Reach: How many people saw your ads.
- Cost per click: How much it cost you to get each click.
- Total budget: Your ad campaign’s budget.
- Amount spent: How much money you’ve spent on this ad campaign.
- Audience demographics: Your advertising audience.
- Placement: Where your ads display.
In addition, Facebook shows you how much money you’ve spent on ads over the past week.

All in all, you have a simplified, easy-to-use analytics system in one convenient place. It tells you everything you need to know to make sure you’re spending money on the right audience.
In addition to Facebook’s ad manager, you can also use Facebook Insights to track the success of your company’s page overall.
Facebook Insights
Facebook Insights is Facebook’s proprietary version of analytics software. It lets you keep track of all of your campaigns and pages so you can see a huge range of information in one simplified location.
That information includes demographics data, post types, and more. By default, Insights only shows a week’s worth of data. But you can change the range of dates at any time.
You can find all of this information on your Facebook Insights page:
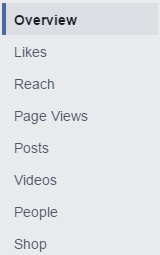
- Overview: The general stats you should know about your page.
- Likes: The number of people who’ve liked your page.
- Reach: How many people see your brand organically or through ads.
- Page Views: How many times people have viewed your page.
- Posts: The posts you’ve created and when your fans are online.
- Videos: Information on who’s watched your videos and which perform the best.
- People: Demographics on your fans, people you reach, and people you engage.
- Local: Behavior and trends of people within 150 meters of your business.
Facebook lists all of these options on the left of your dashboard so you can easily click through them.
This data is all helpful for understanding how well your overall Facebook strategy is performing. Each section is important for different reasons, and they all cover different information.
In-depth information you can get from Insights.
Overview – How you’re doing
The Overview section is a generalized visualization of how your Facebook page is performing. It shows you your likes, post reach, engagement, recent posts, and even competitors’ pages that you should watch.
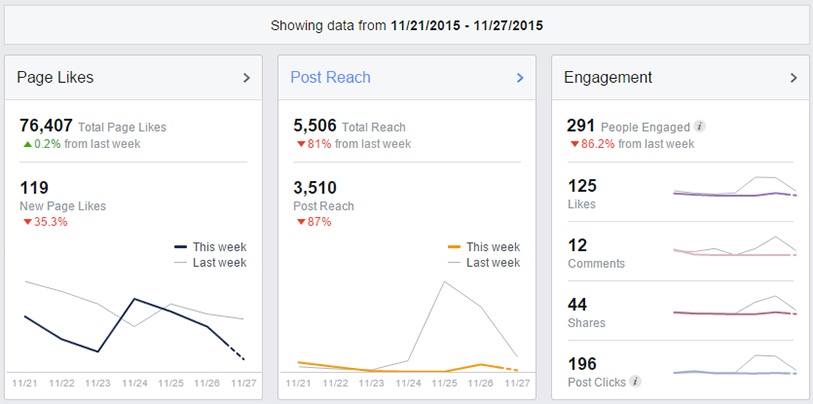
The likes, post reach, and engagement show you how you’re doing compared to a week ago (or any other timeframe you choose).
Facebook shows you your total numbers, percentage increases or decreases, and graphs that display major spikes or dips in your numbers.
The engagement area also tells you how many comments, shares, clicks, and likes your individual posts have earned (as opposed to your page as a whole).
It’s common here to see engagement numbers for clicks, likes, and comments that don’t completely stack up with your current number of followers.
The reason for that is because your followers probably shared your post with their followers, so more people saw it than you may have originally planned.
Last, the “pages to watch” section includes pages that Facebook believes are direct competition for you.
Whether or not these are 100% accurate, taking a look at their pages can help you get ideas for your own strategy.
You can choose which ones you’d like to monitor and skip the ones that aren’t quite right. That way, you don’t just have data for your page – you can see what your competitors are doing, too
Likes – Who’s “Liked” Your Page
This is the most cut-and-dry metric in Facebook insights – a single number of how many people follow your business.
This feature also comes with a graph so you can see your page’s follower growth over time.
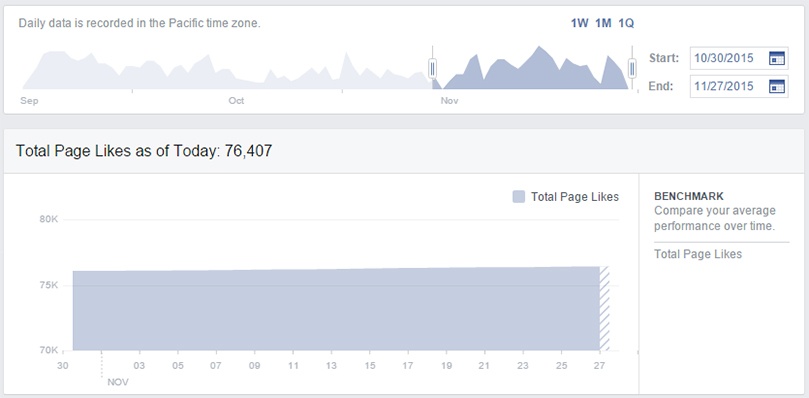
That’s not just a vanity metric, either – it has a lot of good use.
For example, if you’re looking through your “like” history and notice a huge spike on a specific day, clearly you know that you did something on Facebook that got a lot of attention that day.
With that information, you can jump over to the “Posts” page and look at what you did on that day. You’ll probably find one or two pieces of content that performed really well.
Then, you can create more content, configure similar Facebook ads, and write new posts with those exceptional performers as templates.
Reach – How Many People See Your Posts
This metric sounds straightforward, but it can get a little complicated.
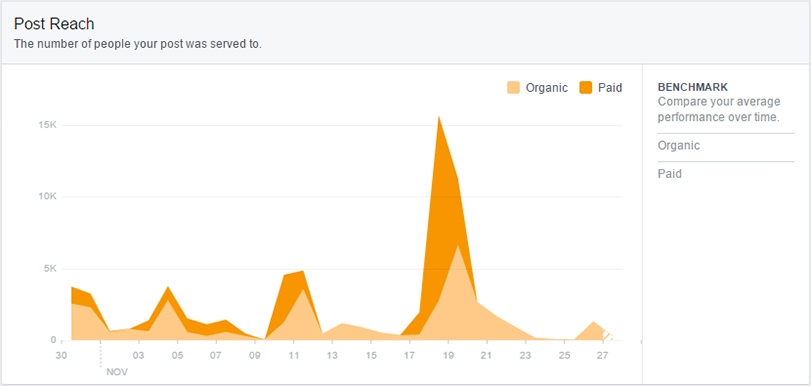
The amount of people you reach isn’t just determined by your number of followers. It also includes the friends of people who share your posts, as well as users who visit your page without following.
So even if your page only has 30 followers, one of your posts could potentially reach hundreds of people if some of those followers share it with their friends.
And when you consider the possibility that one of their friends might share your post, it’s possible that thousands could see it. All of that from a pool of 30 followers!
That’s essentially how content goes viral online.
But you don’t need to reach millions of people to be successful on Facebook. You just need to produce content that people like, share it with your followers, and let them share it with theirs.
As long as you post content that’s genuinely interesting to your followers, you won’t only have 30 of them for much longer.
Page views – how many people have looked at your page
This section is a display of how many times people have looked at your page and when they looked at it.
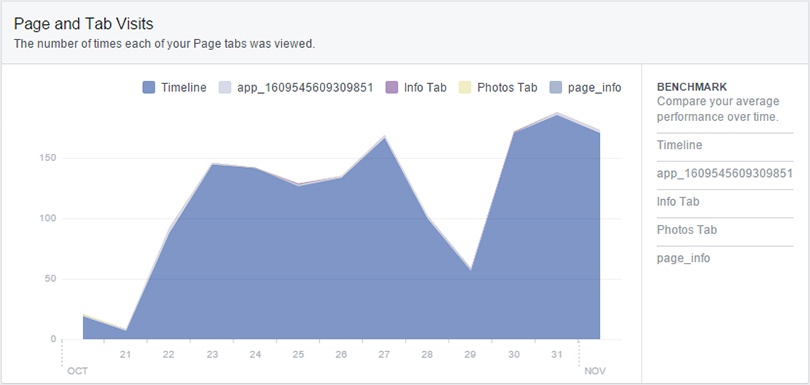
It also shows you how many people have looked at your timeline, photos, and other tabs to make sure that you know where people spend their time.
This information is helpful because it shows you the most popular parts of your Facebook page.
If people enjoy your photos, show them more photos. If they like your timeline, increase the number of times you post so your timeline stays fresh and engaging.
On top of that information, you can also see what external websites refer to your Facebook page. Most of the time, these referrers are domains that you own since you have social share buttons on your site (and if you don’t, look into it now).
Posts – your previous posts
Facebook Insights tracks all of your posts and categorizes them according to their content.
This means you can see text posts, photo posts, video posts, and other formats from a single dashboard.
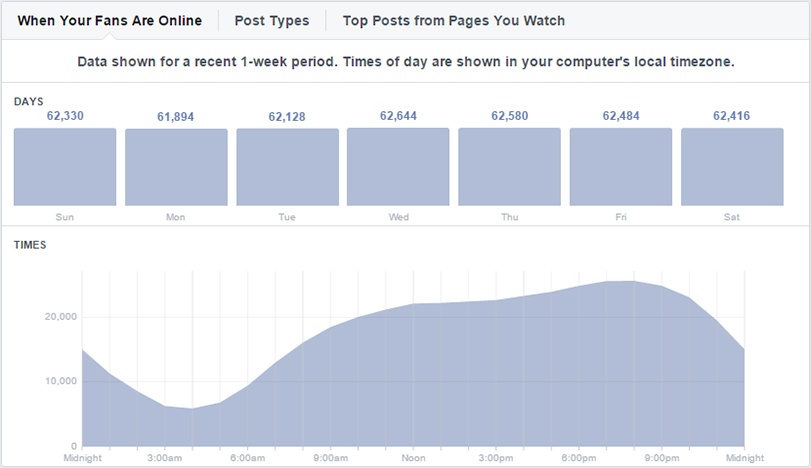
This lets you see which of your posts has been most successful – or at least visible – on Facebook.
So if you’ve found a lot of success with video posts that show off your products or services, double down on that marketing opportunity and create new videos that you can share.
Likewise, if you’ve engaged a lot of users and new followers with posts about infographics, create some more to replicate those results.
With that kind of planning, you can create an effective social media marketing strategy that has a lot of potential to attract and engage new users.
Videos – Who watches videos, how long, and when
Videos have become such a big part of Facebook that there’s an entire Insights section dedicated to them.
This section shows how many views your videos have earned over a set amount of time, and they also tell you who’s watched your videos for longer than 30 seconds.
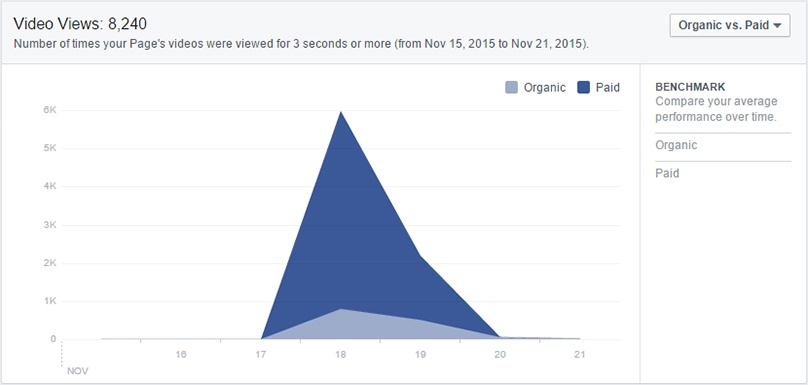
The reason that’s important is because Facebook automatically plays videos in users’ feeds, including on mobile. So someone’s device could start playing your video, but if they keep scrolling, they didn’t really watch it.
Facebook takes that into account, and lets you see how many people watched more than half a minute.
Those are the people you’re actually engaging – the ones who stop scrolling and watch your videos.
While the overall number of views is nice, it’s a flawed metric that doesn’t tell you much about your videos and their engagement levels.
So if you want to see what’s successful on your page, only look at the number of 30-second views you’ve earned.
People – Demographic data
The People section includes the ages, genders, locations, and more of the people who interact with your business on Facebook.
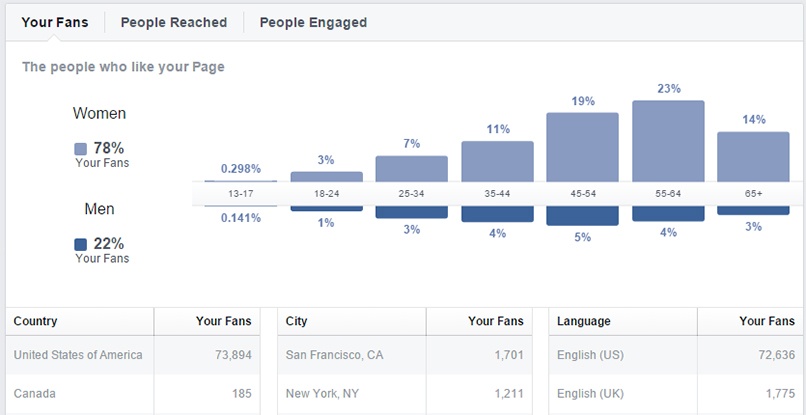
The reason this is important is because it shows you your primary audience on Facebook. Ideally, that audience will be a perfect match for your target niche, but that’s not always the case.
Big brands have an easier time reaching new and current customers than small businesses because they’re already well-known. That means they can easily find and interact with a large audience.
But small businesses have a harder time since they’re not as well-known. That means your Facebook page might start small with only friends or employees following it.
Facebook ads help fix that by reaching out to people who are customers, or are likely to become customers. Even if they don’t click through, the ads still help you grow your brand awareness, and that’ll help you steadily grow your business on social media.
The more ads you take out, the more people you’ll reach, and the more followers you’ll have. And once your Facebook page starts getting more engaged followers, your demographics will tell you everything you need to know about who’s keeping up with your business.
Local – People nearby
The local tab shows you information on how many people have been within a set distance of your business over the past month.

While this metric may be surprising to marketers who didn’t know Facebook could track this kind of information, it’s incredibly valuable to local social media campaigns – particularly storefronts.
With this information, you can see the days people are closest to your business, what time of day they’re around you, and the percentage of them that you reached on Facebook. Facebook also shows you the demographics of everyone so you can better refine your niche on social media.
Next, you get numbers on the amount of people who have been around your business since you made your page, and you can see who’s “checked in” to your location.
Last, you can review your active local-based ads and their performance.
In general, your local tab will tell you all there is to know about your business’s performance in your area. And with all of that incredibly specific information, you can make smart marketing decisions about your social media campaign moving forward – and you might even learn some new information about your audience as a whole!
But the Facebook’s Insights isn’t the only resource you have for checking the performance of your Facebook marketing strategies.
Table of Contents
- These metrics include
- In addition, Facebook shows you how much money you’ve spent on ads over the past week.
- You can find all of this information on your Facebook Insights page:
- In-depth information you can get from Insights.
- Likes – Who’s “Liked” Your Page
- That’s not just a vanity metric, either – it has a lot of good use.
- Reach – How Many People See Your Posts
- Page views – how many people have looked at your page
- Posts – your previous posts
- Videos – Who watches videos, how long, and when
- People – Demographic data
- Local – People nearby
Marketing Tips for Niche Industries
- 8 Tips for Improving Social Media for Fire Protection Companies
- 8 Ways to Get the Most out of Social Media for Breweries
- 9 Social Media Tips for Software Companies
- Attract New Clients with Social Media for Cybersecurity Businesses
- Facebook Ads for Dentists [6 Steps to Creating Ads]
- Facebook Ads for Restaurants: 10 Tips to Inspire Your Ads
- Facebook Ads for Small Business [7 Tips]
- Facebook Advertising for Lawyers: Why and How to Advertise on Facebook
- Facebook Marketing for Credit Unions
- Getting Social Media Marketing Help: a Comprehensive Guide
Find Us Driving Revenue Nationwide
- Ann Arbor, MI Social Media Agency
- Central Pennsylvania Social Media Marketing
- Social Media for Atlanta, GA
- Social Media for Baltimore, MD
- Social Media for Boston, MA
- Social Media for Charlotte, NC
- Social Media for Chicago, IL
- Social Media for Cincinnati, OH
- Social Media for Cleveland, OH
- Social Media for Harrisburg, PA


