130+ Crucial Ecommerce Stats for 2026


In this post, we’ve gathered the most comprehensive list of useful ecommerce statistics for your business.
Ecommerce Stats for 2026
And, if you want more marketing insights, subscribe to our newsletter to stay up to date on the latest ecommerce trends!
General ecommerce statistics
Check out some general ecommerce statistics for 2026 below.
1. Revenue in the ecommerce market is projected to reach $4.8 trillion in 2025. (Source)
2. $10.8 billion sales were made for Black Friday in 2024. (Source)
3. $4.6 million was the peak sales per minute for Shopify stores on Black Friday/Cyber Monday in 2024. (Source)
4. $157 was the average cart price on Black Friday in 2024. (Source)
5. The global average conversion rate is 3.52%. (Source)
6. 95% of purchases are expected to be through ecommerce businesses by 2040. (Source)
7. 95% of users look to online reviews in order to learn more about a product. (Source)
8. There were 2.71 billion online shoppers in 2024. (Source)
9. 96% of Americans are expected to buy goods and services online by 2029. (Source)
10. 40% of buyers will not buy from websites in other languages. (Source)
11. Consumers aged 25 to 34 are the largest group of online shoppers in the U.S. (Source)
12. Millennials are most likely to want to shop online (63%), while baby boomers are the only age group who prefer to shop in-store (54%). (Source)
13. 79% of the American population shops online. (Source)
14. 81% of online shoppers prefer to pay with credit cards over cash. (Source)
15. 41% of shoppers decide on online purchases by reading customer reviews. (Source)
16. 63% of respondents in the United States and the United Kingdom reported that they shopped from local websites. (Source)
Mcommerce statistics
With the increasing mobile users around the world, you’re bound to find your target audience with mobile commerce. Browse statistics on mobile commerce below:
17. Retail mcommerce sales are expected to account for more than 44% of all ecommerce sales by 2025. (Source)
18. AR accounts for $120 billion in sales in mcommerce. (Source)
19. By 2025, the global mobile coupon industry is set to grow by 56.5%. (Source)
20. 70% of all online sales during Black Friday came from mobile in 2024. (Source)
21. 75% of customers purchase products from start to finish on their mobile phones. (Source)
22. 90% of mobile shoppers say that the mobile ecommerce experience could be improved. (Source)
23. iOS shoppers convert more than Android shoppers. (Source)
24. Mcommerce spending makes up 38% of overall digital spending in the U.S. (Source)
25. By 2025, mcommerce sales will nearly reach $729 billion. (Source)
Ecommerce platform statistics
There are a few ecommerce platform options for new businesses who want to sell products online. Learn about these useful ecommerce statistics before choosing a platform for your business!
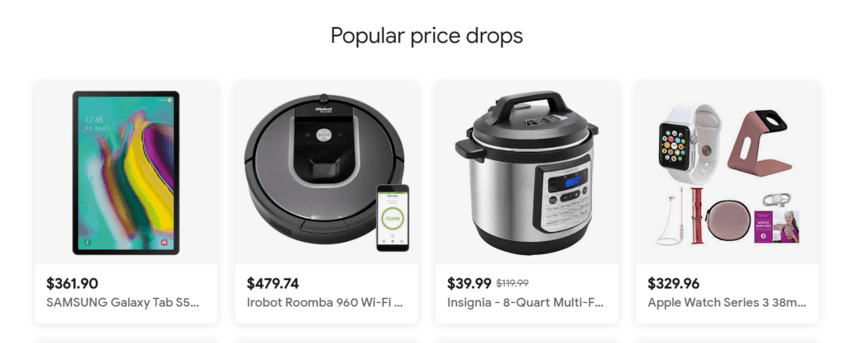
Google Shopping statistics
These ecommerce stats break down the data on the Google Shopping platform.
26. 75% of users say paid search ads make it easier to find information. (Source)
27. Google delivers an 8:1 return on investment (ROI), or $8 for every $1 spent. (Source)
28. 1.91% is the average conversion rate for Google Shopping Ads. (Source)
29. 90% of all search queries conducted across all search engine providers are done through Google. (Source)
30. 35% of shoppers complete repeat purchases from brands discovered online. (Source)
PayPal statistics
Here are some ecommerce statistics for PayPal, a popular money transfer and payment app:
31. 6.1 billion is the number of payments Paypal processed in the fourth quarter of 2024. (Source)
32. 435 million is the number of active registered accounts PayPal had by the end of 2023. (Source)
33. $31.8 billion was PayPal’s net revenue at the end of 2024. (Source)
34. More than 10.2 million live websites use PayPal. (Source)
Amazon statistics
Look no further for some ecommerce statistics on Amazon — the leading ecommerce platform worldwide.

35. The most popular product group on Amazon is Home & Kitchen. (Source)
36. There are about 2.3 million active Amazon sellers globally, with 1.1 million active sellers in the U.S. (Source)
37. $628 billion was Amazon’s net revenue in 2023. (Source)
38. U.S.-based Amazon sellers sell an average of 8,600 items every minute. (Source)
39. 300 million is the number of active user accounts on Amazon. (Source)
40. 180 million is the number of U.S. Amazon Prime members. (Source)
41. 9 out of 10 Americans are more likely to buy products from Amazon than other ecommerce sites. (Source)
42. Amazon’s U.S. retail ecommerce market share was 37.6% in 2023. (Source)
43. Amazon Prime members typically spend over $1,000 a year. (Source)
44. About three-quarters of non-Prime shoppers spend between $100 and $500 a year on Amazon. (Source)
45. 54% of all product searches happen on Amazon, not Google. (Source)
46. Amazon’s net sales from shipping and delivery were an estimated $628 billion in 2024. (Source)
47. 31% of U.S. adults now spend between $50-$100 per month on Amazon purchases. (Source)
48. 61% of paid units were sold by third-party sellers in Q4 of 2023. (Source)
Social media statistics
These social media ecommerce statistics give insight to shopping on social media.

49. 53% of global consumers say they intend to shop more through social platforms in the future. (Source)
50. 41% of consumers have discovered a product on social media in the past three months, up 14% YoY. (Source)
51. 56% of TikTok users agree that augmented reality (AR) makes the shopping experience easier. (Source)
52. 92% of Gen Z consumers want to use augmented reality tools for ecommerce. (Source)
53. 13% of social netowork users agree that the “buy” button is one of the top elements that drive purchases. (Source)
54. Facebook ranks as the top social ecommerce platform in the U.S. with more than 53.5 million buyers. (Source)
55. Consumers say Facebook has the best in-platform shopping experience. (Source)
56. 70% of online shoppers are more likely to buy a product from a brand that they had a good interaction with on social media. (Source)
57. People who have already made a social commerce purchase are 2X more likely to buy from a brand they’ve never heard of before than those who haven’t. (Source)
58. 36% of internet users say they find out about new brands and products via social media posts. (Source)
59. 27% of internet users say they find out about new brands and products via ads seen on social media. (Source)
60. 40% of Facebook user base or 1.228 billion Facebook users made at least one purchase in 2024. (Source)
61. 11% of social media users immediately make an online purchase after discovering a product, while 44% purchase later. (Source)
62. Social commerce revenue is expected to surpass $1.2 trillion in 2024, potentially reaching $6.2 trillion by 2030. (Source)
International ecommerce statistics
With an online presence, you can sell your products from almost anywhere. You’re no longer confined to the four walls of your physical store to make a sale. To highlight this potential, delve into some of these interesting international ecommerce stats.
63. $6.95 trillion is what retail ecommerce sales worldwide amounted to in 2024, and online retail revenues are projected to grow to $8.1 trillion in 2027. (Source)
64. Alibaba reached over $134.2 billion in revenue in 2024. (Source)
65. China’s retail revenue value was $6.79 trillion in 2024. (Source)
66. The highest online shopping totals were collected for Germany, who spent nearly 63 billion euros in 2020. (Source)
67. 274.70 million is the number of online buyers in the U.S. as of 2023. (Source)
68. 2.64 billion is the number of online buyers globally as of 2023. (Source)
69. 26.5 million is the number of ecommerce sites in the world. (Source)
70. 95% is the amount the ecommerce market is predicted to account for in all commerce worldwide in 2040. (Source)
71. By 2030, social commerce revenue is expected to reach $6.2 trillion. (Source)
72. The highest numbers of social commerce buyers come from Thailand (88%), India (86%), UAE (86%), and China (84%). (Source)
73. Chinese brands have a 30% conversion rate on social media. (Source)
74. 56% of Dutch shoppers had at least one social commerce transaction in 2022. (Source)
75. In 2023, ecommerce accounted for over 17% of retail sales worldwide. (Source)
76. 11.79% is the expected retail ecommerce growth for India from 2024 to 2028, with Mexico following at 11.71%. (Source)
Online ecommerce shopper demographic statistics
Eager to learn more about the diverse demographics ecommerce online shoppers? Here’s a breakdown of how various groups shop online.
77. 44% of female shoppers and 53% of males prefer to browse retail items online as opposed to in-store. (Source)
78. 97.5%of Gen Z say that social media is their primary source of shopping ideas. (Source)
79. 24% of men shop online daily. (Source)
80. 17% of women shop online daily. (Source)
81. 71% of men and 71% of women shopped on Amazon. (Source)
Ecommerce shopper behavior statistics
With more access to businesses, people often shop online to get what they need. Let’s look at some ecommerce shopper behavior stats below!
Conversion rate statistics
Learn more about ecommerce conversion rates (and the factors that affect them) through these statistics:
82. 300% is the amount conversion rates can increase with a customer relationship management system in place. (Source)
83. As of 2023, 2.8% is the average conversion rate on desktop ecommerce site. (Source)
84. 2.5% is the average conversion rate for ecommerce sites. (Source)
85. The average conversion rate for paid search is approximately 4.8%. (Source)
Cart abandonment statistics
Want to understand why people leave their carts untouched? Check out these ecommerce statistics on cart abandonment:
86. The top three reasons U.S. online shoppers give for abandoning a cart during checkout are high extra costs, the need to create an account, and lack of trust for providing credit card information. (Source)
87. $260 billion is recoverable through improved checkout processes. (Source)
88. 92% of first-time visitors don’t intend to buy anything from the store at that point. (Source)
89. 80% of online shoppers stop doing business with a company because of poor customer service. (Source)
90. 75% is the amount abandonment increases when a website is slow. (Source)
91. 50% is how much loyalty drops when your site is slow. (Source)
92. 75% of site visitors that abandoned their carts planned on returning to the site. (Source)
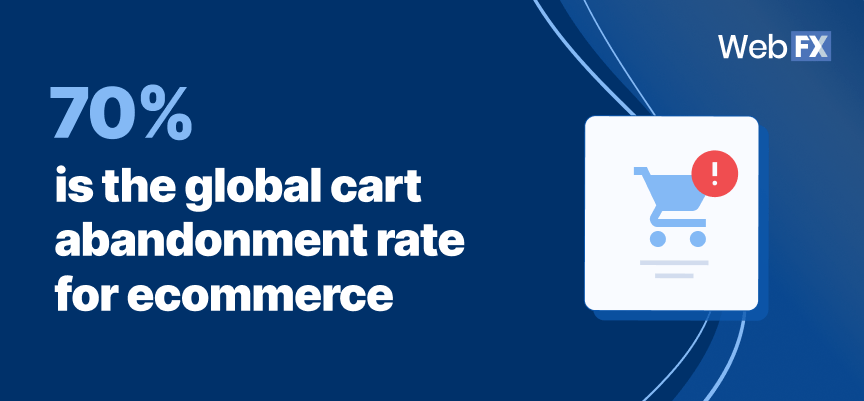
93. 70% is the global cart abandonment rate for ecommerce. (Source)
94. 48% of U.S. online shoppers abandoned a cart within the last three months because they were just browsing or weren’t ready to buy. (Source)
95. 54% of shoppers would consider purchasing previously abandoned cart items if offered a discount on them. (Source)
96. 48% of shoppers report leaving a transaction due to extra costs, such as shipping, taxes, and fees. (Source)
97. 49% of cart abandonment emails are opened on average. (Source)
98. 48% of customers say a bad web design equals a lack of credibility. (Source)
99. 34% of transactions were dropped because the website required the user to create an account before checkout. (Source)
100. 28% of U.S. shoppers abandon their orders due to a complicated or drawn-out checkout process. (Source)
101. 18% is how much conversion rate increases with abandoned cart emails. (Source)
102. 17% of customers abandoned their orders because they couldn’t trust the site with credit card information. (Source)
Shipping and delivery statistics
Here are some stats on shipping and delivery processes and preferences:
103. 83% of U.S. online shoppers expect regular communication about their purchases. (Source)
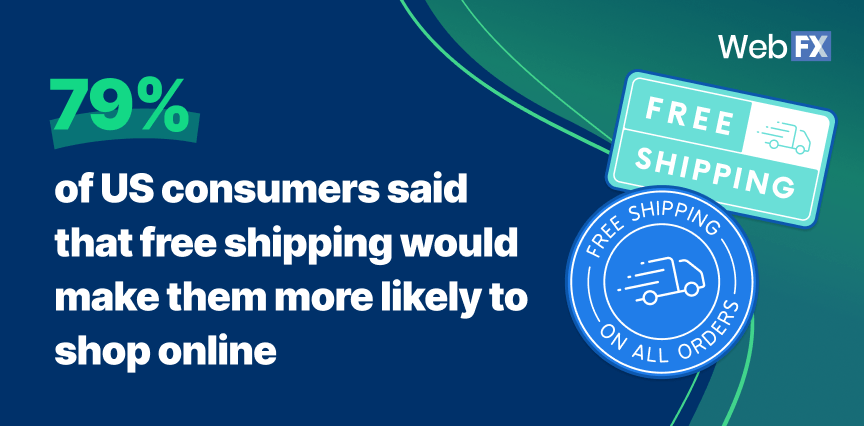
104. 79% of U.S. consumers said that free shipping would make them more likely to shop online. (Source)
105. 78% of customers said they prefer free shipping over expedited shipping. (Source)
106. 58% of consumers want free or discounted shipping, while 28% want a variety of shipping options. (Source)
107. 67% of the time, customers will choose the cheaper shipping method over the fastest one. (Source)
108. 58% of customers are willing to wait anywhere between 4-7 days to receive an item they bought online. (Source)
Returns
As you’ll see from the statistics below, returns are a necessary part of ecommerce selling. Learn more from these figures:
109. $890 billion is how much U.S. returns totaled in 2023. (Source)
110. Eight in 10 shoppers said they would be more likely to return an item in stores. (Source)
111. At least 30% of products ordered online are returned. (Source)
112. 49% of online retailers offer free return shipping. (Source)
113. 67% of U.S. online shoppers read about the return policy before purchasing a product. (Source)
114. 80.2% of online shoppers return an online purchase becuase it’s damaged or broken. (Source)
115. 30% of all products bought online are returned, compared to 8.89% of products bought in brick-and-mortar stores. (Source)
116. 53% of one survey’s respondents stated that the reason for online apparel returns across all categories is size/fit, followed by color (16%), and damage (10%). (Source)
117. Apparel, footwear, and accessories have the highest return rate among online purchases, with an average return rate of 26%. (Source)
118. 62% of consumers surveyed say they’ve used their refund to shop at a merchant’s own stores or at a third-party drop-off location. (Source)
Ecommerce marketing statistics
Here are more ecommerce marketing stats for you.
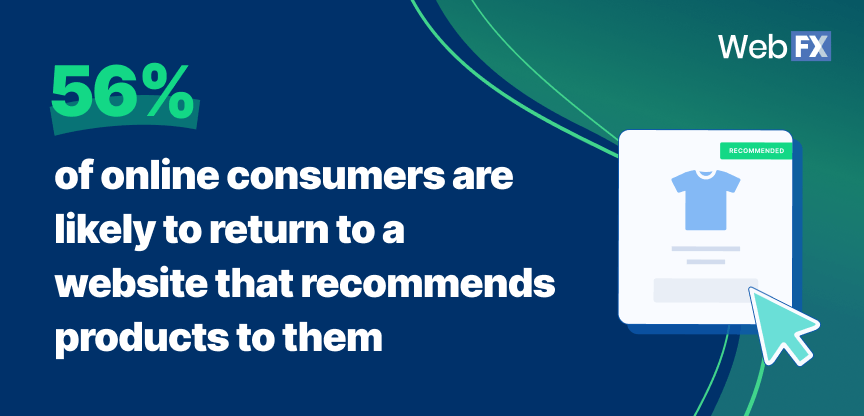
119. 56% of online consumers are likely to return to a website that recommends products to them. (Source)
120. 30% of consumers would rather return to a website they purchased from previously. (Source)
121. 75% of users notice retargeting ads. (Source)
122. 72% of successful ecommerce companies are already using automation in some parts of their workflows. (Source)
123. On average, 52% of online stores have omnichannel capabilities. (Source)
124. 51% of companies trusted by customers have representatives who are easy to reach. (Source)
125. Ecommerce business saw a 80% boost in lead generation and increased ROI by 45% by implementing ecommerce automation. (Source)
126. Product pages that used the exact keyword in the meta descriptions ranked better those that did not. (Source)
127. 16% is the number of increased conversions that cross-device targeting yields for retail advertisers in the U.S. (Source)
128. Listings with product reviews have increased conversion rates by 38% for electronics and home appliances, and 23% for online clothing stores. (Source)
129. 57% of users don’t purchase from a business online if it has less than a 4-star rating. (Source)
130. 60% of users shopping online will use a coupon online if they know there is one available. (Source)
Grow your ecommerce sales with a strategy from WebFX!
Need help turning these statistics into an actionable ecommerce marketing strategy?
WebFX has got your back. With over 30 years of digital marketing experience and over $10 billion in revenue generated for our clients in the past five years, we’ll help you incorporate important ecommerce trends into your business.
Contact us online or call us at 888-601-5359 to learn more about our ecommerce marketing services!