70+ Food and Beverage Industry Statistics That Provide Key Insights Into the Industry
Explore the latest food and beverage industry statistics of 2026 to dive deep into the market. We’ll cover various sectors, from restaurants to grocery stores, and show how food and beverage stats can help you market your company.
-
 insights from 58,800+ hours of food & beverage marketing experience

Table of Contents
- General food and beverage industry statistics
- Food service industry statistics
- General food service statistics
- Restaurant statistics
- Fast-food statistics
- Food and beverage industry statistics: Manufacturing
- Food and beverage industry statistics: Grocery stores
- Food and beverage industry statistics: Bakeries
- Food and beverage industry statistics: Marketing
- Go beyond the food and beverage industry statistics
- We Drive Results for FnB Manufacturing Companies
Current food and beverage industry statistics will help you better understand current trends and highlights. On this page, we’ll break down the stats into the following categories:
- General food and beverage industry statistics
- Food service industry statistics
- Food and beverage manufacturing statistics
- Grocery stores statistics
- Bakery statistics
- Food and beverage marketing statistics
General food and beverage industry statistics
Here are three quick general statistics for the food and beverage industry:
- The food and beverage industry is expected to grow to $8.9 trillion by 2026.
- $3,008 is how much the average household spends per year dining out.
- 29% of diners go out to eat at least once a week or more, while another 5% goout to eat once every six months.
Food service industry statistics
From restaurants to fast-food joints, the food service industry is a thriving market within the food and beverage sector.
Check out these food and beverage industry stats regarding food service, restaurants, and fast-food!
General food service statistics
First, let’s look at some general statistics about food service:
- 95% of restaurants agree that restaurant technology improves their business efficiency.
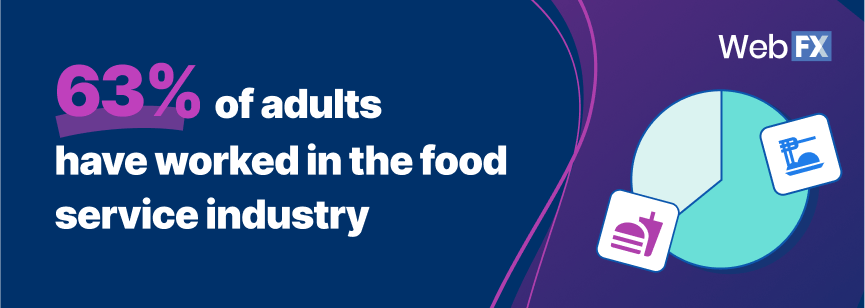
- 63% of adults have worked in the food service industry.
- 50% of people want a printed receipt after eating at an establishment.
- The average fast food service worker is around 25 years old.
- 31% of restaurants offer mobile pay.
- American households spend 10% of their income on fast food.
Restaurant statistics
Restaurants make up a large portion of the U.S. food and beverage industry. Next on this list of food and beverage industry statistics, let’s look at stats specific to restaurants:
- 9 in 10 restaurants have fewer than 50 employees
- 1 in 3 Americans have their first job experience in restaurants.
- Restaurants employ more minority managers than any other industry
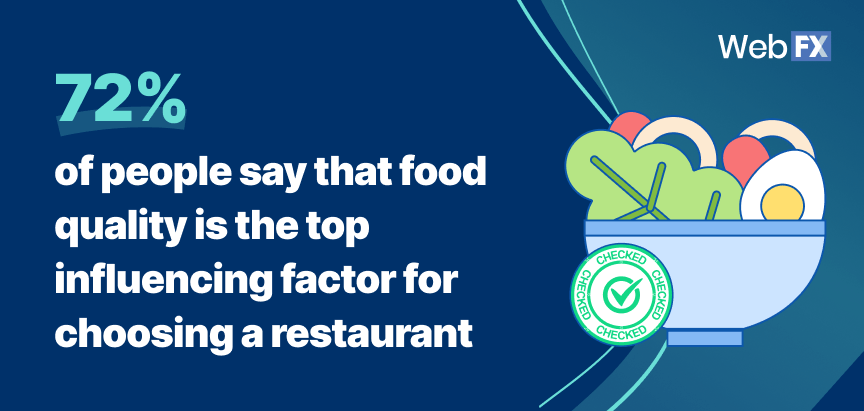
- 72% of people say that food quality is the top influencing factor for choosing a restaurant.
- 75% is the turnover rate in the restaurant industry.
- 70% of waitstaff are female.
- 65% of guests like to control how much they tip at a restaurant.
- 65% of restaurants have increased menu prices due to increased minimum wage.
- 69% of waitstaff and 56% of bartenders are female.
- 80% of chefs are male.
- 55% of people would order breakfast items at any time of day if offered.
- 53% of restaurants offer alcohol certification and food safety training.
- 46% of restaurants offer a mentor program.
- 35% of restaurant operators say training staff is a top challenge to their success.
- 31% of restaurants updated their menu every month.
Fast-food statistics
Another core component of the food industry is fast-food restaurants. Check out these U.S. food and beverage statistics regarding fast-food services:
- Alabama has the most fast-food restaurants per capita, with 6 restaurants per 10,000 residents.
- Vermont has the least fast-food restaurants per capita, with 2 restaurants per 10,000 residents.
- The fast-food industry is worth over $331 billion.
- Over 3 million people are employed in the fast-food industry.
- There are over 200,000 fast-food businesses.
- Subway is the largest franchised store, with over 20,000 locations across the U.S.
- 60% of restaurant employees are under the age of 35.
- 37% of Americans consume fast food every day.
- Fast-food restaurants that make hamburgers make up 31% of the fast-food market.
- 2.4% is the average annual growth rate of the fast-food industry.
Food and beverage industry statistics: Manufacturing
Aside from restaurants and fast-food companies, there is another sector within the food and beverage industry: Manufacturing. From boxed foods to canned drinks, the manufacturing sector is a critical industry component.
Understanding the latest food and beverage trends, like sustainable packaging and health-conscious product innovation, is crucial for manufacturers looking to gain a competitive edge.
Let’s look at some food and beverage industry statistics that show the impact of manufacturing:
- Beer is the most popular alcoholic beverage across the industry.
- PepsiCo is the biggest beverage company in the U.S. market.
- Global food production is estimated to reach nearly $4.5 trillion by 2026.
- The global beverage market is valued at $1.8 trillion.
- The U.S. non-alcoholic beverage industry is valued at $760 billion.
- Americans generate $447 billion in non-alcoholic drink sales each year.
- Soft drink sales account for $297 billion of U.S. beverage revenue.
- Americans generate over $252 billion in alcoholic beverage sales.
- Over 1.7 million workers is how much the food and beverage manufacturing industry employs.
- 950,000 is the average number of job openings each year in the food and beverage industry.
- Over 75% of food manufacturers have fewer than 100 employees.
- 60% of American adults drink coffee and bottled water regularly.
Food and beverage industry statistics: Grocery stores
Next on this list of statistics for the food and beverage industry, let’s look at grocery stores:
- Walmart is the biggest grocer in the country.
- People go to the grocery store 1.6 times per week.
- $275 billion is how much the grocery store industry is expected to grow by 2026.
- There are over 63,000 supermarkets and grocery stores.
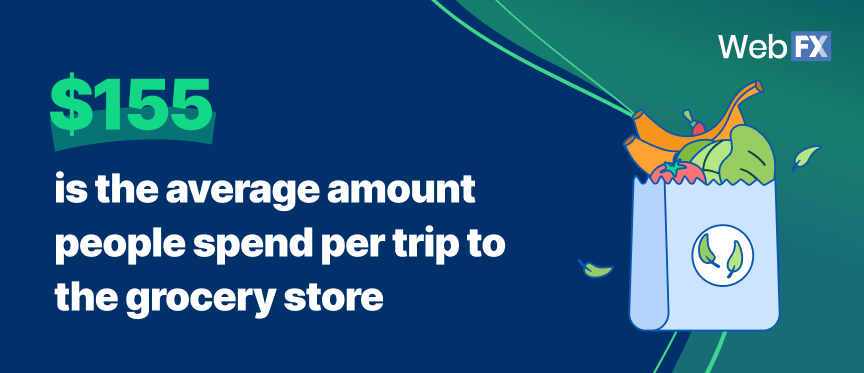
- $155 is the average amount people spend per trip to the grocery store.
- 72% of people spend less than 44 minutes grocery shopping per trip.
- 69% of people shop for groceries in person.
- 68% of shoppers use a full-size shopping cart at the grocery store.
- 59% of shoppers go to the grocery store on Friday, Saturday, or Sunday.
- 55% of people grocery shop at a mainstream grocery chain.
- 54% of people grocery shop at a supercenter.
- 35% of people spend less than $100 per grocery trip.
- 27% of people spend over $200 per grocery store trip.
- 16% of people get their groceries delivered to their homes.
Food and beverage industry statistics: Bakeries
To round out this list of stats on the food and beverage industry, let’s look at bakeries. Here’s a breakdown of food industry statistics regarding bakeries:
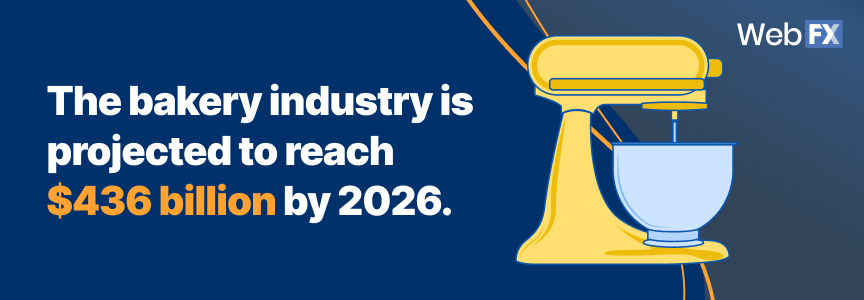
- The bakery industry is projected to reach $436 billion by 2026.
- Bread is the best-selling baking product, generating over 9 billion in revenue annually.
- Cookies are the second best-selling bakery item, driving in over 8 billion in revenue annually.
- 800,000 is how many people the baking industry employs.
- 55% of all baked goods are produced by three major companies.
- 55% of U.S. consumers regularly eat bread or bakery products.
- 11% of consumers eat gluten-free.
Food and beverage industry statistics: Marketing
To grow in this industry, you need to market what you offer. Here are some quick statistics for the food and beverage industry regarding marketing:
- 91% of restaurants use Facebook.
- 78% of restaurants use Instagram.
- 35% of diners are influenced by online reviews when deciding to eat at a restaurant.
- 23% of restaurants reach out directly to people who leave negative feedback.
- 14% of restaurants use YouTube for promotion.
- 2% of restaurant professionals don’t take action when given negative feedback from guests.
Go beyond the food and beverage industry statistics
These food and beverage industry stats highlight the impact this sector has on the economy, the makeup of its workforce, and how consumers interact with these businesses. To stay competitive in this market, you need to invest in digital marketing services to promote your food and beverage company.
WebFX is a full-service digital marketing agency that knows how to market food and beverage companies. With over 30 years of experience in the digital marketing space, we know how to craft campaigns that increase revenue and sales.
Contact us online or call us today at 888-601-5359 to speak with a strategist about our digital marketing services!
We Drive Results for FnB Manufacturing Companies
- 24 million leads generated for clients
- Dedicated account manager backed by 750+ digital experts


Table of Contents
- General food and beverage industry statistics
- Food service industry statistics
- General food service statistics
- Restaurant statistics
- Fast-food statistics
- Food and beverage industry statistics: Manufacturing
- Food and beverage industry statistics: Grocery stores
- Food and beverage industry statistics: Bakeries
- Food and beverage industry statistics: Marketing
- Go beyond the food and beverage industry statistics
- We Drive Results for FnB Manufacturing Companies
Solving key challenges for food & beverage manufacturing
Our website isn’t generating enough traffic
Get more eyes on your online menus and food services with effective website optimizations, marketing strategies, and ad campaigns.

We’re not attracting enough new customers to our local restaurant
Need to get more customers in the door for your restaurant? Our team will help you optimize your website and local SEO strategy to help your restaurant appear at the top of the search results when people search for restaurants in your local area.

We’re opening a new service
Launching a brand-new product or opening a new location? Set your business up for success by ensuring your local audience finds you online.

We’re not selling the new food services we offer
Launching a new catering service or other food services? Get your services in front of the eyes of your target audience with revenue-driving advertising campaigns and website design.
