
Marketing Analytics Glossary: 60+ Must-Know Analytics Terms in 2026













If you’re new to the world of marketing analytics, we’ve got you covered. It can be challenging to wrap your head around all the new acronyms and terminologies. That’s why we’ve compiled this 2026 ultimate data analytics terms glossary with over 60 marketing analytics definitions.This glossary is a compilation of common marketing analytics terms and definitions to help you gain a better understanding of the phrases and acronyms you might come across.And if you want to learn even more about marketing analytics and how to earn the highest possible return on investment (ROI) for your business, sign up for our newsletter, Revenue Weekly. Our subscribers get the latest marketing analytics updates and tips sent straight to their inbox from our award-winning experts!
Marketing analytics terms
Browse common marketing analytics definitions below:
A
First in our marketing analytics terms glossary, let’s look at terms that come between A and F:AcquisitionAcquisition refers to the process of earning new customers, transactions, and purchases for your business.
Active users
The active users report shows you a graph of all the people who browsed your website in the past 30 days.
Ad Rank
Ad Rank is a metric used by Google to determine the positioning of your pay-per-click (PPC) ad in the search results.
All traffic
The all traffic report shows you an overview of all the traffic to your website. You can view which channels users found your website through, where they were referred from, and more.
Analytics
Analytics term refers to the analysis of data from your website and marketing strategies that you can interpret to understand the effectiveness of your marketing efforts and where you can make improvements.
Analytics platform
An analytics platform provides you with the data you need to gain insights into your campaigns, such as Google Analytics.
Assisted conversions
Assisted conversions refer to marketing channels that help push users toward converting but aren’t the channels that give them the final push that makes them convert.
Attribution
Attribution can help you determine which channels, strategies, and marketing messages had the most impact on a user’s decision to convert.
Audience
The audience section details information about your website visitors, including the number of new and returning visitors, their demographics, and more.
Average time on page
Average time on page is a metric that describes the total time users spend on your page divided by the number of pageviews.
B
B2B marketing analytics
B2B marketing analytics refers to the process of collecting and analyzing data from business-to-business marketing campaigns to identify performance trends and opportunities for improvement.
Behavior
The behavior section enables you to track audience behavior on your website, such as the pages users visit, how much time they spend on pages, and more.
Behavior flow
A graphical representation of the path or flow each user followed when progressing through different pages on your website.
Bounce rate
Bounce rate is the percentage of users who visit your website and leave without interacting with anything on your page or navigating to a different page.
C
Channel groupingA Google Analytics feature that enables you to group marketing activities to view and compare metrics by channels, traffic sources, campaigns, and more.Click-through rate (CTR)CTR is a ratio that describes the percentage of users who clicked on your promotion or search engine result based on the total number of users who saw it.
CMO dashboard
A CMO dashboard is a comprehensive overview of your marketing performance based on key performance indicators (KPIs). It’s a centralized area that gives you a broad snapshot of how your marketing campaigns drive results for your company.
Click to open rate (CTOR)
CTOR is an email marketing metric that measures the number of clicks your emails earn relative to the number of opens.
Cohort analysis
A feature that breaks down into related groups for analysis. The groups, also called cohorts, contain shared user characteristics or experiences.
Conjoint analysis
Conjoint analysis refers to a type of audience survey used to determine which product features potential customers value most and least.
Conversions
The conversions feature allows you to create goals and track their completion. The feature offers many functionalities, including the ability to set a monetary value for each conversion to help track your potential revenue.
Your conversion rate is the number of website visitors that complete a desired goal (such as making a purchase or signing up for your emails) out of the total number of visitors.
Conversion rate optimization (CRO)
CRO is the process of improving your website for users to encourage them to perform a desired action, such as purchasing your products or investing in services, filling out a contact form, or signing up for your email newsletter.
CPA enables you to see what your business pays on average for a user to convert after viewing your advertisement.
Cost per click (CPC)
CPC measures what your business pays on average each time a user clicks on your advertisement. This metric is usually measured for pay-per-click (PPC) ad campaigns.
Cost per lead (CPL)
CPL tells you how much your business spends to generate a new lead.
Cross-device
The cross-device report enables you to track users who visit your website multiple times on different devices.
Custom
The custom category refers to any custom tracking you’ve built into your URLs.
Customer acquisition cost (CAC)
Customer acquisition cost (CAC) is your total expenses incurred to acquire a paying customer at a given time. CAC covers your marketing fees, sales costs, and your staff’s wages and taxes.
Explore Marketing Analytics Stats
D
Dashboards
are customized interfaces that you create to display specific metrics and data points. You can create a PPC dashboard, a website performance dashboard, and more.
Data analytics
Data analytics refers to the process of gathering, organizing, and assessing key metrics related to a business’s operations to uncover trends and identify opportunities for improvement.
Data management platform
Software that enables you to collect and manage data from multiple sources.
Data segmentation
Data segmentation is the process of sorting your company data — particularly your marketing, sales, and customer data — into different groups. These groups are based on shared characteristics — for example, if you’re sorting customer data, you might divide it up based on location. You then perform analytics and reoptimization separately for each group.
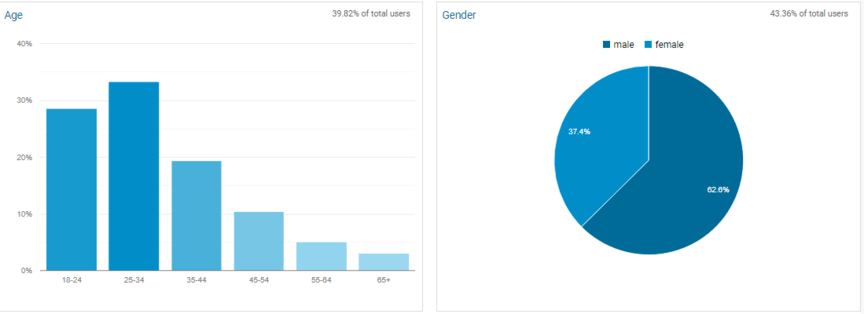
Demographics
Demographics are factors that describe users, such as their age, location, and gender, which are often used for ad targeting.
Device
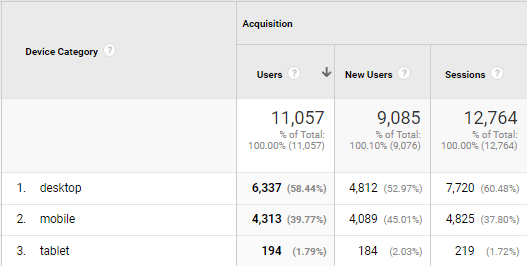
Device is a feature in Google Analytics that lets you view what types of devices your website visitors use, such as desktop computers, mobile phones, or tablets.
Direct traffic
Direct traffic contains users who visit your website by typing your URL into the search bar.
Display
Display traffic comes from users who visited your website after viewing your display ad.
Dwell time
Dwell time specifically refers to the amount of time a user spends on your website page before returning to the SERPs. Typically, the longer the dwell time, the better.
E
Ecommerce conversion rateThe percentage of online sales generated on your website based on the total number of visitors.Engagement rateYour engagement rate shows how long a user is on your website based on the amount of time they spend on your website and the pages they visit.EntrancesEntrances are a Google Analytics metric that shows the number of times a new session begins on your website.EventsEvents allow you to measure a user’s activity on your website, such as the pages they visit and what they click on and can be tracked in Google Analytics.Exit rateExit rate is the percentage of users who left your website after visiting any number of pages on your site.
F
FilterFilters are a feature in Google Analytics that enables you to alter the data displayed in your reports.
First interaction
First interaction is an attribution report model that gives all of the credit for a conversion to the users’ first interaction or touchpoint on your website.
Funnel
The process a user goes through from the first time visiting your website to becoming a customer.
Funnel conversion rate
A funnel conversion rate is the percentage of users who complete a specific action or set of actions along a marketing or sales funnel.
G
Geo
The geo report breaks down your website visitors by language and geographic location.
Goal
A goal represents any action that users complete on your website. You can set and choose custom goals. For example, you can set a goal to monitor how many users sign up to receive your emails.
Goal abandonment
Goal abandonment tracks when a user views at least one of your pages without completing the desired action.
Goal completion
Goal completion tracks a user completing your desired action in a given session.
Goal completion location
A report that shows you the page where a conversion occurred.
Google Analytics
Google Analytics is a popular web analytics platform that enables you to view, track, and analyze essential data and metrics about your website and audience.
Google Analytics 4 (GA4)
Google Analytics 4, also called GA4 or App + Web, is the new version of the tool and is a type of Google Analytics property. Besides allowing users to unify website and app analytics for increased insights into buyer journeys, GA4 also future-proofs itself by supporting cookie-free tracking and evolving privacy standards.
Google Data Studio
Google Data Studio links with Google Analytics to help you convert data into customizable and informative reports.
Google Search Console
Google Search Console enables you to track the performance of your website in Google search results.
H
HitHit is a data analytics term used in Google Analytics that describes user interactions such as pageviews, transactions, events, and more.
I
ImpressionThe total number of times your content or marketing messages are displayed regardless of whether users click on it.
In-page analytics
A category that enables you to track user interactions on a specific page.
Intelligence events
Intelligence events refers to a Google Analytics feature that automatically monitors your data and triggers alerts when significant changes occur, such as spikes or drops in website traffic, without requiring manual checks.
Interests
The interests report breaks down your website visitors’ interests by category and in-market segments.
K
Key performance indicator (KPI)Crucial marketing analytic term. KPIs are metrics that help you measure whether a marketing strategy is helping you achieve your business goals.
L
Last clickLast click is a type of attribution that gives 100% of the credit for the conversion to the last thing the user clicked on.LeadA lead is a user who shows an interest in your business, products, or services. They can show interest by contacting you, downloading your guides, signing up for your emails, and more.Lifecycle stageThe lifecycle stage shows where users are in your sales funnel and how likely they will convert.
M
Medium
Medium is a report that shows you your website traffic sources from a particular strategy, like PPC or social media, similar to channels. In other words, mediums show you exactly where your website traffic is coming from, like your paid search ads or social media page.
Metrics are values that you can use to measure and track the performance of your marketing campaigns.
Mobile
The mobile category shows you what type of mobile device your website visitors use when browsing your site.
Multi-channel funnels
Multi-channel funnels are a feature that shows you how your marketing channels work together to create sales and conversions. You can use it to get an overall picture of your sales funnel.
N
New usersNew users are people who visit your website for the first time.
O
OKRs:
OKRs stand for objectives and key results. They help you set clear goals with measurable results to help you track your progress toward reaching your goal.
Open rate
Open rate is the percentage of users who received your emails and opened them.
Optimize
Making changes and improvements to your digital marketing strategies to help them achieve better results.
Organic Search in Google Analytics
Organic search is a source of traffic in Google Analytics — one of the ways users get to your website. The term refers to unpaid listings on search engine results pages (SERPs), called organic search results.
Organic traffic
Organic traffic refers to users who visit your website after clicking on your website results in a search engine like Google.
P
PageviewA term in Google Analytics that describes when a page is loaded or reloaded.
Prescriptive analytics
Prescriptive analytics is the practice of analyzing data to provide recommendations for what your company can do next to improve your marketing results. In other words, it enables you to analyze the results of your marketing strategies and identify your next steps to optimize your campaigns to drive more revenue for your company.
Q
Qualified leadsQualified leads are users who have shown an interest in your business that are most likely to purchase your products and services.Quality ScoreQuality Score is a diagnostic tool used by Google Ads to determine your PPC ads’ quality and relevancy on a scale of one to 10.
R
Real-time
Real-time is a Google Analytics feature that enables you to view several metrics and data points as they happen on your website in real-time.
Real-time content
The real-time content report shows you which pages have been viewed in the past 30 minutes. It enables you to view which content is currently the most popular on your site.
Real-time conversions
Real-time conversion is a report that enables you to track goal completions and conversions as they occur in real-time.
Real-time events
A breakdown of events and interactions as they happen on your website in real-time.
Real-time locations
The current locations of all active users on your website.
Real-time overview
Real-time overview is the default dashboard for all real-time stats and metrics. You can view active user locations, current pageviews, and more.
Real-time traffic sources
Real-time traffic sources breaks down your pageviews in real-time per minute and per second. It also shows you which devices active visitors use to browse your website.
Referrals
When a visitor comes to your website by following a link on another website.
ROAS is a metric that measures the performance and financial return of your digital advertising strategy or campaign.
ROI helps you measure the performance of your marketing strategies by looking at how much money you earn from your investment in your marketing campaigns.
Returning users
Returning users are website visitors that have visited your site in the past on the same device.
Revenue
The total amount of money your business earns before expenses.
S
Shortcuts
Shortcuts enable you to “bookmark” a specific report for easy and quick access later. For example, if you frequently visit your demographics report, you save this report to your shortcuts, so you don’t need to search for it manually.
Search ranking
Search ranking refers to the position of your website in search engine result pages (SERPs).
Segmentation
Segmentation enables you to group your potential customers based on their wants, needs, interests, and demographics to help you better cater your advertisements and marketing messages to their needs and desires.
Session:
A session describes any time a user visits your website from an outside domain. In Google Analytics, a session will end when the visitors leave your website to visit another, close their browser, or are inactive for 30 minutes or more.
Site content
Shows a list of all pages on your website with associated user statistics, such as which pages users entered your website on and which pages they exited from.
Site search
Site search enables you to view the terms users search for on your website.
Site speed
shows a breakdown of individual page loading time, suggestions for improvements, and certain user timings.
SMB marketing analytics:
SMB marketing analytics refers to the process of tracking and analyzing marketing data — such as website behavior and ad interactions — to gain insights into how a small or medium-sized business’s campaigns are performing.
Social
Social is a marketing channel that tracks website traffic coming from social media sites.
Source
A source describes the location where a user found your website. For example, a source from “Google” shows that a user found your website after conducting a search on Google.
T
Technology
This report displays your website traffic by your visitor’s technology, such as platform, screen resolution, and operating system.
Traffic describes users who visit your website.
Traffic source describes where your users originate from. For example, traffic can come from your PPC ads, social media ads, or search engines.
Time on page
A metric calculated in Google Analytics that describes the average amount of time a user spends on a page.
Time on site
A metric calculated in Google Analytics that describes the average amount of time a user spends on your website regardless of how many pages they visit.
U
Unique pageviews
A unique pageview counts a page as viewed only once, even if it was viewed multiple times in a single session.
Unsubscribe rate
Unsubscribe rate is a metric in email marketing that describes the percentage of users who chose to stop receiving your emails.
URL
The web address of a website or web page.

Users
A user is a person who viewed your website.
Users flow
A graphical representation of the paths users took through your site, from the source to the various pages they visited to the page they exited on.
V
Visitor flowA feature from Google Analytics that enables you to view the path users take when on your website.VisitorsThe users that visit your website.
W
Waterfall chart
A waterfall chart — also known as a cascade chart or bridge chart — refers to a type of bar graph used to visualize gains and losses over time, such as changes in revenue or leads, and can start and end at different values rather than always beginning at zero.
Website conversion
A website conversion happens when someone completes a pre-determined and desired action on your website, like signing up for a newsletter, sharing a blog post to social media, or buying a product. The percentage of people that complete your desired action is your conversion rate.
Website metrics
Website metrics is a general term that refers to methods of measuring a website’s performance. Examples of website metrics include traffic, bounce rate, top-viewed pages, and conversion rate.
We foster and form long-term partnerships so that your business has long-term results.
Over 90%
Boost the success of your marketing campaigns with marketing analytics services from WebFX
Are you ready to start driving more revenue for your business with marketing analytics but aren’t sure where to start? Are you finding it tricky to understand the above marketing analytics definitions? If so, WebFX can help!WebFX is an industry-leading digital marketing agency that specializes in using marketing analytics and essential metrics to create data-driven campaigns that will drive impressive results for your business. From social media campaigns to SEO strategies, we can do it all.Our award-winning team will implement, manage, and optimize your digital marketing campaigns so you can focus on your other business tasks. We’ve already helped clients drive over $10 billion in revenue, and we can help you boost your sales and revenue too.Speak with one of our strategists today by calling 888-601-5359 or contact us online to learn how our marketing analytics services can help grow your business.