-
 10 min. read
-
 Sarah Berry
 Web Marketing Consultant
- Sarah Berry is a Google Analytics-certified Web Marketing Consultant at WebFX. She’s written over 400 articles on digital marketing, covering topics like SEO, CRO, and Amazon. When she isn’t polishing her Time Magazine Person of the Year Award, she’s spending time with her flock of ducks.
Does Amazon have analytics?
Oh, it does! If you’re a member of Amazon Brand Registry, go ahead and log in to your Seller Central or Vendor Central account, because this post explores some of the most powerful shopper data available to Amazon sellers: Amazon Brand Analytics.
Amazon Brand Analytics is an exclusive tool for Amazon Brand Registry members, also called Brand Owners. With Brand Analytics, businesses can access insightful reports and actionable data to inform their decisions when it comes to marketing, advertising, and selling on Amazon.
Keep reading to learn more about how to use Amazon Analytics for sellers!
For even more information about selling on Amazon, sign up for Revenue Weekly. You’ll get tips directly in your inbox for marketing and advertising your products on Amazon, as well as measuring your return on investment (ROI) from the world’s biggest ecommerce platform.
What is Amazon Brand Analytics?
Amazon Brand Analytics is an Amazon Seller Central and Amazon Vendor Central tool for Amazon Brand Registry members. Brand Analytics contains five reports:
- Amazon Search Terms
- Repeat Purchase Behavior
- Market Basket Analysis
- Item Comparison and Alternate Purchase Behavior
- Demographics
Brands can use these reports to make decisions about their product lineup, plus marketing and advertising strategies.
Who can use Amazon Brand Analytics?
If you want to use Amazon Brand Analytics, you must meet the following requirements:
- Brand owner
- Amazon Brand Registry member
- Responsible for selling that brand on Amazon
- Brand maintains an active registered trademark
If you meet all these requirements, except the Amazon Brand Registry requirement, you can file to become a member. The program, which protects your brand and products against knock-off versions, is free. For help with all the paperwork, check out our Brand Registry consulting services for Amazon!
How do I access Amazon Brand Analytics?
You can start using Amazon Brand Analytics by following these steps:
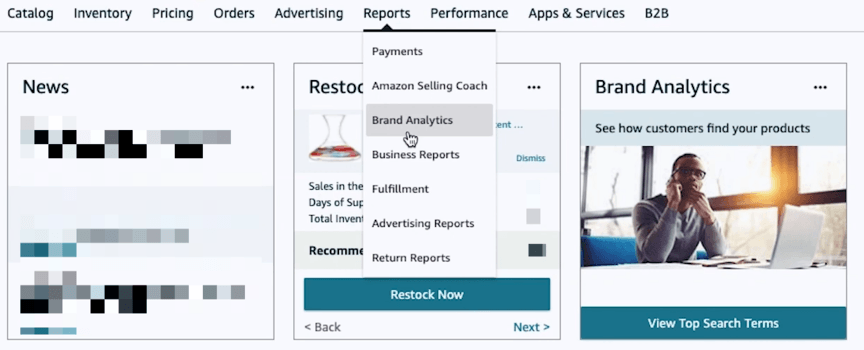
- Log in to your Amazon Seller Central or Amazon Vendor Central account
- Click “Reports” from the main navigation menu
- Select “Brand Analytics” from the dropdown menu
Once you click “Brand Analytics,” you can start learning how to use Amazon analytics.
5 reports to view in Amazon Brand Analytics
Within Amazon Brand Analytics, you’ll find five reports:
- Amazon Search Terms
- Repeat Purchase Behavior
- Market Basket Analysis
- Item Comparison and Alternate Purchase Behavior
- Demographics
Keep reading to learn what these Brand Analytics reports share and how you can use them to grow your sales!
1. Amazon Search Terms
What is Amazon Search Terms?
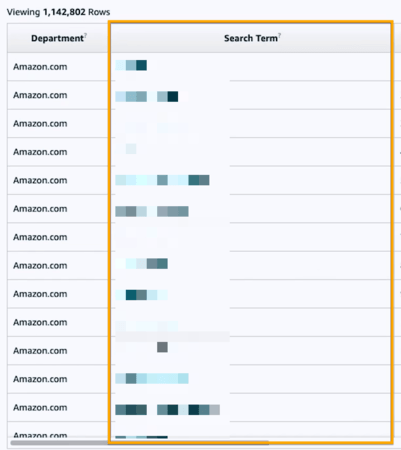
Amazon Search Terms reveals how shoppers found your products (and even your competitor’s products) by sharing the search terms that led consumers to your product listings. This report also highlights the share of clicks and conversions your product earned for specific search terms.
What data does Amazon Search Terms share? You can access the following data for a given product and period in the Amazon Search Terms report:
- Search terms: The search term that people used to find your product.
- Search frequency rank: A search term’s popularity compared to other search terms.
- Click share: The number of times Amazon shoppers clicked on a specific product after using a particular search term compared to the total number of times Amazon shoppers clicked on any product after using that search term.
- Conversion share: The number of times Amazon shoppers purchased a specific product after using a particular search term compared to the total number of times Amazon shoppers bought any product after using that search term.

How can I use Amazon Search Terms? Use Amazon Search Terms to:
- Learn which keywords drive the most sales for a product
- Determine which keywords generate the most clicks for a product
- Uncover new keywords to target for a product listing
You can use this report to benefit your product listing optimization, plus Amazon ad campaigns.
2. Repeat Purchase Behavior
What is Repeat Purchase Behavior? Amazon Brand Analytics’ Repeat Purchase Behavior provides valuable insight into repeat purchases of your product.
What data does Repeat Purchase Behavior share? You can view the following data for a given product and period in the Repeat Purchase Behavior report:
- Orders: The total number of orders, both first-time and repeat.
- Unique customers: The total number of unique customers, both first-time and repeat.
- Repeat customers: The percentage of repeat customers, based on the number of unique customers.
- Repeat purchase ordered product sales: The percentage of sales that came from repeat purchases. Brand Analytics also expresses this number as a monetary value so you can quickly calculate the financial impact of repeat purchases.
How can I use Repeat Purchase Behavior? Take advantage of the Repeat Purchase Behavior report to:
- Understand the impact of repeat purchases on your bottom line
- Learn which products drive the most repeat purchases
- Strategize how to generate more repeat purchases, like through advertising
Amazon remarketing ads offer an excellent way to drive repeat purchases of your products.
3. Market Basket Analysis
What is Market Basket Analysis? Market Basket Analysis shows what other products shoppers buy with your products.
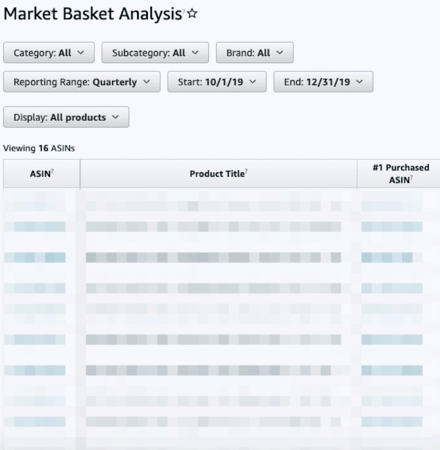
What data does Market Basket Analysis share? The data you can view in the Market Basket Analysis report for a given product and period include:
- Product ASIN: The ASIN of the product bought most often with your product.
- Product title: The title of the product most often bought with your product.
- Combination rate: The percentage of orders that include your product, plus the other product.
Keep in mind that Product ASIN and product title will likely include a numerical label, like “#1 Purchased ASIN,” or the product most often purchased with yours. The second-most purchased product with yours will then have the label, “#2 Purchased ASIN.” How can I use Market Basket Analysis? Reference the Market Basket Analysis report to:
- Identify opportunities to launch a new product
- Update ad targeting to include the products most often purchased with yours
- Determine which products to bundle together
Even if your business isn’t looking to expand its product line, you can use this report to create a smarter ad campaign. By targeting the products that people most often buy with yours, for example, you can drive more sales and generate a higher return on ad spend (ROAS).
4. Item Comparison and Alternate Purchase Behavior
What is Item Comparison and Alternate Purchase Behavior? Item Comparison and Alternate Purchase Behavior reveals the top three products shoppers compared and purchased — instead of yours. The report also shares how often your product gets compared to those top three products.
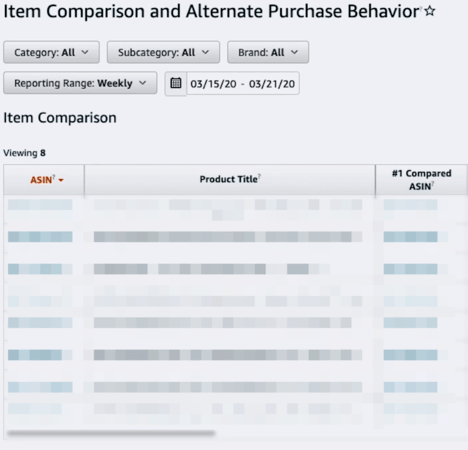
What data does Item Comparison and Alternate Purchase Behavior share? The following data, for a given period and product, is available in Amazon Brand Analytics’ Item Comparison and Alternate Purchase Behavior report:
- Compared ASIN: The ASIN of the compared product.
- Compared product title: The title of the compared product.
- Compared percentage: The percentage of times that product got compared to yours.
- Purchased ASIN: The ASIN of the product purchased over yours.
- Purchased product title: The title of the product purchased over yours.
- Purchased percentage: The percentage of times that product got purchased over yours.
How can I use Item Comparison and Alternate Purchase Behavior? Take a look at the Item Comparison and Alternate Purchase Behavior and use it to:
- Find competing products
- Build ad campaigns to target competitor products
- Improve your product listing descriptions to counter competitor unique selling points (USPs)
Item Comparison and Alternate Purchase Behavior is one of the most insightful reports available in Amazon Brand Analytics. Use its data to go after competitors with both search engine optimization (SEO) and pay-per-click (PPC). If you need help, we’ve helped our clients manage more than 14.9 million transactions and generate more than $6 billion in revenue — and that’s just in the past five years.
Check out our Amazon SEO and Amazon PPC services to see what we can do.
5. Demographics
What is Demographics? The Demographics report in Amazon Brand Analytics helps your business understand who purchases your products by sharing demographic data, like age, gender, education, marital status, and household income.
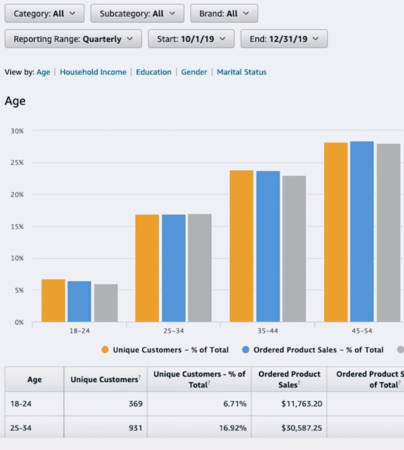
What data does Demographics share? Within the Demographics report, you can view the following data for a given period:
- Age: The age range of your customers, like 18-24.
- Household income: The estimated household income of your customers.
- Gender: The gender of your customers.
- Education: The education level of your customers.
- Marital status: The marital status of your customers.
- Unique customers: The number and percentage of customers associated with a specific demographic.
- Product sales: The number and percentage of sales that come from a specific demographic.
- Ordered units: The number and percentage of sales from a specific demographic.
Your Demographics report may contain slightly skewed data if a household shares a single account. How can I use Demographics? Use the Demographics report to:
- Improve your buyer persona
- Upgrade your ad targeting settings
- Inform your future product developments
For the most value, it’s helpful to view the Demographics report by quarter. A quarterly period will provide you with more data and help you compile more actionable takeaways when it comes to your ad targeting and buyer personas.
How to use the Brand Dashboard in Amazon Brand Analytics
Besides those five reports in Amazon Brand Analytics, you can also use the Brand Dashboard to view:
- Products with less than five reviews
- Products without detail page attributes
- Products that need A+ Content
- Products without Sponsored Product Ads
- Products that received a review of three stars or less
- Products with underused search terms
- And more
You can visit the Brand Analytics Dashboard in Amazon Seller Central or Amazon Vendor Central by:
- Logging into your Amazon Seller Central or Amazon Vendor Central account
- Clicking “Performance” from the main navigation
- Selecting “Brand Dashboard” from the dropdown menu
Once you’re in the Brand Dashboard, you can start viewing those notifications!
How to use Amazon Brand Analytics for your business
When it comes to how to use Brand Analytics, use these tips:
- View your Amazon Brand Analytics reports on a monthly, quarterly, and yearly basis
- Use your reports to enhance your product listing optimization, like by targeting new keywords
- Improve your Amazon ads by updating ad targeting settings and creating new campaigns
- Inform your product research and development by understanding user purchase behavior
- Target your competitors using SEO and PPC to claim more sales and market share
With these tips, your business can start getting even more value from selling on Amazon.
Need help making sense of Amazon Brand Analytics?
Yes, Amazon does have analytics, and yes, it’s a lot of data to review. If you’re looking for help with making the most of your data, like to get a better ROAS from advertising or higher rankings in Amazon search results, WebFX can help. We feature a dedicated team of more than 500 Amazon specialists.
Plus, we’ve helped our clients earn more than $6 billion in the past five years. Learn more about how our award-winning, U.S.-based team can partner with your business to drive more revenue (and a higher ROI) from Amazon by contacting us online or giving us a ring at 888-601-5359 today!
The first step to increasing your SMB’s Amazon sales is getting a FREE proposal.
One of our experts will be in touch within 24 hours!
-
 Sarah Berry is a Google Analytics-certified Web Marketing Consultant at WebFX. She’s written over 400 articles on digital marketing, covering topics like SEO, CRO, and Amazon. When she isn’t polishing her Time Magazine Person of the Year Award, she’s spending time with her flock of ducks.
 -

WebFX is a full-service marketing agency with 1,100+ client reviews and a 4.9-star rating on Clutch! Find out how our expert team and revenue-accelerating tech can drive results for you! Learn more
Try our free Marketing Calculator
Craft a tailored online marketing strategy! Utilize our free Internet marketing calculator for a custom plan based on your location, reach, timeframe, and budget.
Plan Your Marketing Budget
Table of Contents
- What is Amazon Brand Analytics?
- Who Can Use Amazon Brand Analytics?
- How Do I Access Amazon Brand Analytics?
- 5 Reports to View in Amazon Brand Analytics
- How to Use the Brand Dashboard in Amazon Brand Analytics
- How to Use Amazon Brand Analytics for Your Business
- Need Help Making Sense of Amazon Brand Analytics?

Maximize Your Marketing ROI
Claim your free eBook packed with proven strategies to boost your marketing efforts.
Get the GuideTry our free Marketing Calculator
Craft a tailored online marketing strategy! Utilize our free Internet marketing calculator for a custom plan based on your location, reach, timeframe, and budget.
Plan Your Marketing Budget

![Amazon Brand Analytics: How to Use Amazon Analytics [Guide]](https://www.webfx.com/wp-content/uploads/2021/10/amazon-brand-analytics-gif.gif)


