Imagine for a second that you’re in your kitchen cooking and preparing a meal. What would happen if you decided to check everything at the end instead of checking it as you cook it? You would risk having soggy noodles, dry meat, or burnt vegetables.
Just like in cooking, it’s essential to track the progress of your marketing as you go along. That’s why you want to determine your website’s key performance indicators (KPIs) so you know what to track. Website KPIs provide you with the insights you need into your marketing so you can adjust along the way.
But how do you measure website performance? Here are eight website KPIs you’ll want to track:
- Traffic source
- Average session duration
- Bounce rate
- Page load speed
- Pages per session
- Conversions
- Goal/event completions
- Return on investment (ROI)
Keep reading to learn more about these marketing KPIs!
Psst…Want to get insider marketing knowledge that helps you get a step ahead of your competition? Join 200,000 savvy marketers by subscribing to Revenue Weekly!
Learn More: How to Measure KPIs
8 website KPIs to track your performance
If you want to know how to measure website performance, start by looking at acquisition metrics. Acquisition metrics indicate whether you’re attracting traffic to your website. Here are two important KPIs for your website:
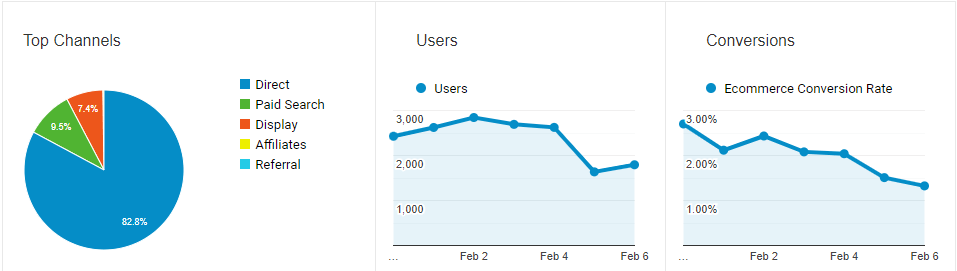
1. Traffic source
Where to find this KPI in Google Analytics: Acquisition > All Traffic > Channels
The goal of your small-to-midsized business (SMB) is to drive qualified traffic to your website. To see if you’re achieving that goal, you need to track the source of your traffic.
Tracking your traffic by source lets you see which campaigns drive qualified traffic for your business. It enables you to understand which marketing campaigns drive the best results so that you can put more time and effort into them. You can also use this website KPI to determine which campaigns you need to improve.
2. Average session duration
Where to find this KPI in Google Analytics: Audience > Overview
The next one of the website performance metrics we’ll look at is average session duration. Average session duration measures how long people interact with your business during a session.
A session involves any pages a person visits and interacts with during their time on your website. So, for example, if someone visits your homepage, checks out a blog post, looks at a product page, and leaves your website, that’s one session. If they spent 13 minutes doing that whole process, the session duration would be 13 minutes.
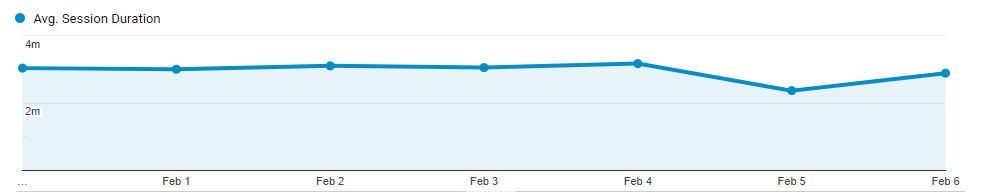
The average session duration indicates the average amount of time people spend on your website when they visit. You want to see a longer average session duration because it indicates that your website provides helpful, valuable, and useful information to your audience.
This metric is one of the key metrics for website performance to monitor because it indicates how well your pages perform for searchers. You can discover if you’re providing helpful information that keeps users engaged, or learn if you need to improve your pages to drive longer sessions.
Keep in mind that the average session duration is around two to three minutes. You can aim to meet this average session, but keep your business and audience in mind. Your average session duration goals may be lower because of the nature of your business or audience.
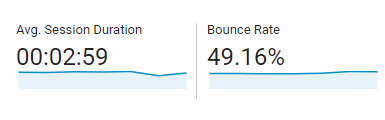
3. Bounce rate
Where to find this KPI in Google Analytics: Behavior > Overview
The next item on our list of KPIs for websites is bounce rate. Bounce rate measures how many people visit a page on your website and leave it immediately without visiting any other pages.
This metric is one of the most important KPIs for your website because it indicates whether you’re delivering a positive user experience for your audience. If all your pages have a high bounce rate, it typically suggests that your page isn’t relevant to the searchers.
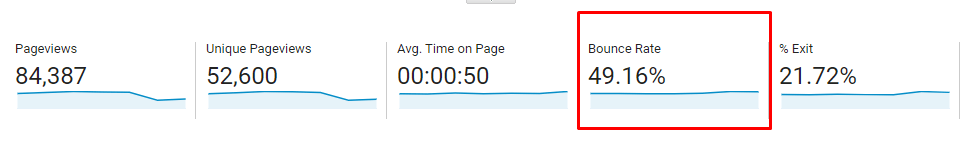
You want to track this metric to see if you’re keeping prospects engaged on your website. If you have a high bounce rate, you can optimize your pages to keep people engaged on them longer.
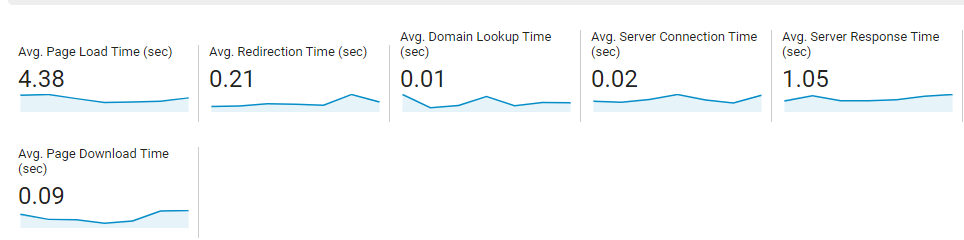
4. Page load speed
Where to find this KPI in Google Analytics: Behavior > Site Speed > Overview
If you want to know how to measure website performance, track your page load speed. Did you know that 53% of people will abandon a website if it takes more than three seconds to load? Your website needs to load quickly to deliver the helpful information users want.
You can use Google Analytics to help you track how quickly your website loads. You can see load times for individual pages to gain insight into how these pages perform. It enables you to pinpoint individual pages that load slowly to optimize those pages to improve their load times.
When you improve your website’s load time, you deliver a better user experience. People spend more time on websites that load faster, which sends a positive signal to Google that your page is relevant. As a result, your website can gain higher rankings in search results and drive more qualified traffic.
5. Pages per session
Where to find this KPI in Google Analytics: Acquisition > All Traffic > Channels
Next on our list of website performance metrics is pages per session. Pages per session tells you how many pages people visit before they end their session. It indicates whether people only visit one page or browse around your website.
A session, as mentioned above, includes any activity completed within a certain period. Sessions time out after 30 minutes if a user doesn’t end the session themselves.
Your pages per session metric can help you understand whether your website’s flow encourages people to visit multiple pages on your website. A website with organized and easy-to-use navigation and noticeable call to action (CTA) buttons will garner more pages per session.
You want to track your pages per session to see if people are visiting multiple pages or dropping off after a page or two. This website KPI can help you gain insight into your audience’s behaviors, so you can adjust your campaigns to meet their needs.
6. Conversions
Where to find this KPI in Google Analytics: Conversions > Multi-Channel Funnels > Overview
Next on our list of website performance metrics is conversion rate. Conversion rate measures the percentage of people who convert from an advertisement or piece of marketing compared to everyone who saw the materials. This website KPI is critical for tracking your website’s ability to drive revenue.
Google Analytics makes it easy for you to see which channels drive conversions. You can go into the Multi-Channel Funnels section to see a breakdown of the number of conversions you’ve received, as well as any assisted conversions.
![]()
Tracking your conversion rate lets you see if your marketing campaigns effectively drive people to buy on your website. It can help you identify the shortcomings on your website, so you can fix them to drive better results.
7. Goal/event completions
Where to find this KPI in Google Analytics: Conversions > Goals > Overview
One of the KPIs for your website that you’ll want to track is goal/event completions. This KPI lets you see how many people complete your goal or event actions. Goals can be tied to sales, but they can also be objectives like filling out a form or signing up for an email list.
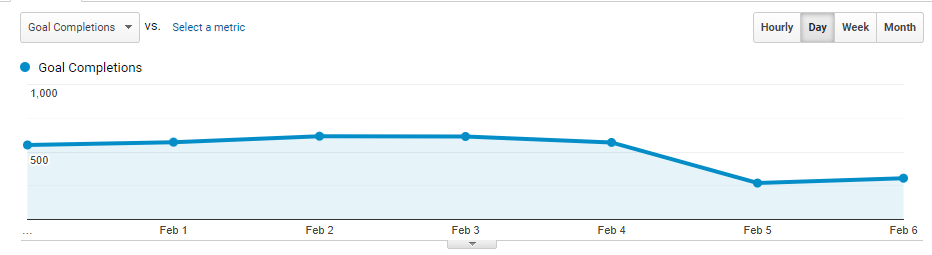
You want to track these website KPIs because they indicate whether people are completing your goals. If people aren’t completing them, you can evaluate the pages to see how to improve.
8. Return on investment (ROI)
Where to find this KPI in Google Analytics: Conversions > Ecommerce > Overview
Last on our list of website performance metrics is return on investment (ROI). ROI is a critical metric to track because you want to ensure that the money you’re investing in your marketing results in sales that boost your company’s revenue.
While there is no specific metric in Google Analytics for tracking ROI, the data needed to calculate ROI is in Google Analytics.
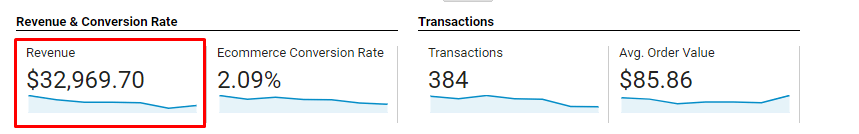
To calculate ROI, you use this formula:
((Revenue-costs)/costs) x 100 = ROI
You can better understand which marketing strategies help you earn sales and grow your business by tracking your ROI.
Need help making sense of your website KPIs?
Now that you know how to measure website performance, you may feel unsure about what your website KPIs mean. That’s where the experts at WebFX can help.
We offer Google Analytics consulting services to help you track and analyze KPIs for your website, so you can create an effective marketing campaign that drives the results you desire. With over $10 billion in revenue driven for our clients in the past five years alone, you can feel confident we’ll deliver the results you desire.
If you’re ready to start driving more revenue than your competition, contact us online or call us today at 888-601-5359 to speak with a strategist today!
-
 Macy Storm is a Content Marketing Consultant at WebFX. She has 5+ years of experience creating content for all digital strategies and across 10+ industries. With a B.A. in Communications, she’s used her writing skills to write over 1,000+ pages for WebFX and SEO.com. Her work has been featured by Search Engine Journal, HubSpot, Entrepreneur, Clutch, and more. When she’s not clacking her keys, she’s playing video games, reading, or counting how many times people say her puppy Daisy is cute (it’s a lot of times). View full profile
 -

WebFX is a full-service digital marketing agency delivering revenue-driving strategies across online advertising, SEO and AI search optimization, and digital marketing. Backed by 1,100+ client reviews, a 4.9-star rating on Clutch, and proprietary revenue-tracking technology, our team helps businesses grow visibility and revenue across platforms, from Google to ChatGPT to LinkedIn. Discover how our expert team and revenue-accelerating tech can drive results for you. Learn more
Try our free Marketing Calculator
Craft a tailored online marketing strategy! Utilize our free Internet marketing calculator for a custom plan based on your location, reach, timeframe, and budget.
Plan Your Marketing Budget
Share this article

Proven Marketing Strategies
Try our free Marketing Calculator
Craft a tailored online marketing strategy! Utilize our free Internet marketing calculator for a custom plan based on your location, reach, timeframe, and budget.
Plan Your Marketing Budget
What to read next